The global Treasury and Risk Management (TRM) software market is a $6.9 billion industry, and enterprise TMS platforms like Kyriba, FIS Quantum, ION Treasury, and GTreasury power the global cash-management function for roughly 4,000 of the world’s largest companies. But that solution path — Kyriba’s 6-12 month implementation, FIS and ION’s 12-24 month rollouts, six-figure annual contracts — is the wrong answer for a Treasury team managing 5-50 bank accounts across a mid-market corporate. For those teams, the working reality is still a monthly Excel workbook consolidating bank balances, loan exposures, counterparty risk, and interest rate movements. That’s where the Treasury Management Dashboard in Power BI fits.
This is a ready-to-use .pbix template that plugs into your existing bank statement exports, loan register, and ERP transaction feed, and produces a five-page executive dashboard covering cash positioning, bank exposure, counterparty concentration, interest rate monitoring, and month-over-month trend analysis. If your team already has Power BI Pro licenses ($14/user/month) or Microsoft 365 E5, you can open this file, connect your data, and publish a live Treasury dashboard to your CFO the same afternoon.
Why Mid-Market Treasury Teams Need a Bridge Between Excel and Enterprise TMS
- The global TRM software market hit $6.9 billion in 2024 and is forecast to reach $8.8 billion by 2029, growing at a 5.1% CAGR as demand for cash automation rises.
- Enterprise TMS implementations take 6-24 months — Kyriba’s typical deployment runs 6-12 months, FIS Quantum and ION Treasury often stretch to 18-24 months.
- Kyriba’s own customer reviews cite “complexity” and “implementation issues” among the top pain points, alongside the strength of the platform itself.
- Kyriba serves about 4,000 organizations globally — meaning hundreds of thousands of corporate treasury teams below that line still run their function in Excel.
For companies managing $100M-$5B in annual revenue with 5-50 bank accounts across one to three currencies, a full TMS is overbuilt, overpriced, and overkill. What these teams actually need is: (1) a consolidated daily or weekly cash position across all banks, (2) visibility into loan exposure and maturity ladder, (3) counterparty and bank concentration monitoring for risk policy compliance, and (4) interest rate and cash flow trend analysis to inform funding decisions. A structured Power BI template delivers all four — without an enterprise procurement cycle.
What’s Inside the Treasury Management Dashboard
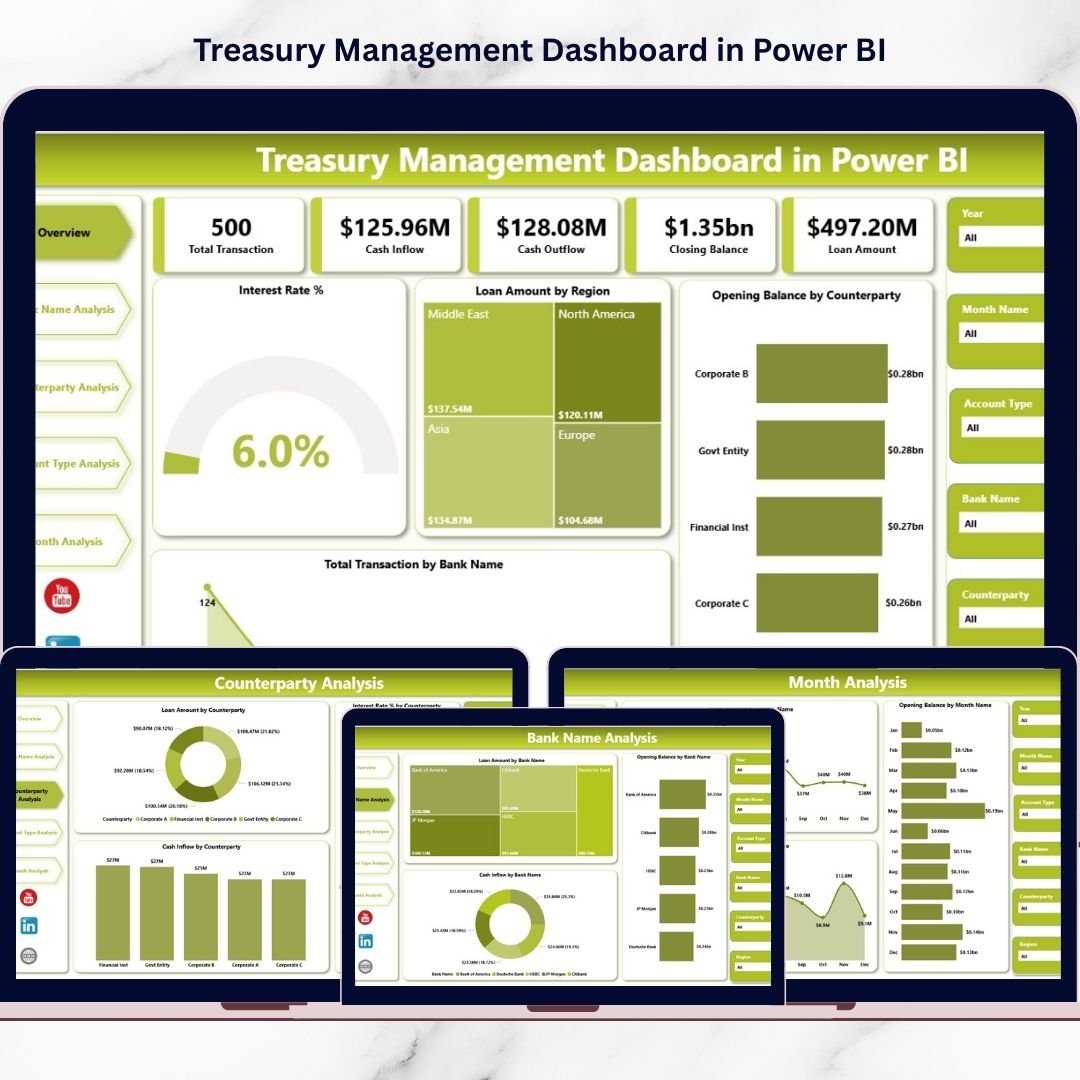
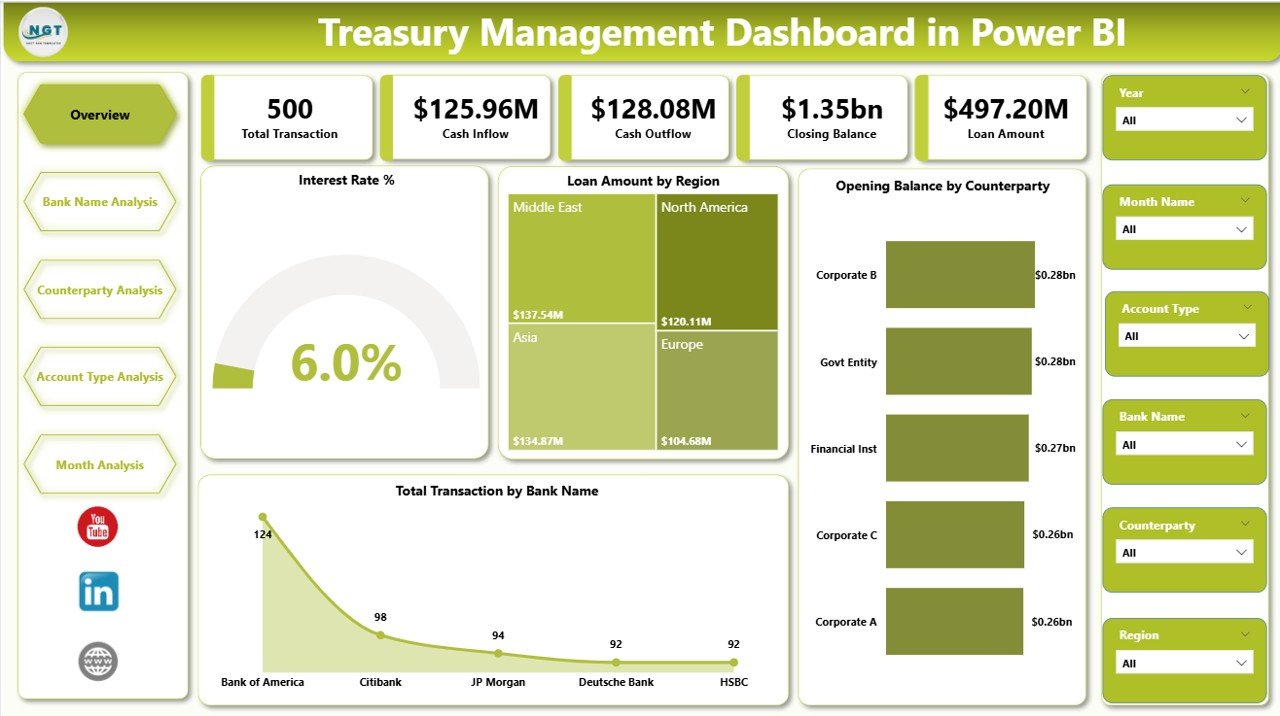
📊 Overview Page — Complete Financial Snapshot
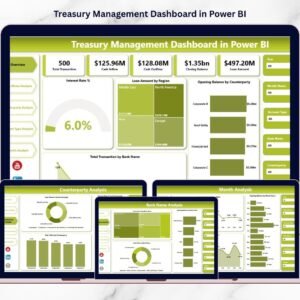
The headline page surfaces all five top-level KPIs: total loan exposure, cash inflow for the period, weighted average interest rate, total bank transactions, and opening balance by counterparty. KPI cards show current vs target with trend sparklines. Drill from any tile to the detailed analysis pages.
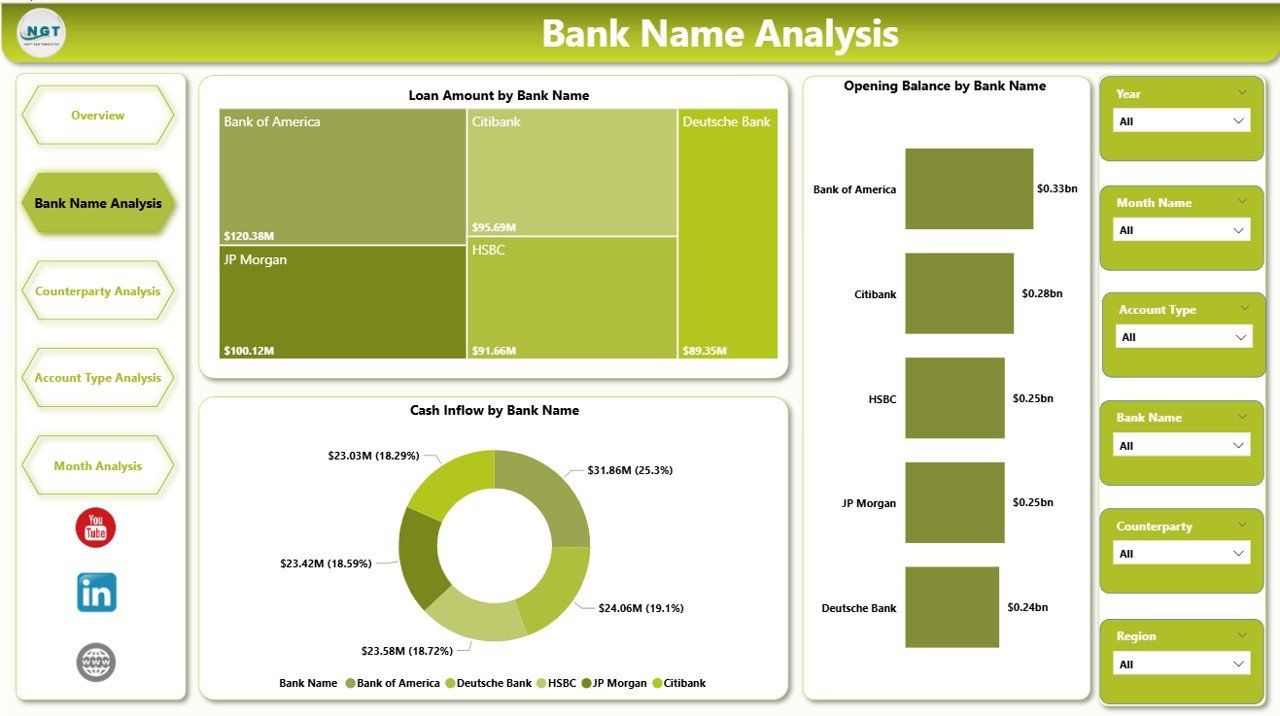
🏦 Bank Name Analysis
Break down exposure, transaction volume, and cash positioning by individual bank. Immediately see whether you’re over-concentrated with a single banking partner (a common policy violation) and track which banks carry the most activity versus the highest fees.
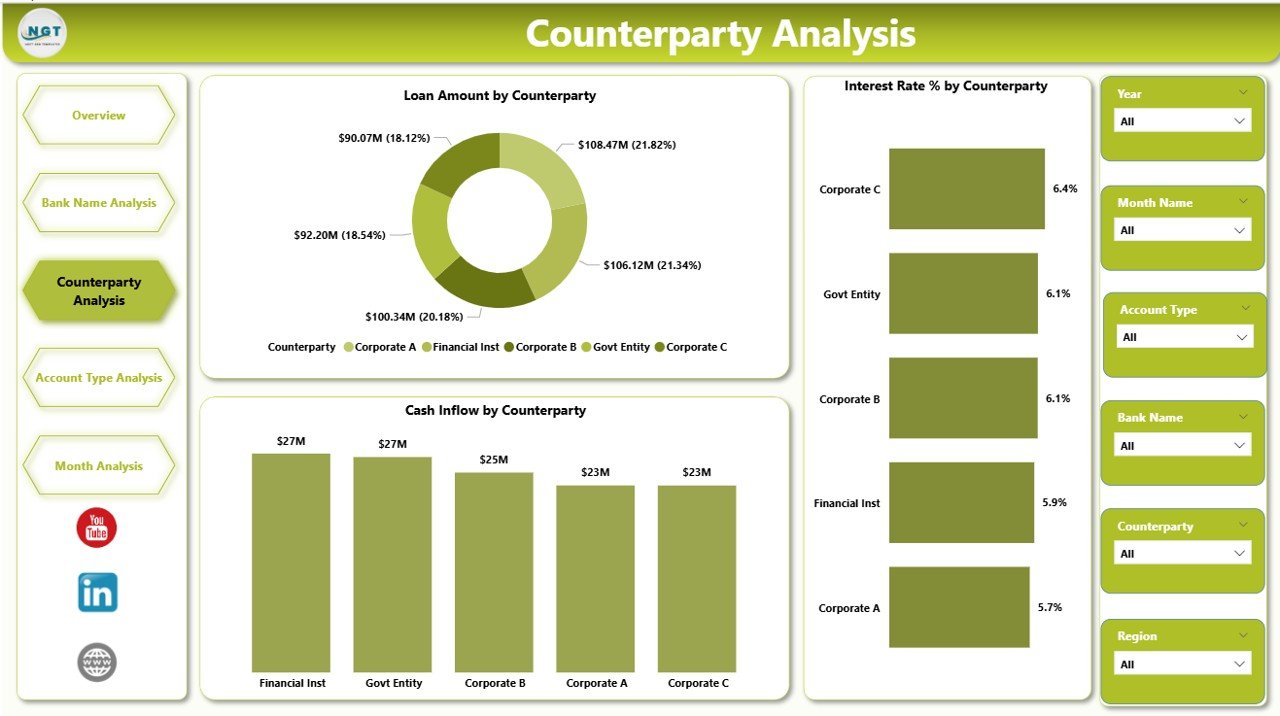
🤝 Counterparty Analysis
Monitor counterparty exposure concentration for credit risk policy compliance. Visualize top-10 counterparty exposure, region-level breakdown, and changes in counterparty mix over time. This is the single most-requested view in most audit and board-of-directors risk reports.
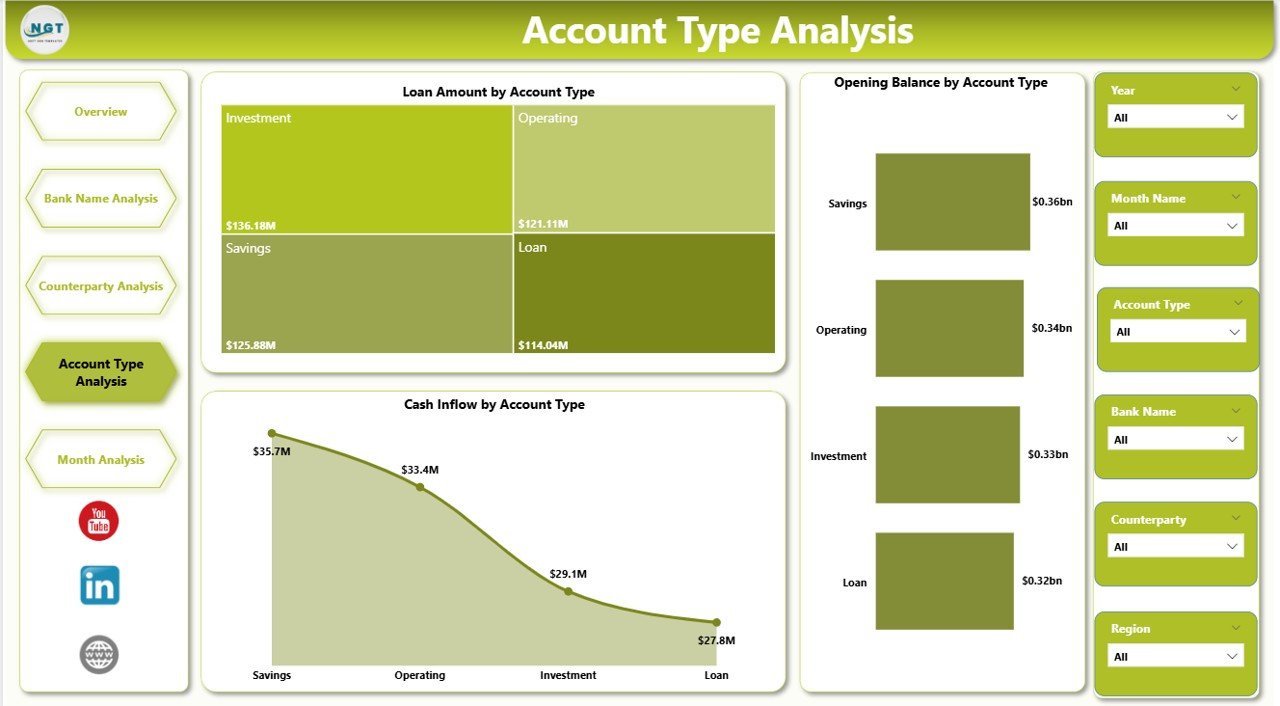
📂 Account Type Analysis
Understand your liquidity structure — operating accounts, money market, term deposits, intercompany loans, FX forwards. See where your cash sits, how long it’s locked up, and whether your liquidity ladder matches your operational needs.
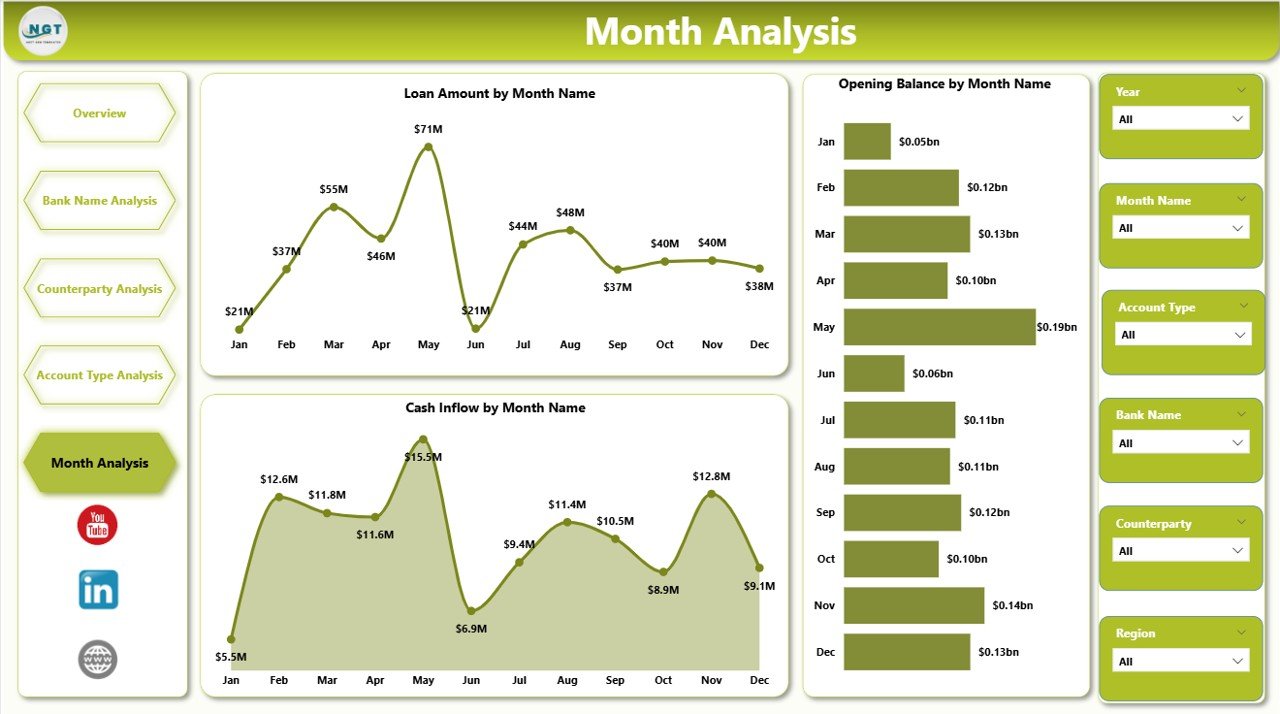
📅 Month-Over-Month Trend Analysis
Rolling 12-month trends for every KPI. Spot whether interest expense is creeping up, whether a specific bank’s share of transactions is growing, and whether inflows are following the forecast. This is where most mid-market treasurers discover silent problems.
🔄 Interactive Slicers & Filters
Every visual on every page is filtered by: Bank, Counterparty, Region, Account Type, and Month. Publish the report to your Power BI workspace and each team member sees exactly what they need.
🏦 Stop building the Treasury report in Excel every Monday morning.
Get a live bank exposure, cash position, loan, and interest rate dashboard in Power BI — with 5 pre-built pages, KPI cards, and slicers. Plug in your data and publish today.
Treasury Dashboard vs. Enterprise TMS vs. Excel
| Feature | Our Power BI Dashboard | Enterprise TMS (Kyriba / FIS / ION / GTreasury) | Spreadsheet-Based Treasury |
|---|---|---|---|
| Template Cost | One-time $17.99 | Annual contracts, commonly six figures | Free, but manual effort is the hidden cost |
| Implementation Time | Same day (plug in data, publish) | 6-24 months typical | Weekly rebuild from scratch |
| Bank Connectivity | Via Power Query (SWIFT, BAI2, MT940 imports) | Native, 1,000-10,000 bank connections pre-built | Manual download and paste |
| Payment Processing | ❌ Reporting only | ✅ Native payment hub with STP | ❌ Via online banking portals |
| Cash Forecasting | Trend-based with DAX measures | AI-driven with scenario modeling | Manual waterfall models |
| Counterparty Risk | Exposure concentration + limit tracking | Real-time with credit rating feeds | Manual lookup, often stale |
| FX & Hedge Accounting | Basic FX exposure view | Full IFRS 9 / ASC 815 compliance | ❌ Not automated |
| Best For | Mid-market corporates ($100M-$5B revenue), 5-50 bank accounts | Multinationals with 50+ bank accounts, hedge programs, SWIFT | Companies still building the Treasury function |
Honest positioning — if your company processes FX hedges under IFRS 9, runs an in-house bank, connects directly to SWIFT, or needs an auditable end-to-end payment hub, an enterprise TMS is the right answer. If your Treasury team spends Monday morning consolidating bank statements in Excel, pasting into pivot tables, and emailing a PDF to the CFO, this dashboard is the 10× productivity upgrade — without the 12-month procurement cycle.
Who Uses This Dashboard
| Role / Function | Primary Use Case |
|---|---|
| Corporate Treasurers | Daily cash position, weekly loan review, monthly bank fee reconciliation |
| CFOs & VP Finance | Board-ready liquidity snapshot, counterparty risk summary, covenant compliance view |
| Treasury Analysts | Month-end close, bank reconciliation analytics, interest variance analysis |
| Risk & Compliance Managers | Counterparty concentration monitoring, bank exposure limits, policy compliance |
| Financial Controllers | Cash vs book reconciliation, interest expense variance, bank fee analysis |
| FP&A Teams | Liquidity scenarios for budget reviews, cost-of-capital analysis, funding mix |
| Banking Relationship Managers | Share-of-wallet analysis, bank performance review, RFP data preparation |
| Private Equity Portfolio Finance Teams | Standardized treasury reporting across portfolio companies |
Benefits You’ll See in the First 30 Days
- 💰 Single cash position view — all bank accounts, all currencies, one dashboard
- 🏦 Bank concentration visibility — spot over-dependence on a single banking partner before the next review
- ⚠️ Counterparty exposure monitoring — proactive credit risk tracking against policy limits
- 📈 Interest rate trend visibility — catch creeping rate increases that silently erode margin
- 📊 Executive-ready layout — share the Power BI report as-is in CFO and board meetings
- 🔄 Scheduled refresh — up to 8 refreshes per day on Power BI Pro, 48 on PPU
- ⏱️ Monday-morning time savings — typical mid-market treasurer recovers 4-6 hours per week
How to Use the Dashboard (Step-by-Step)
- Download and open the .pbix file in Power BI Desktop (free download from Microsoft).
- Review the sample dataset — Bank Name, Counterparty, Account Type, Region, Loan Amount, Cash Inflow, Opening Balance, Interest Rate %, Month.
- Connect your Treasury data — replace the sample data table with your actual bank statement exports, loan register, and ERP feeds via Power Query.
- Verify the DAX measures calculate correctly against your data (total exposure, weighted-avg rate, counterparty concentration).
- Customize colors and branding to match your corporate theme — edit the theme JSON or use the Format pane.
- Publish to Power BI Service and share with your Treasury team, CFO, and risk committee via a corporate workspace.
- Set up scheduled refresh (up to 8 times/day on Pro, 48 times/day on PPU) — most Treasury teams refresh daily at 6am.
- Set up row-level security so each entity owner sees only their bank accounts and subsidiaries.
- Review weekly with Treasury + monthly with CFO — treat the dashboard as the single source of truth for cash and exposure.
Optional Upgrades You Can Add Later
- Bank statement automation — use Power Automate to parse BAI2 or MT940 files as they arrive via SFTP.
- Cash flow forecasting page — add a 13-week rolling forecast with AR, AP, and payroll projections.
- FX exposure page — track multi-currency balances and hedging coverage ratios.
- Covenant compliance tracking — add leverage ratio, interest coverage, and DSCR calculations for lender reporting.
- Power Automate alerts — email CFO when cash position drops below minimum threshold or bank exposure exceeds policy limit.
- Intercompany loan ledger — dedicated page for multi-entity groups with intercompany balance tracking.
Best Practices From High-Performing Treasury Teams
- Standardize account type definitions. “Operating” vs “Concentration” vs “ZBA” means different things at different banks — lock the taxonomy in the dashboard’s dimension table so comparisons are apples-to-apples.
- Track weighted-average interest rate, not simple average. A single $10M loan at 8% can look like an average rate crisis if you don’t weight by principal balance.
- Set counterparty exposure limits in writing — and enforce them in the dashboard. A red KPI card is far more effective than an email from Risk the day after a limit is breached.
- Reconcile monthly to the GL. Treasury dashboards drift from accounting reality within 90 days if not reconciled to the general ledger. Build a variance column into the month-end close cycle.
- Keep the historical snapshot. Month-end cash position should be archived as a static file, not just the rolling view — auditors always ask.
Related Templates You May Need
- Finance Summary Dashboard in Power BI — broader financial KPI view alongside Treasury
- Corporate Governance Dashboard in Power BI — governance, risk, and compliance companion
- Manufacturing Efficiency Dashboard in Power BI — for manufacturing CFOs
- Procurement Dashboard in Power BI — supplier spend view
- Sales Dashboard in Power BI — top-line revenue view
- All Power BI Dashboards — full catalog
- All Excel & Power BI Dashboards
Frequently Asked Questions
Can this replace Kyriba, FIS, ION, or GTreasury?
For mid-market corporates with 5-50 bank accounts, simple FX needs, and no in-house bank, yes — this dashboard covers the core visibility layer that those platforms charge hundreds of thousands of dollars annually for. It does not include: payment processing and STP, SWIFT messaging, hedge accounting under IFRS 9 or ASC 815, automated bank reconciliation at transaction level, or 10,000-bank direct connectivity. If you need any of those, an enterprise TMS is the right answer — but your Treasury team shouldn’t wait 12 months for basic visibility while procurement runs.
Do I need a Power BI license to use this dashboard?
Power BI Desktop (free) lets you open, edit, and view the .pbix file locally. To publish and share with your CFO or Treasury committee, you need Power BI Pro ($14/user/month post-April 2025 price increase) or Microsoft 365 E5, which includes Pro at no additional cost. For enterprise deployment with unlimited viewers, Fabric F64 capacity (~$5,000/month) becomes cheaper than per-user Pro licensing above 400 viewers.
What data sources can it connect to?
Power BI’s Power Query supports bank statement formats including BAI2, MT940, ISO 20022 camt.053, CSV, XML, and JSON, as well as direct connectors to SAP, Oracle, NetSuite, Microsoft Dynamics 365, SQL Server, Snowflake, and 200+ other sources. Most Treasury teams load bank statements via SFTP + CSV ingestion, and loan/counterparty data from the ERP.
How is this different from building my own Power BI dashboard?
The data model, DAX measures, page layout, and five analytical views represent roughly 60-100 hours of development work for a Power BI developer with Treasury domain expertise — and Treasury-fluent Power BI developers bill $200-$350/hour. At $17.99, this template saves 1-2 months of internal build time and delivers a reviewed data model that aligns with standard Treasury reporting practice.
Does it support multi-currency Treasury operations?
The template ships with single-currency sample data, but the data model is currency-agnostic. You can add a currency dimension table, apply daily or month-end FX rates in DAX measures, and produce consolidated reporting in your functional currency. This is a common first customization — plan on 2-4 hours of work for a Power BI developer familiar with FX translation.
Can I use this for a portfolio of companies (PE / holding company)?
Yes — PE portfolio finance teams and holding-company Treasury functions are a common use case. Add an “Entity” dimension to the data model, set up row-level security so each portfolio company sees only its own data, and give the group treasurer full cross-portfolio access. This is exactly how multi-entity consolidations are structured in enterprise TMS platforms — the Power BI version just costs less.
Is the data model auditable?
Yes — Power BI’s data lineage view shows exactly how every measure is calculated from source data. For SOX-audited environments, publish the report to a Power BI Premium workspace with full audit logging and deployment pipelines. For smaller Treasury teams, the data model is transparent enough that auditors can trace any KPI to its source in 10 minutes.
Can it handle intercompany loans and in-house banking?
Partially — the template includes counterparty-level tracking, which handles intercompany loan exposure for groups up to ~20 entities. Full in-house banking with ZBA structures, intercompany netting, and automated settlement is a feature of enterprise TMS platforms (Kyriba and GTreasury specifically) and is out of scope for this dashboard.
What about regulatory reporting (FBAR, FINRA, etc.)?
This dashboard supports the data collection side of regulatory reporting — bank accounts, signatories, balances, and transaction volumes are all trackable. The actual filing of regulatory reports (FBAR schedules, FINRA submissions, country-specific central bank reporting) requires either an enterprise TMS with built-in reporting modules or a separate compliance tool. The dashboard is a complement, not a replacement.
How do I keep the dashboard current?
Set up scheduled refresh in Power BI Service (up to 8/day on Pro, 48/day on PPU). Most Treasury teams refresh at 6am so the dashboard reflects the previous day’s bank close by the time the team logs in. For real-time positions during the trading day, integrate with Azure Data Factory + direct SWIFT messaging — but for most mid-market treasuries, once-daily refresh is all the accuracy that’s actually needed.
Read the Full Blog Post on PK: An Excel Expert
For a detailed walkthrough of each dashboard page, DAX measure explanations, and bank statement integration guidance, read the full guide on our finance blog: Treasury Management Dashboard in Power BI — Full Guide.
Watch the Walkthrough Video
See the dashboard in action — overview page, bank and counterparty drill-through, interest rate monitoring, and month-over-month trend analysis:
🎥 Subscribe to YouTube.com/@PKAnExcelExpert for weekly Excel and Power BI dashboard walkthroughs for Finance, Treasury, FP&A, and Operations teams.
Ready to stop rebuilding the Treasury report every week?
Download the Treasury Management Dashboard in Power BI — one-time $17.99, .pbix with 5 pre-built pages, works with your existing Power BI Pro licenses.