Corporate governance builds trust, protects stakeholders, and strengthens long-term sustainability. However, when governance data remains scattered across Excel files and emails, leadership loses visibility. ESG trends become unclear. Compliance gaps go unnoticed. Risk exposure increases silently.
That is why we created the Corporate Governance Dashboard in Power BI — a structured, ready-to-use reporting solution that centralizes governance, compliance, ESG, and risk data into one interactive Power BI file.
This powerful dashboard transforms raw governance records into dynamic visual insights. As a result, executives, compliance teams, and board members gain transparency, control, and confidence in every governance decision.
If you want real-time governance visibility with professional reporting, this dashboard delivers exactly that.
🚀 Key Feature of Corporate Governance Dashboard in Power BI
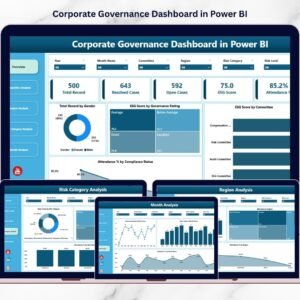
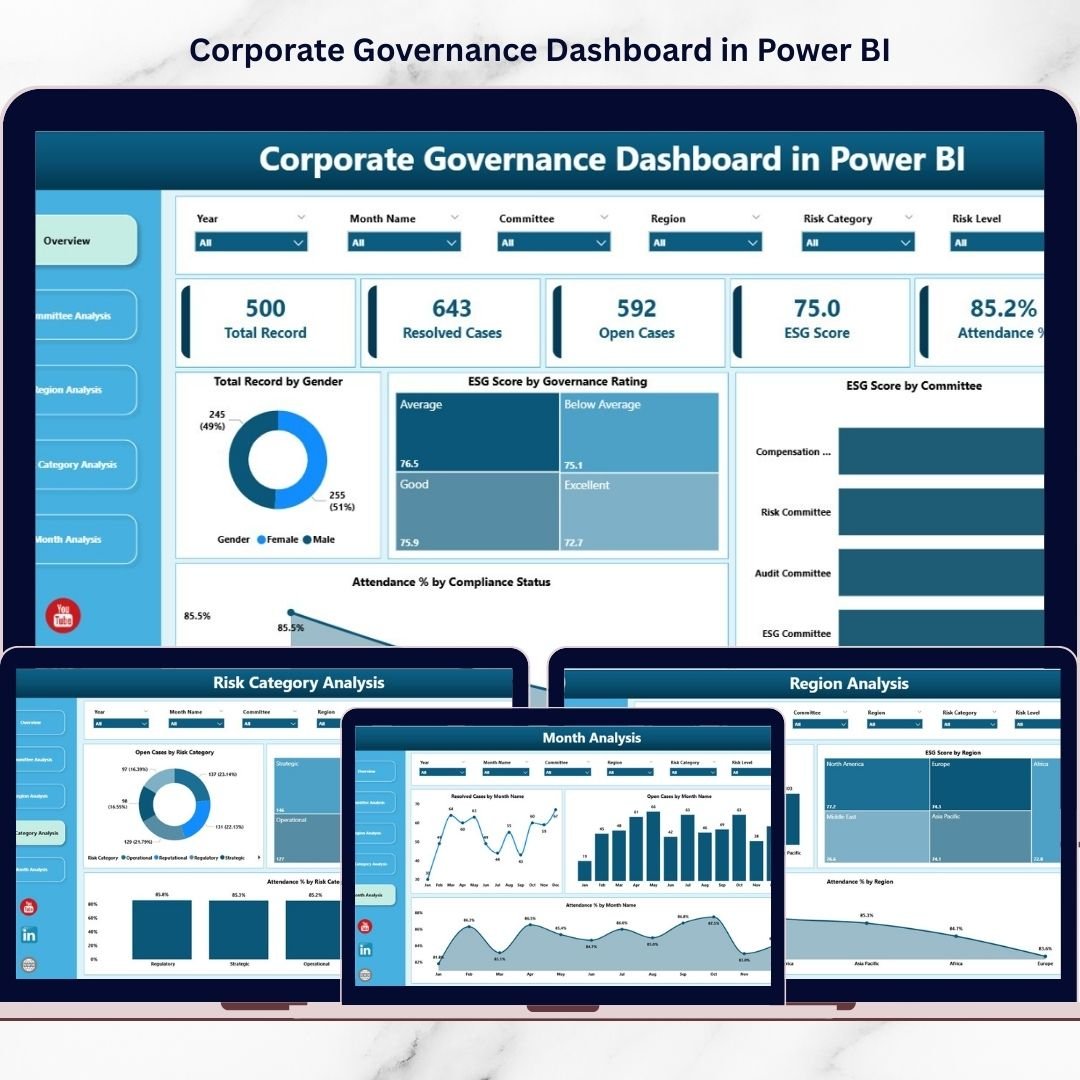
This dashboard includes 5 structured analytical pages, each designed to monitor a specific governance dimension.
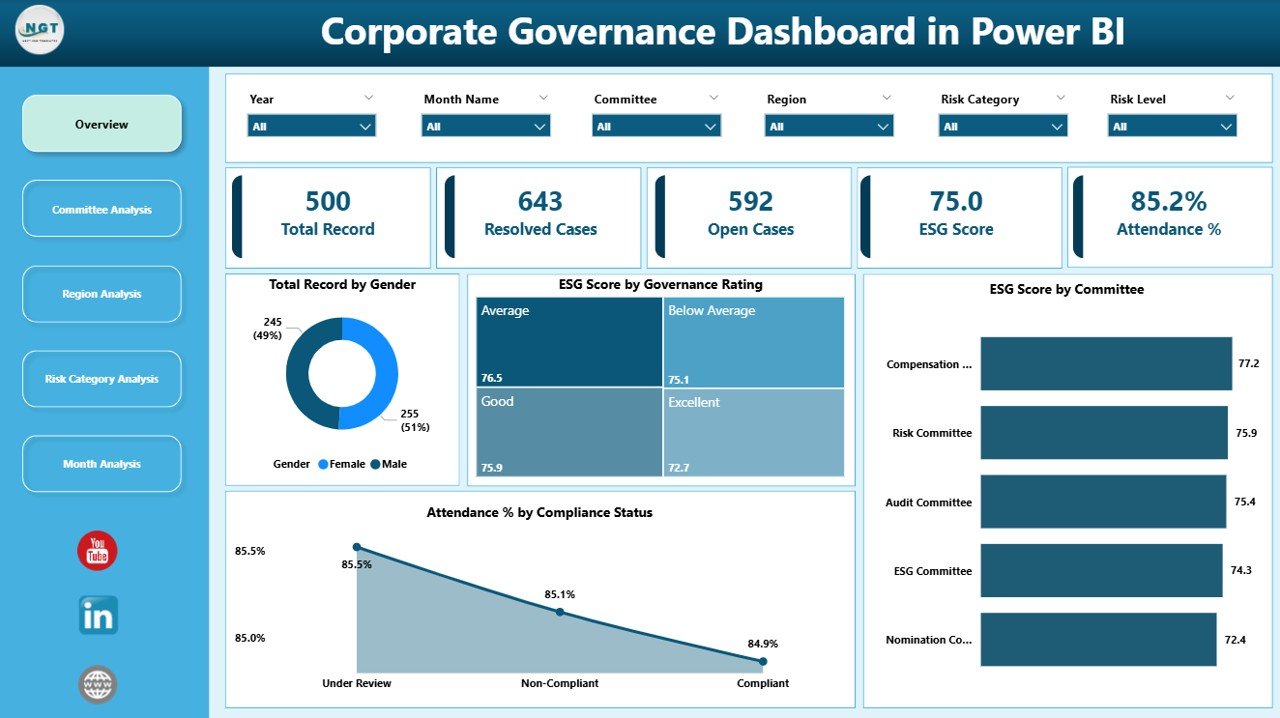
📊 Overview Page – ESG, attendance, compliance & governance snapshot
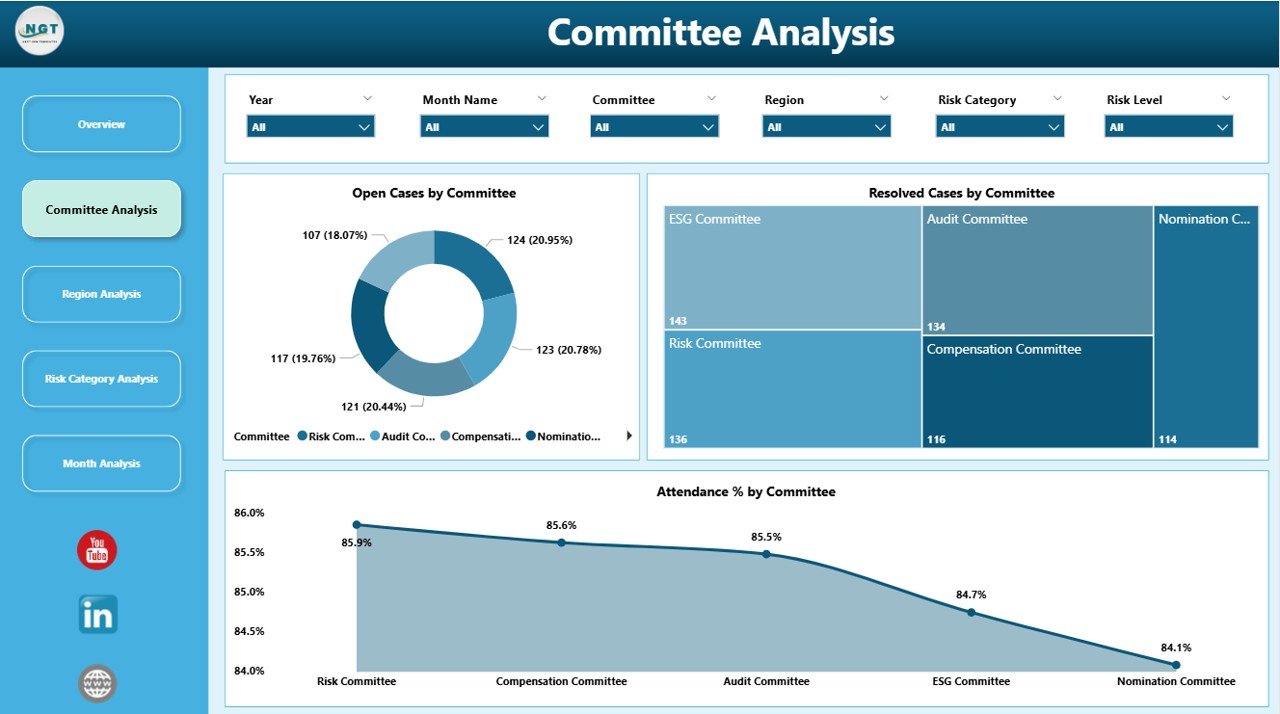
👥 Committee Analysis – Track open/resolved cases & committee performance
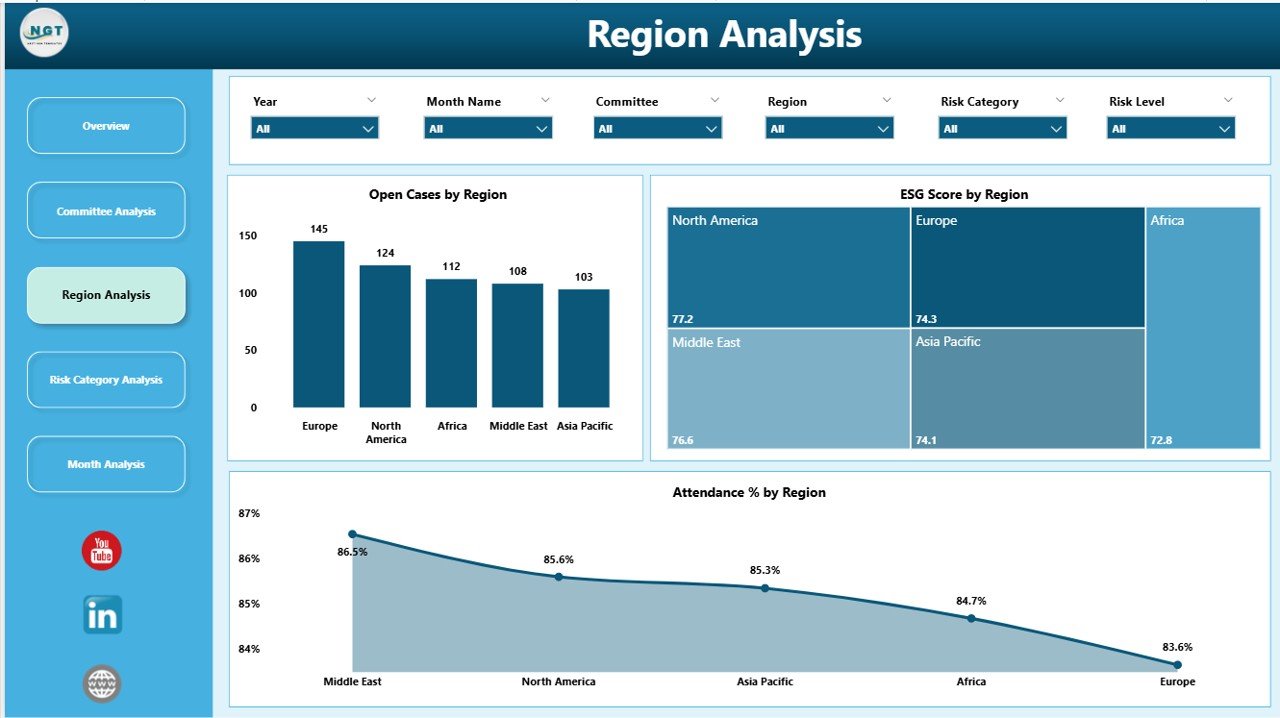
🌍 Region Analysis – Compare governance performance across regions
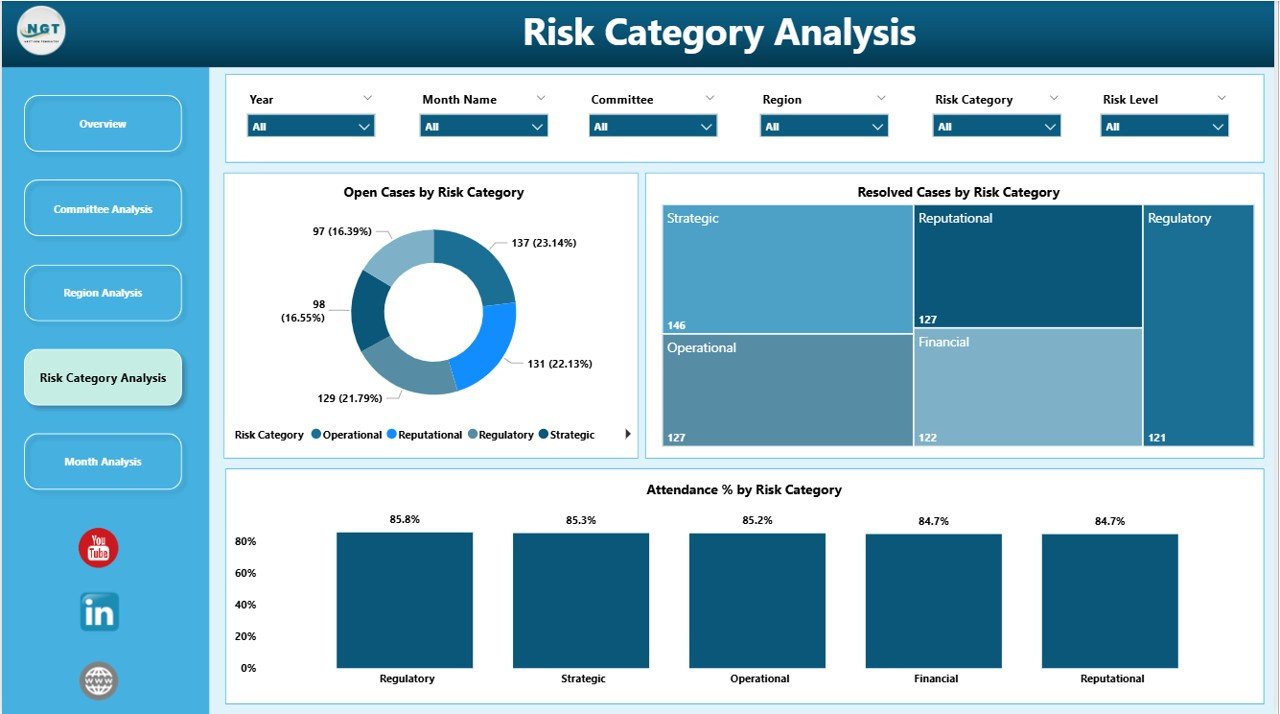
⚠️ Risk Category Analysis – Identify high-risk compliance areas
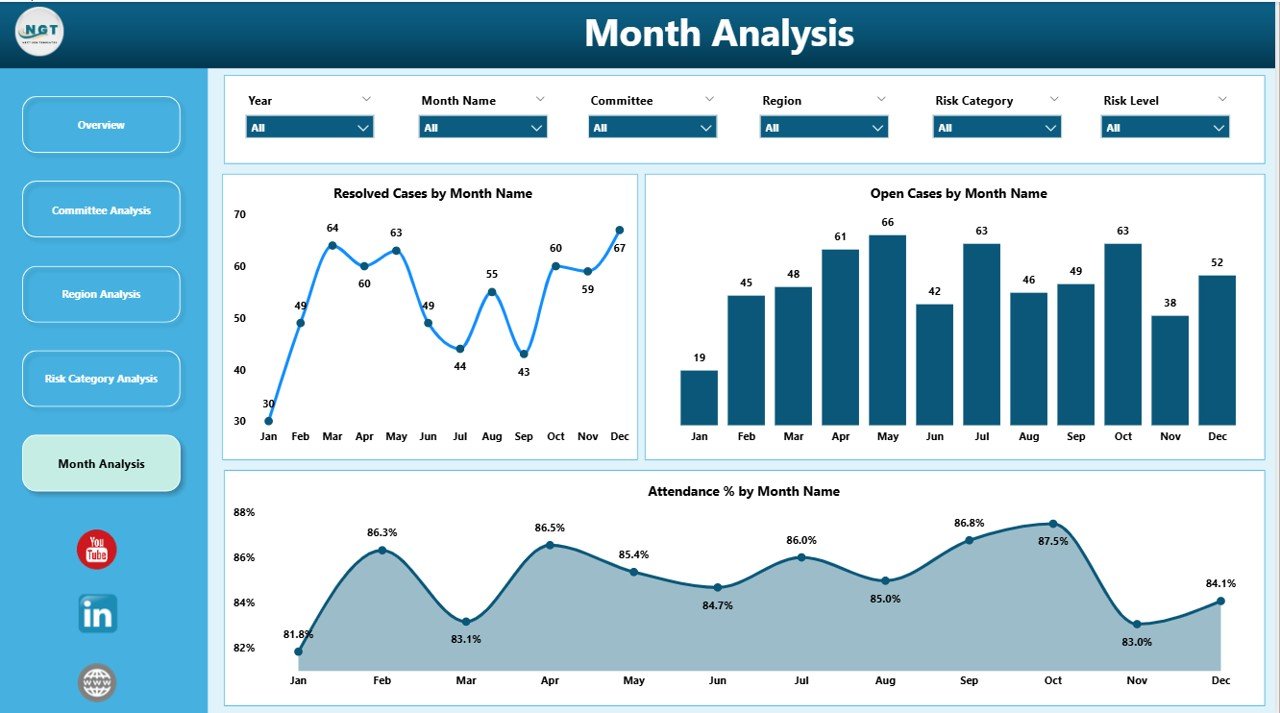
📅 Month Analysis – Monitor case trends and attendance over time
✨ Additional Highlights:
-
Interactive slicers for dynamic filtering
-
KPI Cards for instant executive summary
-
Drill-down capability for detailed insights
-
Clean and professional Power BI layout
-
Real-time data refresh capability
-
Fully customizable governance framework
Because everything is built in Power BI, reporting becomes automated, interactive, and presentation-ready.
📦 What’s Inside the Corporate Governance Dashboard in Power BI
This ready-to-use Power BI file includes:
✔ 5 Analytical Pages
✔ 5 KPI Cards on Overview Page
✔ ESG Score Monitoring by Governance Rating
✔ ESG Score by Committee
✔ Open & Resolved Cases Tracking
✔ Attendance % Monitoring
✔ Risk Category Analysis
✔ Gender Diversity Insights
✔ Region-Wise Governance Performance
✔ Monthly Case & Attendance Trends
✔ Interactive Slicers (Committee, Region, Risk, Month)
✔ Structured Data Model for Governance Reporting
You simply connect your governance dataset, refresh the dashboard, and start analyzing performance instantly.
🛠 How to Use the Corporate Governance Dashboard in Power BI
Implementation is simple and structured:
1️⃣ Prepare structured governance data (Committee, Region, Risk Category, ESG Score, Case Status, Attendance %, Month, Gender, Governance Rating).
2️⃣ Import data into Power BI.
3️⃣ Refresh the dashboard.
4️⃣ Use slicers to filter by committee, region, or risk category.
5️⃣ Review Overview page first for summary insights.
6️⃣ Drill into Committee, Region, Risk, and Month pages for deeper analysis.
For example:
-
If open cases increase in one region, you can assign corrective action immediately.
-
If ESG score declines in a committee, leadership can review governance policies.
-
If attendance % drops, board oversight improves quickly.
Because visuals update instantly, governance decisions become proactive instead of reactive.
👥 Who Should Use the Corporate Governance Dashboard in Power BI
This dashboard is ideal for:
🏛 Board Members
📋 Compliance Officers
⚖ Risk Managers
🌱 ESG Analysts
📊 Internal Audit Teams
👔 Executive Leadership
It supports both large enterprises and mid-sized organizations seeking structured governance reporting.
It improves:
✔ Governance transparency
✔ Compliance monitoring
✔ ESG tracking
✔ Risk visibility
✔ Committee accountability
When governance becomes measurable, trust becomes stronger.
💡 How This Dashboard Strengthens Governance Strategy
Strong governance requires visibility and accountability.
This dashboard helps you:
-
Identify high-risk compliance categories
-
Monitor ESG score trends
-
Track case resolution efficiency
-
Compare regional governance performance
-
Improve board-level reporting
-
Detect governance gaps early
Instead of relying on manual reporting, you lead with data-driven governance intelligence.
Click here to read the Detailed blog post
Visit our YouTube channel to learn step-by-step video tutorials