
The dairy industry runs on precision. A small drop in yield, a slight increase in downtime, or uncontrolled utility usage can directly impact profitability. However, when data is scattered across departments, decision-making becomes slow and reactive.
You need more than reports.
You need real-time intelligence.
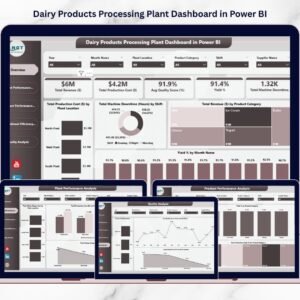
The Dairy Products Processing Plant Dashboard in Power BI is a powerful, interactive business intelligence solution designed to give dairy manufacturers complete control over production, cost, quality, yield, downtime, and resource usage — all in one dynamic platform.
With advanced visuals, drill-down capability, and smart slicers, this dashboard transforms raw plant data into clear, actionable insights.
This is not just a report.
It is your plant’s real-time performance command center.
🚀 Key Feature of Dairy Products Processing Plant Dashboard in Power BI
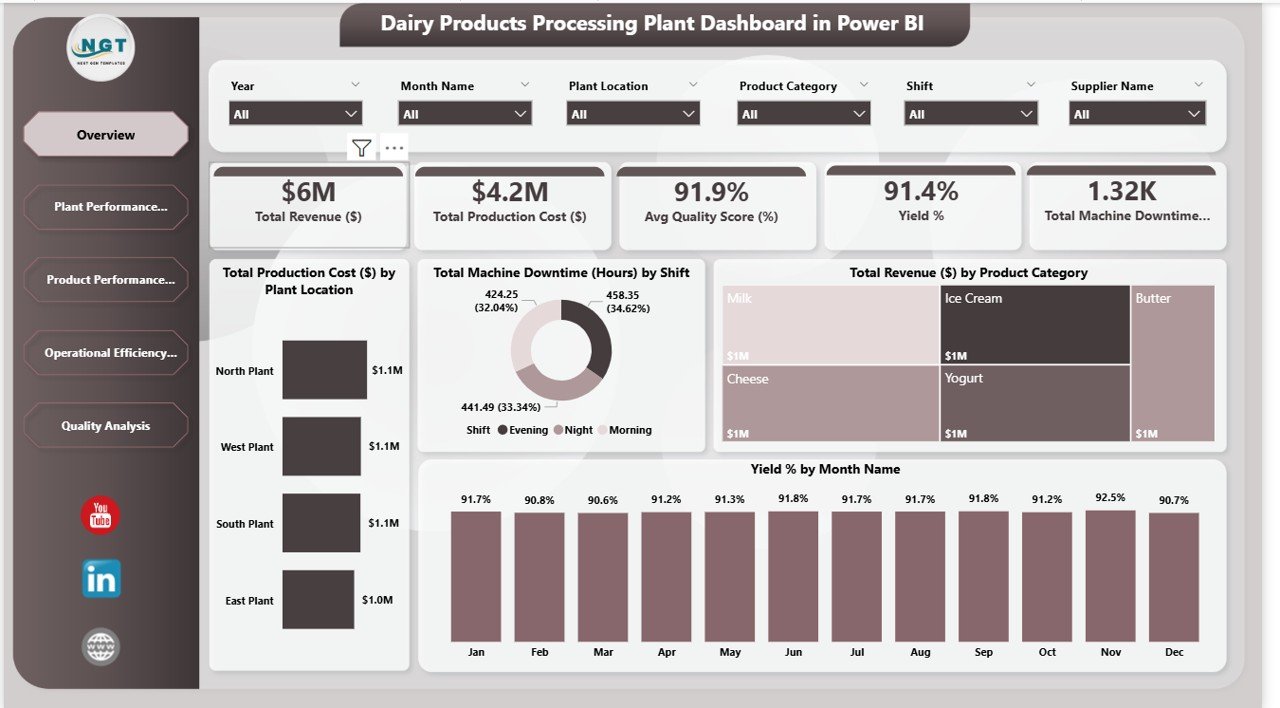
📊 Executive Overview with KPI Cards
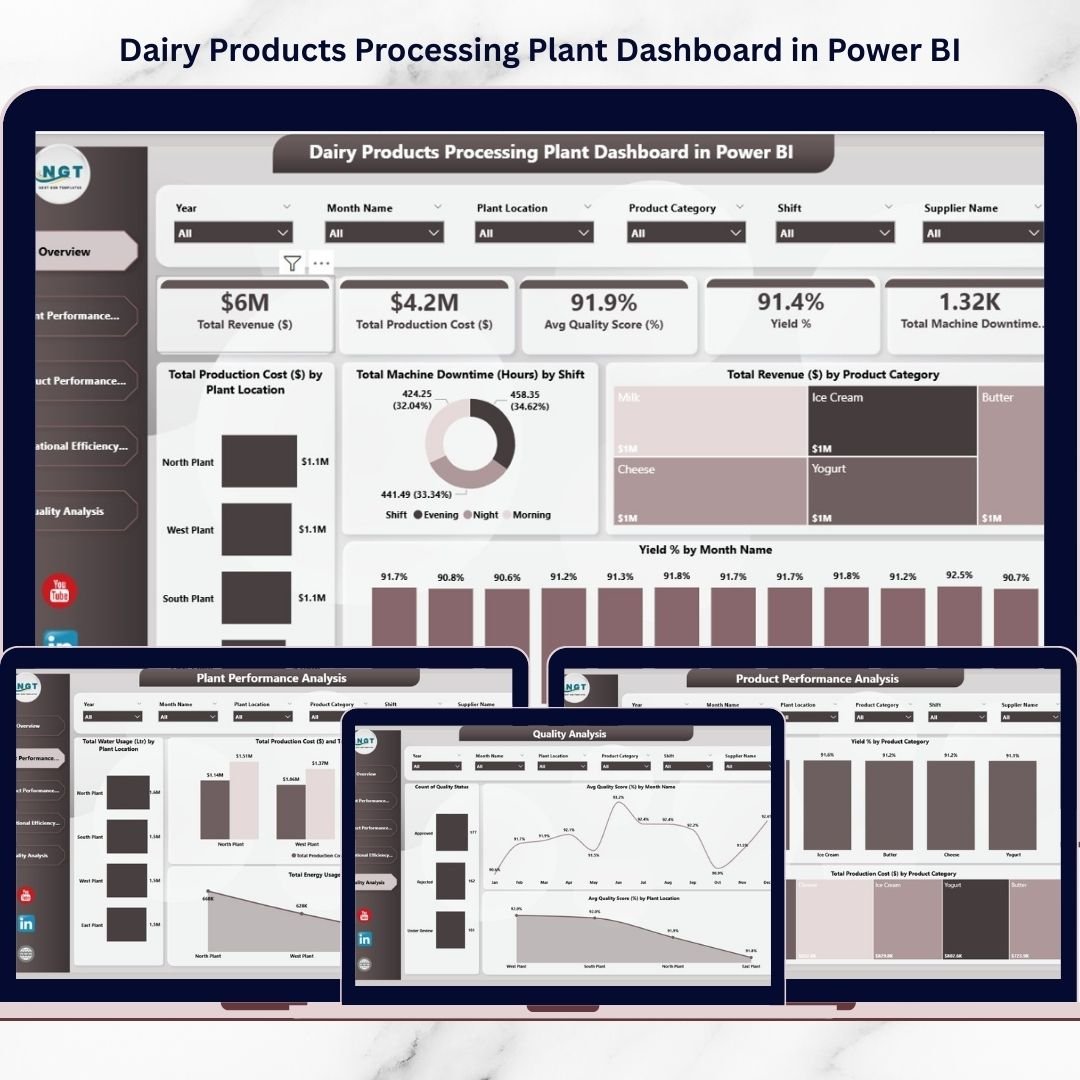
Instantly monitor Revenue, Production Cost, Quality Score, Yield %, and Machine Downtime.
🎯 Interactive Slicers & Drill-Down Filters
Filter by Year, Month, Plant Location, Product Category, Shift, and Supplier.
🏭 Multi-Plant Performance Comparison
Compare revenue, cost, water usage, and energy consumption across locations.
🧀 Product-Level Profitability Insights
Analyze output quantity, yield %, and cost by product category.
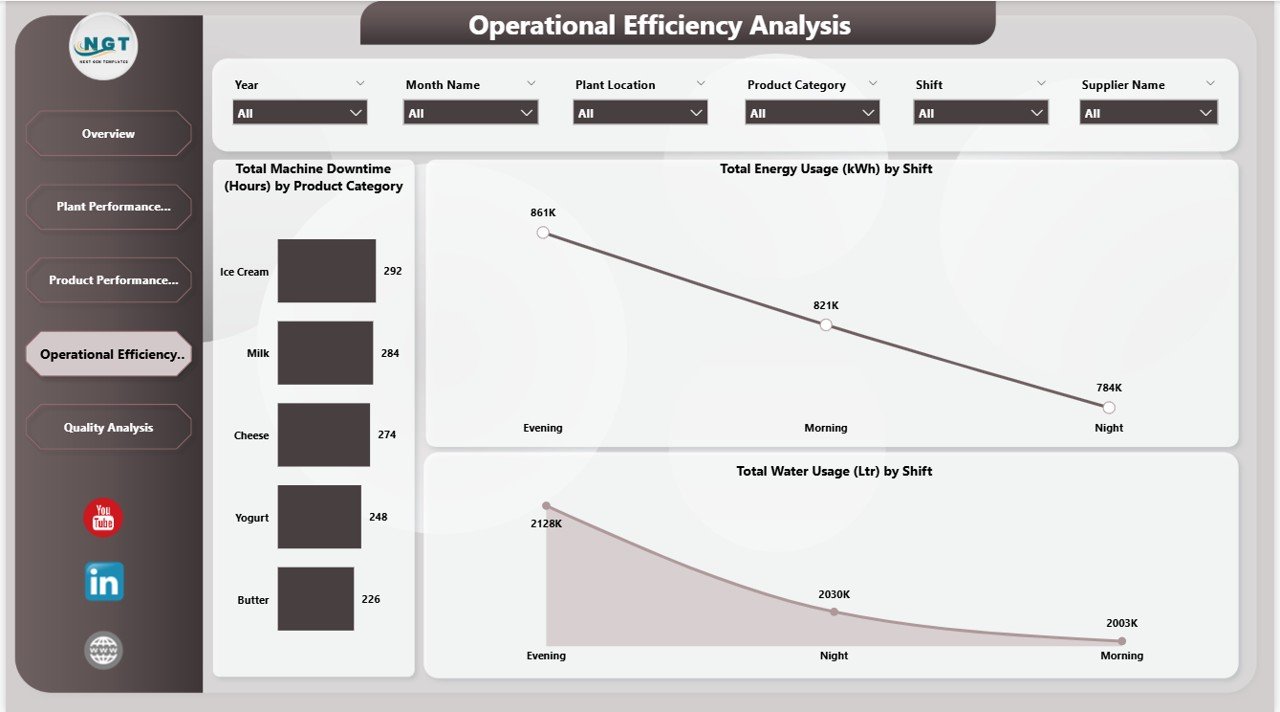
⚙️ Operational Efficiency Monitoring
Track downtime, energy usage, and water consumption by shift.
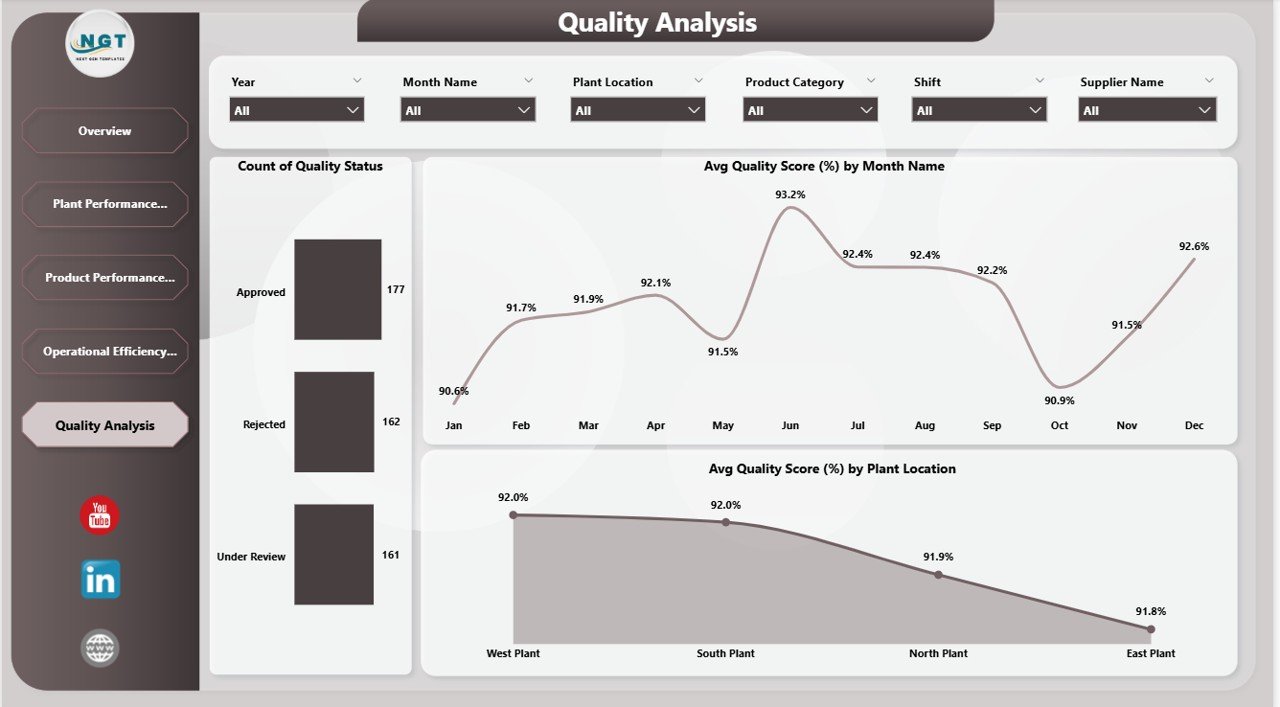
🛡 Quality Performance Tracking
Monitor approval rate, rejection count, and monthly quality trends.
⚡ Dynamic Power BI Visuals
Get interactive charts, comparisons, and instant performance breakdowns.
📦 What’s Inside the Dairy Products Processing Plant Dashboard in Power BI
This advanced Power BI solution includes 5 structured analytical pages:
📊 Overview Page
The executive summary dashboard displaying:
Total Revenue
Total Production Cost
Average Quality Score
Yield Percentage
Total Machine Downtime
Includes visuals such as Revenue by Product, Cost by Plant, Downtime by Shift, and Yield % by Month.
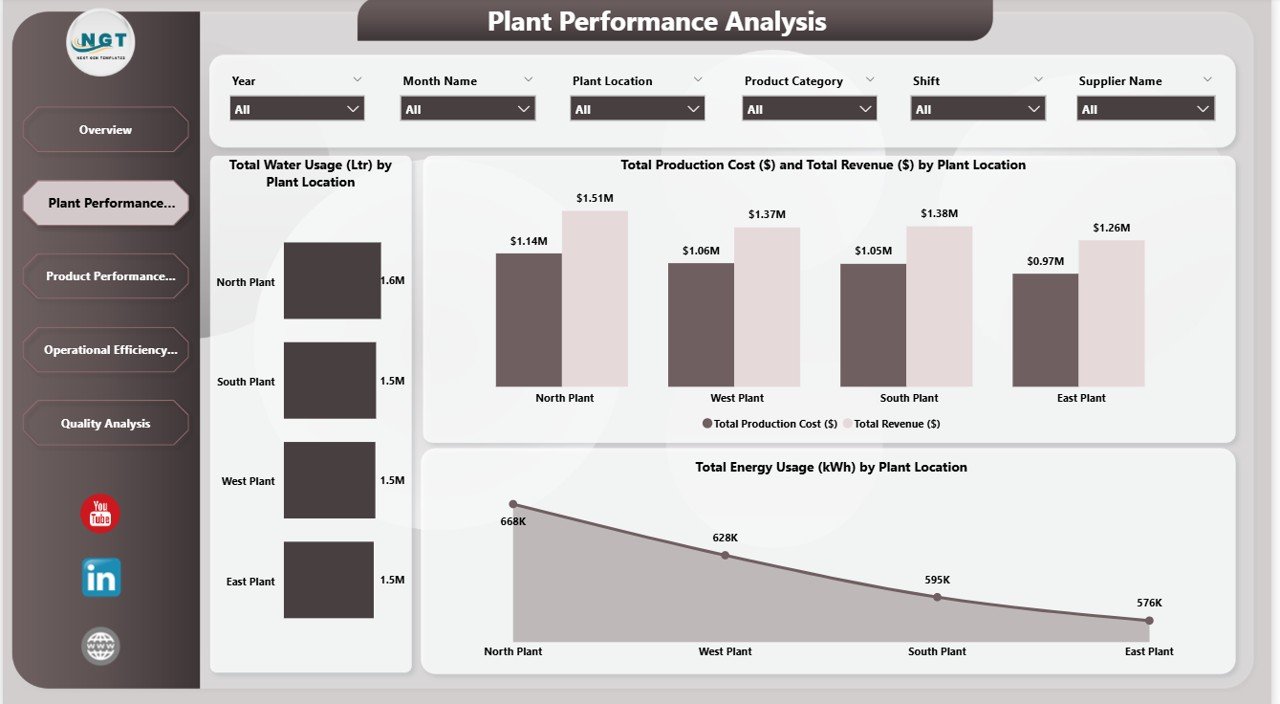
🏭 Plant Performance Analysis
Compare plant locations using:
Revenue vs Production Cost
Total Energy Usage (KWh)
Total Water Usage (Liters)
Identify which plant operates most efficiently.
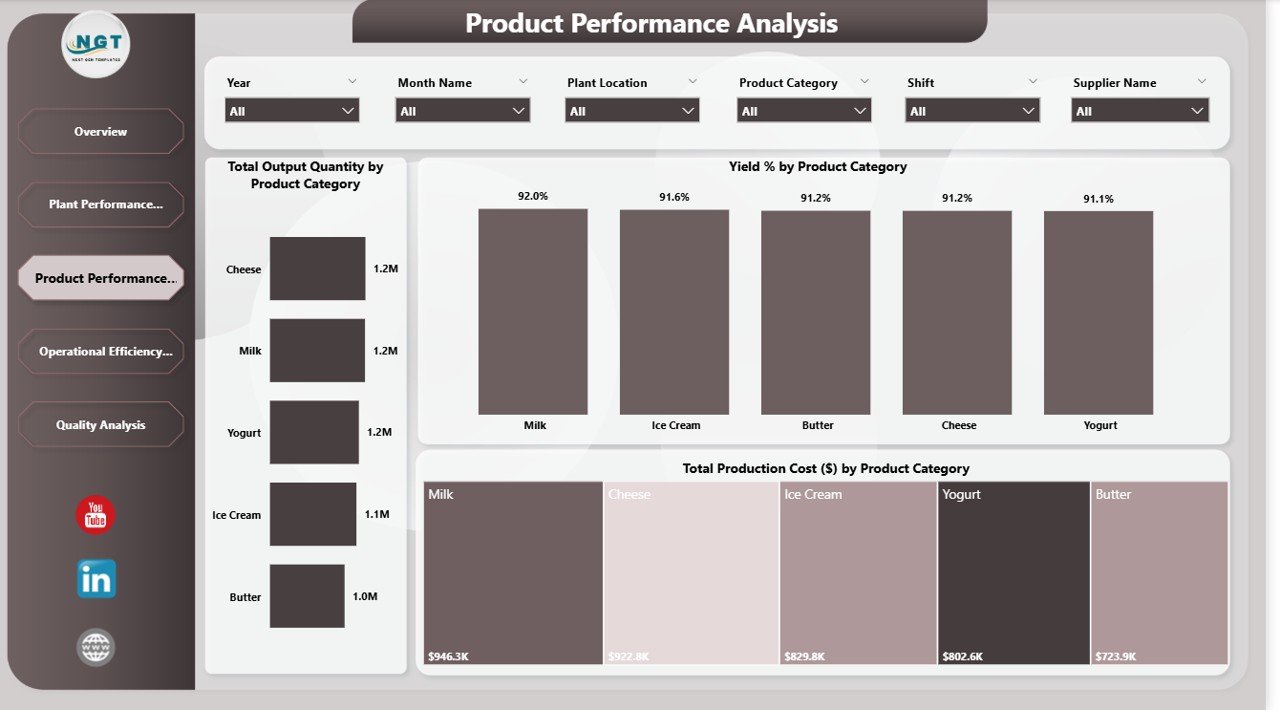
🧀 Product Performance Analysis
Evaluate:
Output Quantity by Product
Yield % by Product Category
Production Cost by Product
Pinpoint high-yield and high-cost products.
⚙️ Operational Efficiency Analysis
Track:
Machine Downtime by Product
Energy Usage by Shift
Water Usage by Shift
Optimize shifts and reduce operational losses.
🛡 Quality Analysis Page
Monitor:
Approved, Rejected, Under Review counts
Monthly Quality Score Trends
Quality Score by Plant
Ensure consistent product quality and compliance.
🛠 How to Use the Dairy Products Processing Plant Dashboard in Power BI
Using this dashboard is simple and strategic:
1️⃣ Connect your plant data to the Power BI file.
2️⃣ Refresh data to update visuals automatically.
3️⃣ Use slicers to filter by plant, shift, product, or supplier.
4️⃣ Analyze KPI cards on the Overview page.
5️⃣ Drill into plant, product, or operational insights.
6️⃣ Take data-driven corrective action immediately.
Because Power BI supports automatic refresh, you always see updated plant performance.
👥 Who Can Benefit from This Dairy Products Processing Plant Dashboard?
This dashboard is ideal for:
🏭 Dairy Plant Owners
📊 Operations Managers
💰 Finance Directors
⚙️ Maintenance Heads
🛡 Quality Control Managers
📦 Supply Chain Managers
Whether you manage a single processing unit or multiple plants, this dashboard delivers structured performance intelligence.
Data-driven plants outperform competitors.
With centralized analytics, interactive filtering, and real-time KPIs, you can reduce cost, optimize utilities, improve yield, and maintain quality standards consistently.
Stop reacting to problems.
Start preventing them with real-time insights.
Click here to read the Detailed blog post
Watch the step-by-step video tutorial:
Visit our YouTube channel to learn step-by-step video tutorials
Compatibility and Requirements
- Works in Power BI Desktop, which is free to download. Microsoft explains how to get it in Get Power BI Desktop.
- You connect your own plant data to the Power BI file, then refresh to update the visuals.
Frequently Asked Questions
Which pages are included?
Five pages: Overview, Plant Performance Analysis, Product Performance Analysis, Operational Efficiency Analysis and Quality Analysis.
Which KPIs are on the Overview page?
Total Revenue, Total Production Cost, Average Quality Score, Yield Percentage and Total Machine Downtime.
Can I compare several plants?
Yes. The Plant Performance Analysis page compares plant locations by revenue vs production cost, total energy usage (KWh) and total water usage (liters).
What can I filter by?
Slicers filter by year, month, plant location, product category, shift and supplier.
Is there an Excel version?
Yes. See the Dairy Products Processing Plant Dashboard in Excel.
Related Dairy and Production Templates
- Dairy Products Processing Plant Dashboard in Excel: the same plant dashboard in Excel
- Dairy Industry KPI Dashboard in Excel: KPI tracking for dairy operations
- Production Planning Dashboard in Power BI: production planning in Power BI
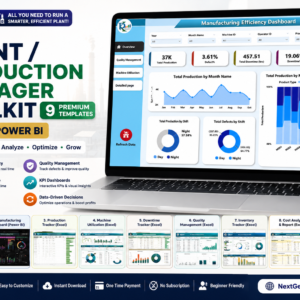
- Plant Production Manager Toolkit: 9 templates for plant managers in Excel and Power BI
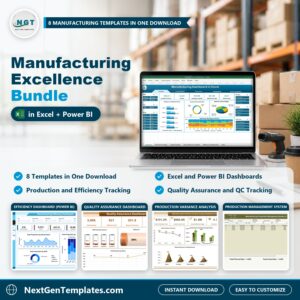
- Manufacturing Excellence Bundle: 8 manufacturing templates in Excel and Power BI
Browse all Power BI dashboards.