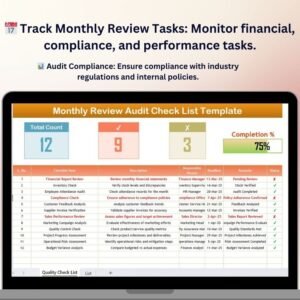
Technology teams move fast. Projects overlap. Deadlines stack up. Budgets tighten. And when performance data is scattered across multiple files, clarity disappears.
Missed deadlines. Budget overruns. Backlogs. Slow issue resolution.
What if you could monitor target hours, actual hours, budgets, and issue resolution — all in one interactive, real-time dashboard?
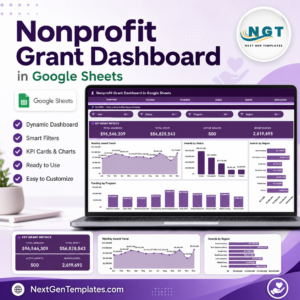
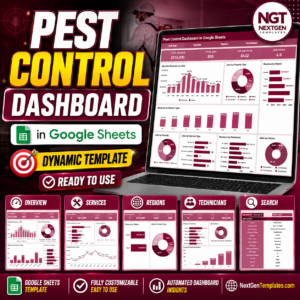
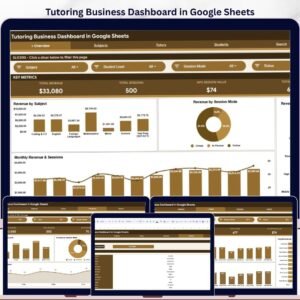
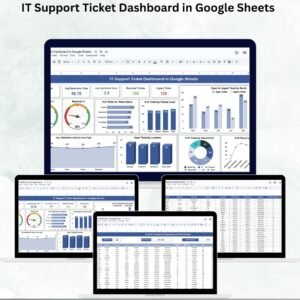
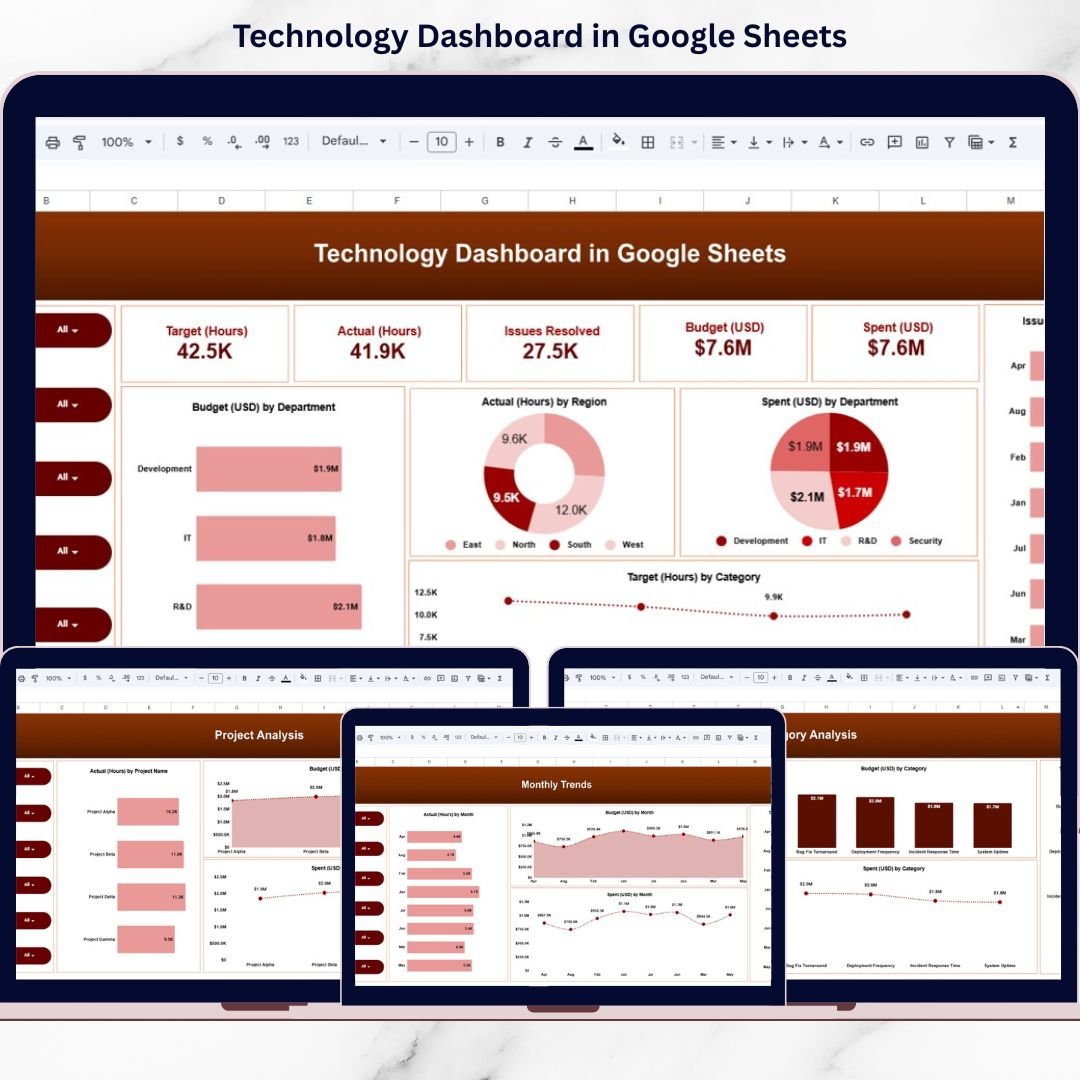
Introducing the Technology Dashboard in Google Sheets — a ready-to-use performance tracking solution designed for IT departments, software teams, and technology-driven organizations.
This powerful dashboard centralizes project performance, department efficiency, budget control, and monthly trends into one dynamic system. With interactive slicers and automated calculations, you can drill down by year, month, department, category, region, or project name instantly.
No complex setup. No messy reporting. Just clear, actionable insights.
If you want stronger productivity control and smarter budget management — this dashboard becomes your technology command center.
🚀 Key Features of Technology Dashboard in Google Sheets
📊 Interactive KPI Cards – Instantly view Target Hours, Actual Hours, Issues Resolved, Budget, and Amount Spent.
🎯 Target vs Actual Monitoring – Compare workload performance across departments and projects.
💰 Budget vs Spent Tracking – Identify overspending immediately with visual comparisons.
🌍 Region-Wise Workload Analysis – Monitor hours distribution across East, North, South, and West regions.
🧩 Category Performance Tracking – Analyze Bug Fix Turnaround, Deployment Frequency, Incident Response Time, and System Uptime.
📈 Project-Level Insights – Compare budget and effort across projects like Alpha, Beta, Gamma, and Delta.
📅 Monthly Trend Analysis – Track hours, budget, and spending patterns month by month.
🔎 Dynamic Filters & Slicers – Drill down by department, category, project, region, month, or year.
☁️ Cloud-Based Collaboration – Multi-user access via Google Sheets.
Everything updates automatically — giving leadership instant visibility.
📦 What’s Inside the Technology Dashboard in Google Sheets
This structured dashboard includes multiple analytical pages:
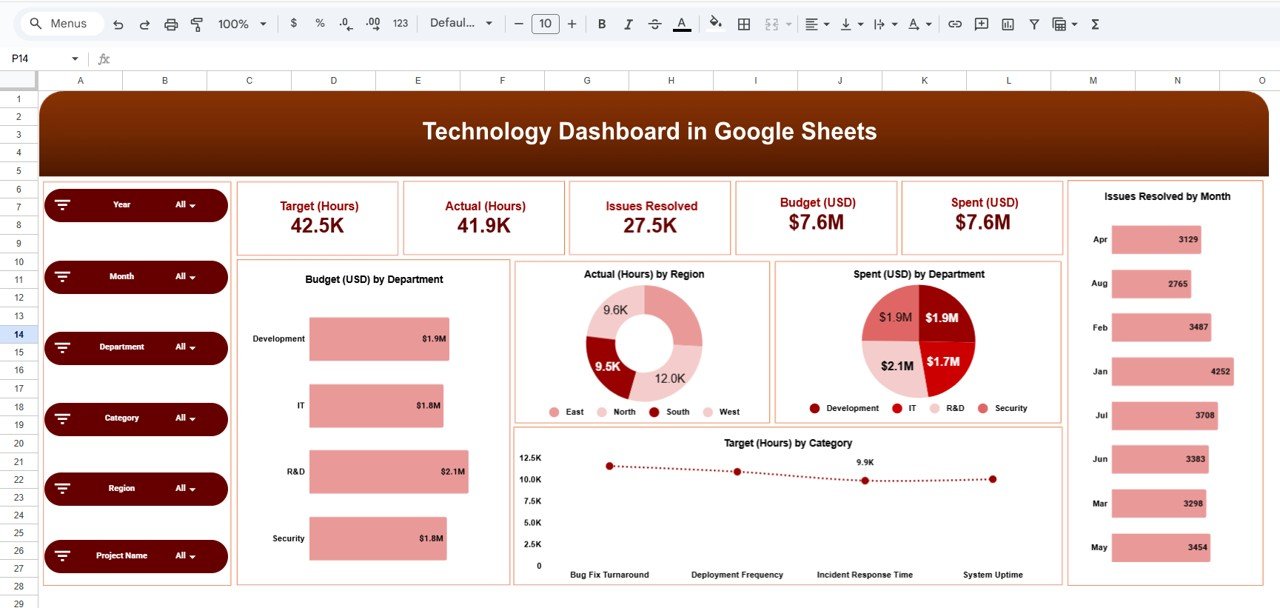
1️⃣ Overview Page
Your high-level performance snapshot showing:
-
Target Hours
-
Actual Hours
-
Issues Resolved
-
Budget (USD)
-
Amount Spent (USD)
-
Budget by Department
-
Actual Hours by Region
-
Target Hours by Category
-
Issues Resolved by Month
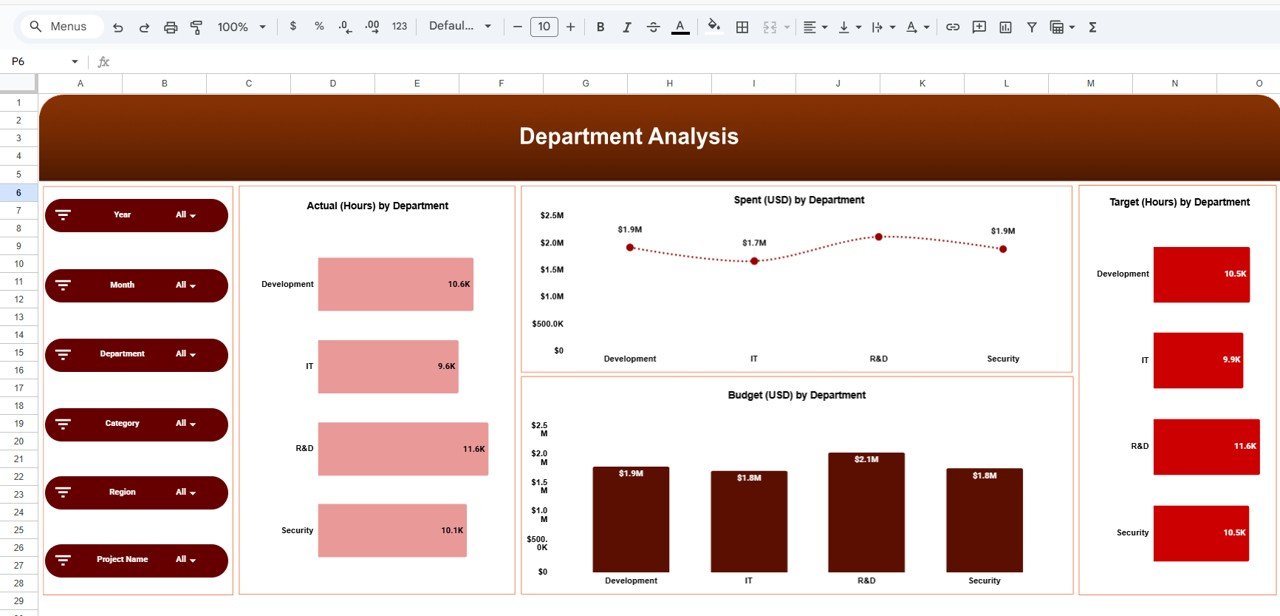
2️⃣ Department Analysis Page
Compare:
-
Actual vs Target Hours
-
Budget vs Spent
-
Department Performance Efficiency
Identify which teams are overburdened or underutilized.
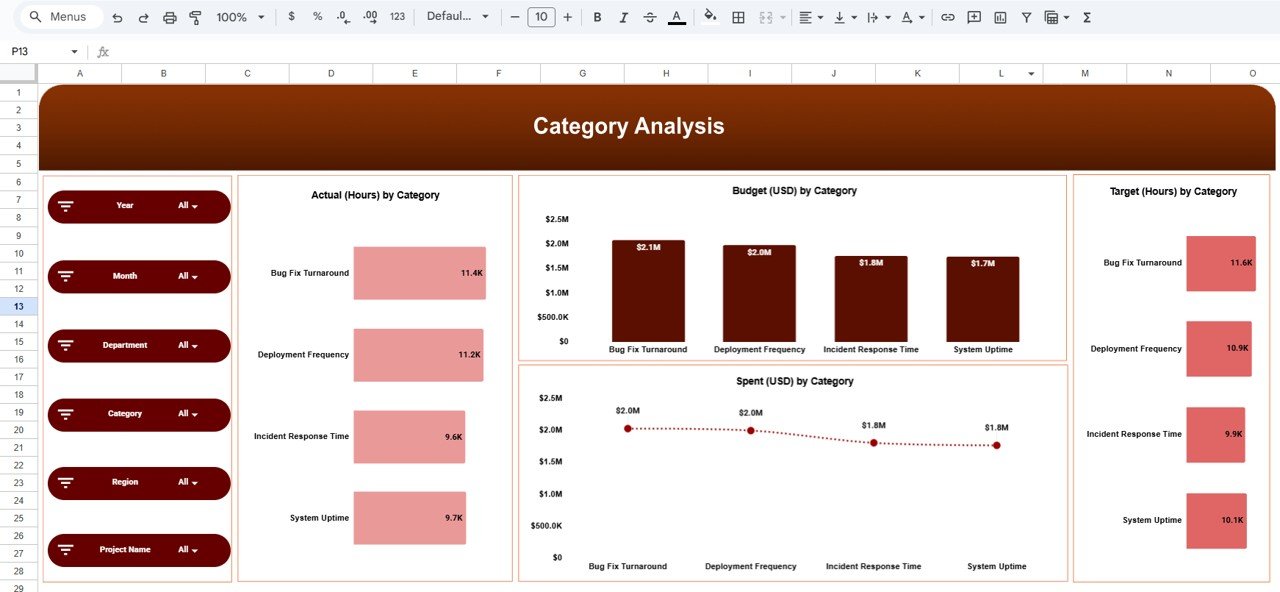
3️⃣ Category Analysis Page
Evaluate operational metrics such as:
-
Bug Fix Turnaround
-
Deployment Frequency
-
Incident Response Time
-
System Uptime
Detect resource-heavy categories quickly.
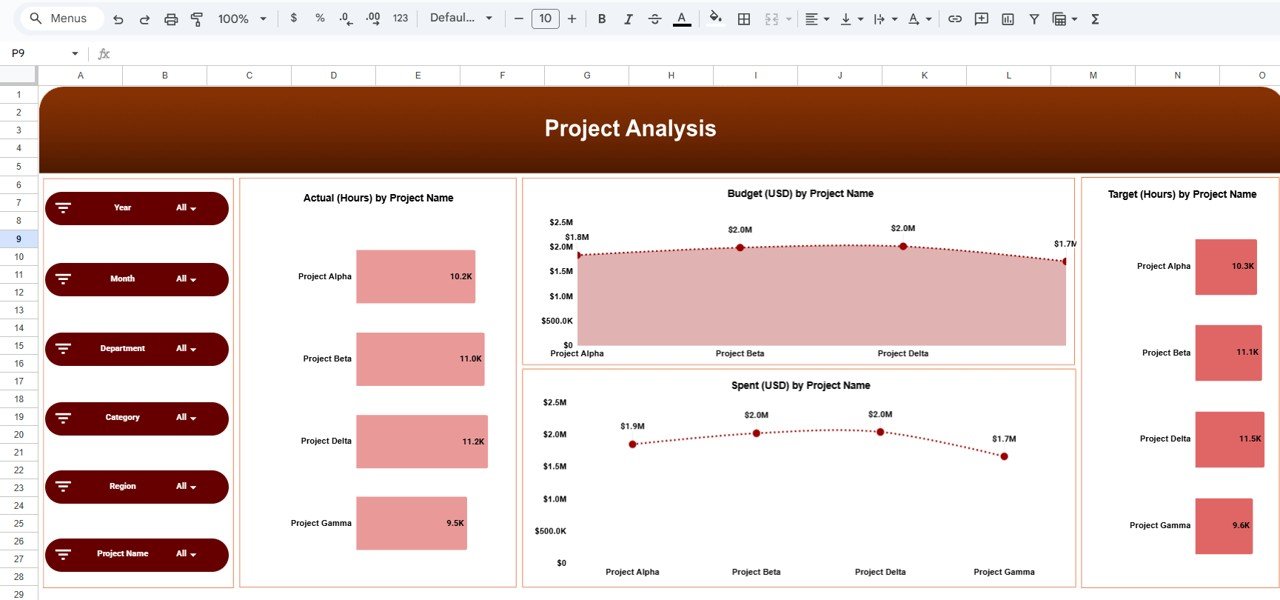
4️⃣ Project Analysis Page
Monitor:
-
Actual Hours by Project
-
Budget by Project
-
Spent by Project
-
Target Hours by Project
Control project-level financial and performance variance.
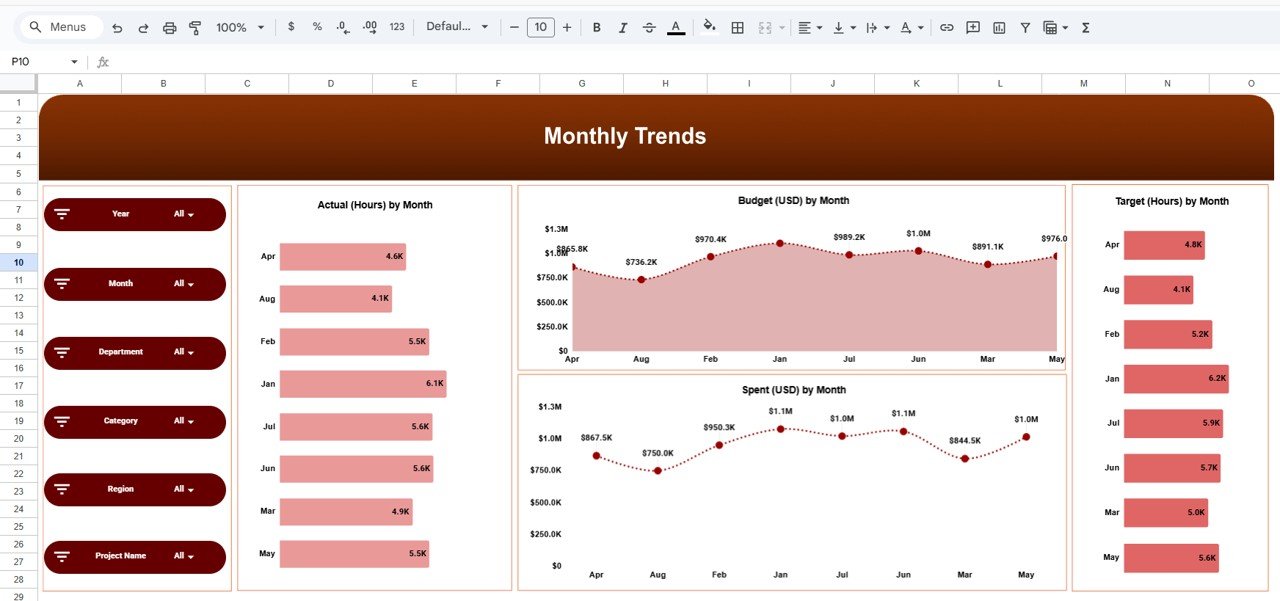
5️⃣ Monthly Trends Page
Analyze:
-
Actual Hours by Month
-
Budget Allocation by Month
-
Spent by Month
-
Target Hours by Month
Identify workload peaks and cost patterns easily.
Every sheet is designed for clarity, accuracy, and fast decision-making.
⚙️ How to Use the Technology Dashboard in Google Sheets
1️⃣ Enter weekly or monthly performance data.
2️⃣ Update budget and hours information.
3️⃣ Use slicers to filter by department, region, or project.
4️⃣ Review KPI cards and performance charts.
5️⃣ Analyze budget variance and workload efficiency.
Within minutes, you gain full control over technology operations.
No advanced technical skills required.
👥 Who Can Benefit from This Technology Dashboard?
💻 IT Managers
👨💼 CTOs
📊 Project Managers
👨💻 Software Development Teams
🔐 Cybersecurity Teams
🚀 Startup Founders
📈 Technology Consultants
Whether you manage small teams or enterprise operations, this dashboard scales with your needs.
Why This Dashboard Is a Game-Changer
✔️ Centralized performance monitoring
✔️ Improved deadline management
✔️ Better budget control
✔️ Clear workload distribution
✔️ Faster issue resolution tracking
✔️ Data-driven technology decisions
Technology environments demand visibility. This dashboard delivers it.
Stop guessing. Start measuring.
Click here to read the Detailed blog post
Watch the step-by-step video tutorial: