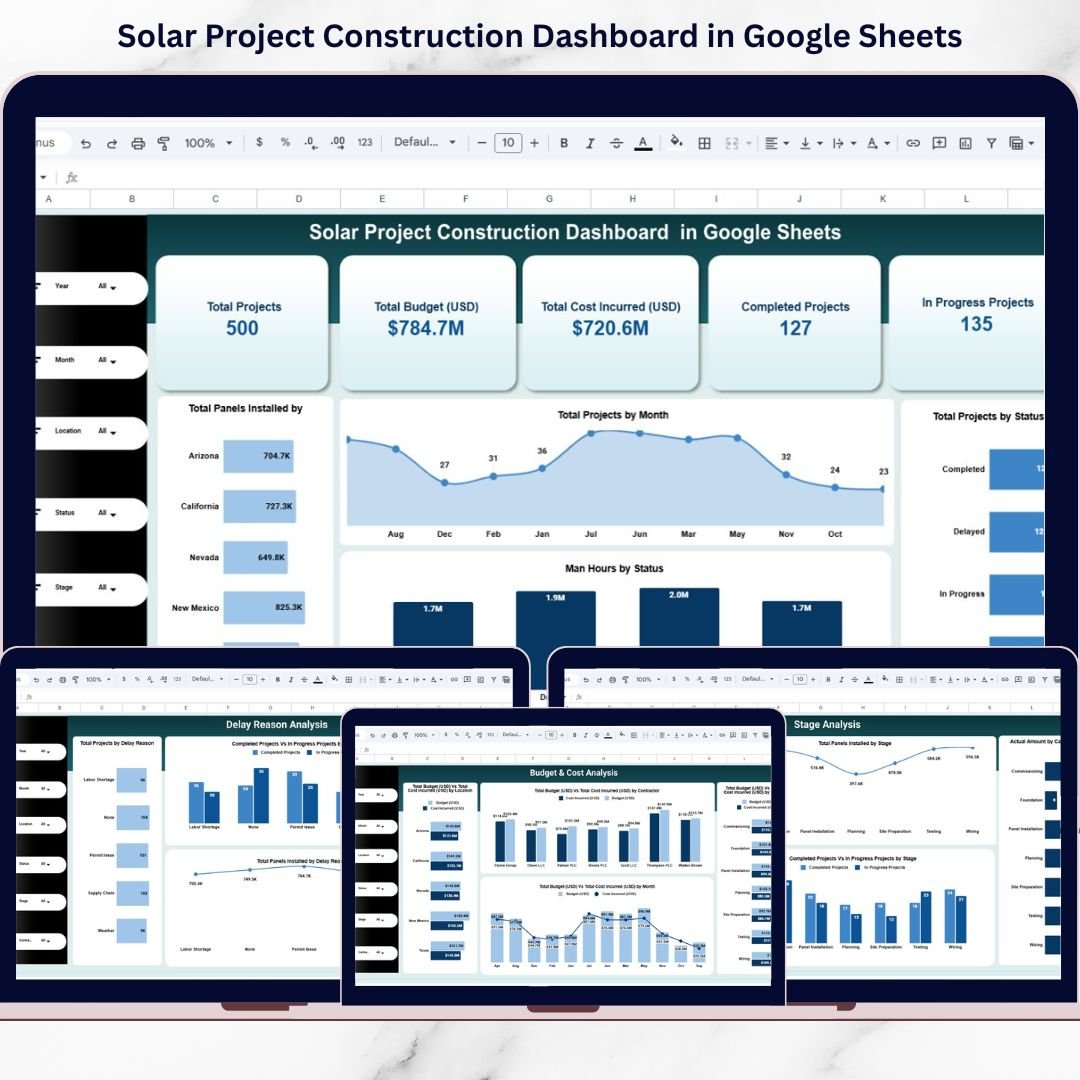
Solar projects are complex. Budgets are large. Timelines are tight. Delays are costly. And when your data sits in multiple sheets, you lose visibility.
Imagine tracking 500+ projects, budgets worth millions, contractor performance, stage progress, and delay reasons — all from one powerful Google Sheets dashboard.
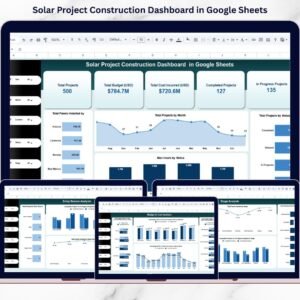
Introducing the Solar Project Construction Dashboard in Google Sheets — a ready-to-use, real-time project monitoring solution built for solar EPC companies, contractors, and renewable energy firms.
This interactive dashboard gives you instant insights into project count, budget vs cost incurred, panels installed, man-hours, delay analysis, and contractor efficiency. Select filters by year, month, location, status, stage, or contractor — and every number updates automatically.
No complex setup. No confusing reports. Just smart solar project management.
🚀 Key Features of Solar Project Construction Dashboard in Google Sheets
📊 Real-Time Project Overview – Track total projects, completed, in-progress, delayed, and pending projects instantly.
💰 Budget vs Cost Monitoring – Compare total budget and actual cost by location, stage, contractor, and month.
⚡ Stage-Wise Performance Analysis – Monitor foundation, installation, wiring, testing, and commissioning progress.
⏳ Delay Reason Insights – Identify labor shortages, permit issues, supply chain delays, and weather impact.
🤝 Contractor Performance Evaluation – Compare panels installed, costs incurred, and project completion rates.
📍 Dynamic Slicers & Filters – Filter by year, month, location, stage, status, and contractor.
🔍 Advanced Project Search Page – Instantly search projects by keyword and view detailed information.
📈 Man-Hour & Panel Tracking – Analyze workforce productivity and installation efficiency.
☁️ Cloud-Based Collaboration – Multi-user access via Google Sheets.
This dashboard transforms solar construction data into clear, actionable insights.
📦 What’s Inside the Solar Project Construction Dashboard in Google Sheets
This ready-to-use dashboard includes multiple analytical pages:
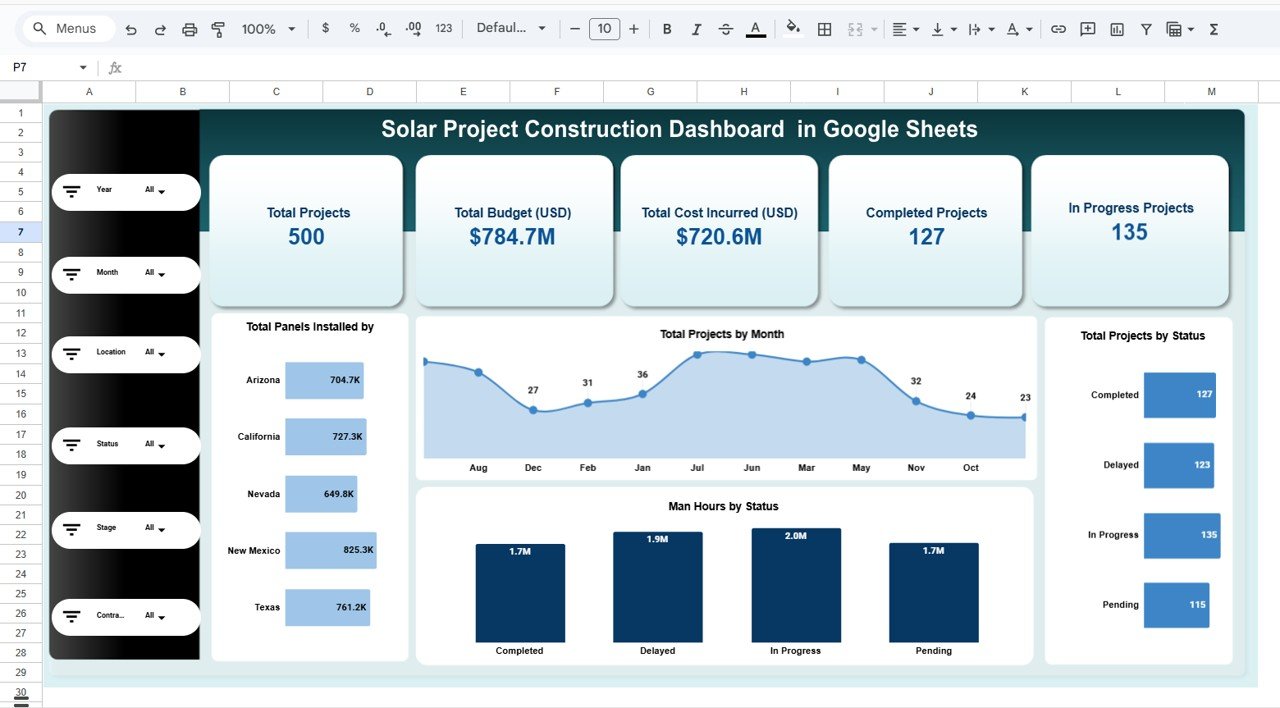
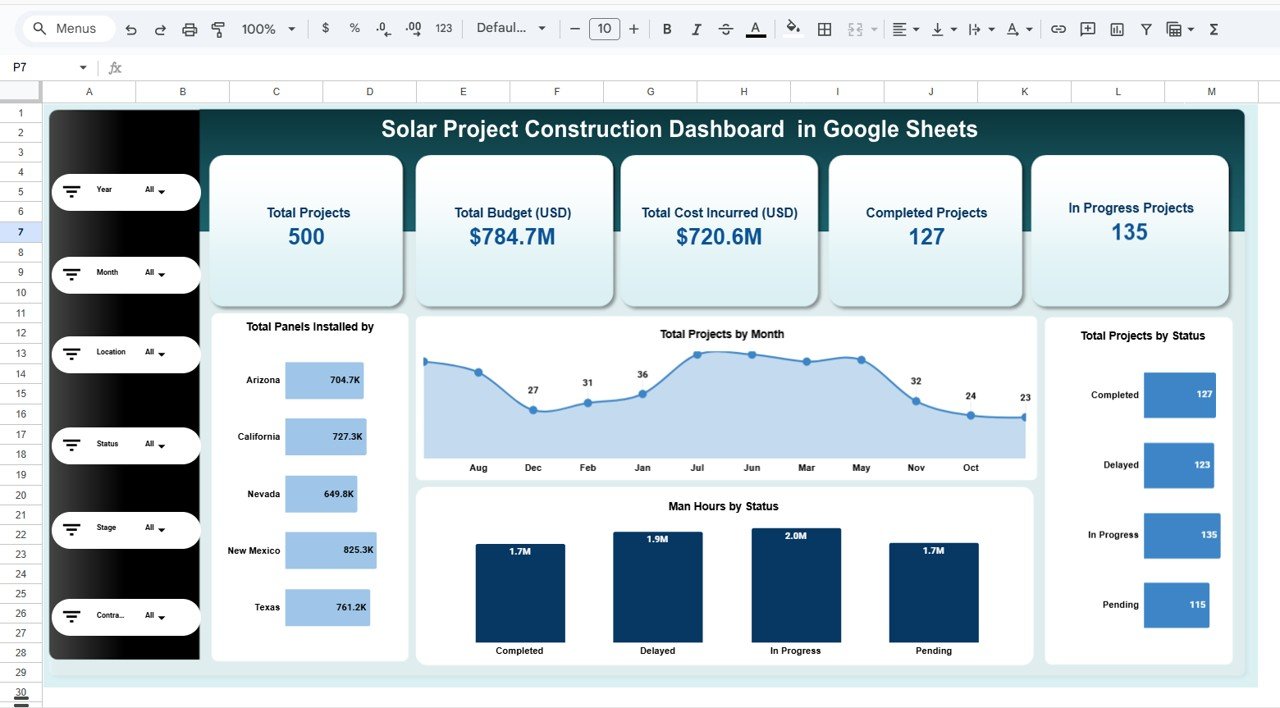
1️⃣ Overview Dashboard
Total Projects
Budget vs Cost Summary
Completed, In Progress, Delayed Projects
Panels Installed by Location
Projects by Month
Man-Hours by Status
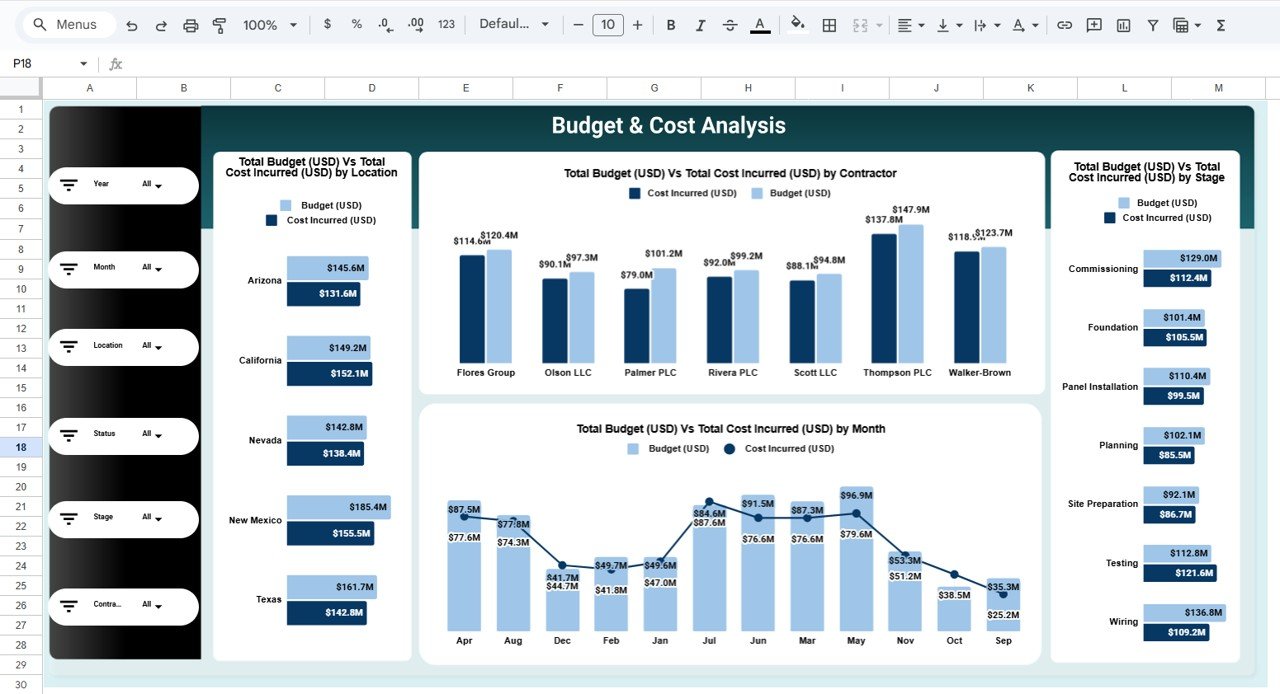
2️⃣ Budget & Cost Analysis Page
Budget vs Cost by Location
Budget vs Cost by Contractor
Budget vs Cost by Stage
Budget vs Cost by Month
Instantly detect overspending and cost variance.
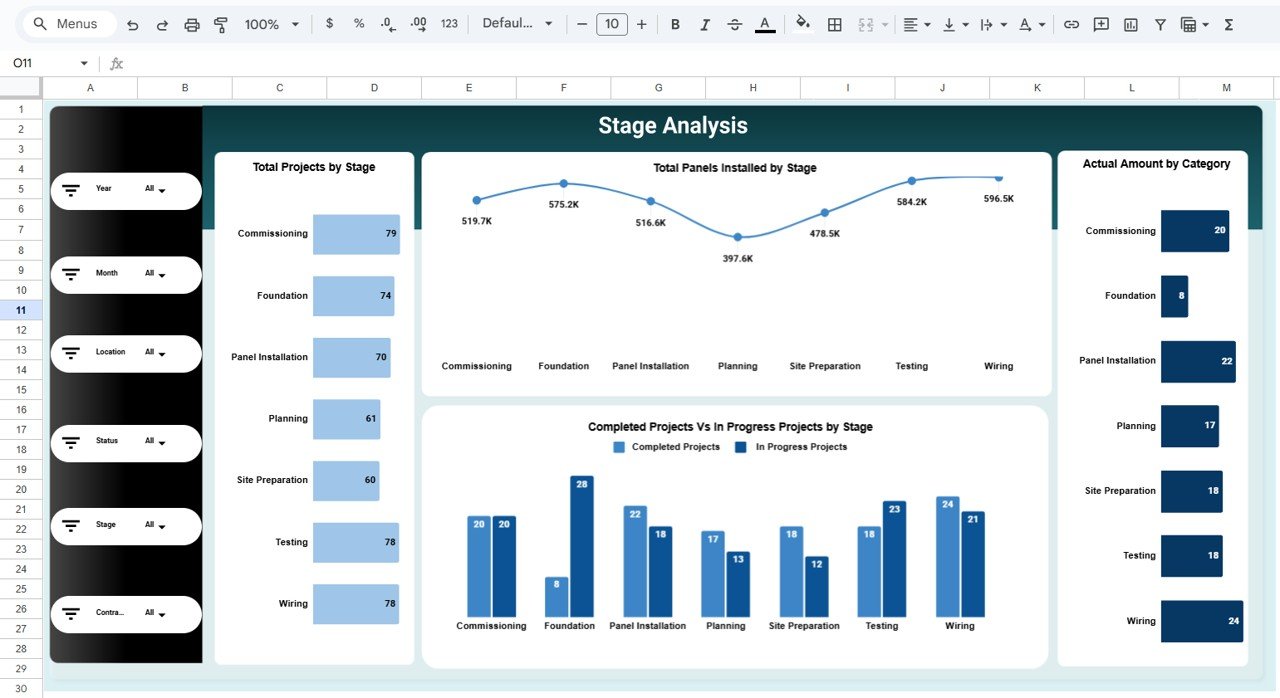
3️⃣ Stage Analysis Page
Projects by Construction Stage
Panels Installed by Stage
Completed vs In-Progress by Stage
Actual Amount by Category
Identify bottlenecks in planning, site preparation, installation, testing, and commissioning.
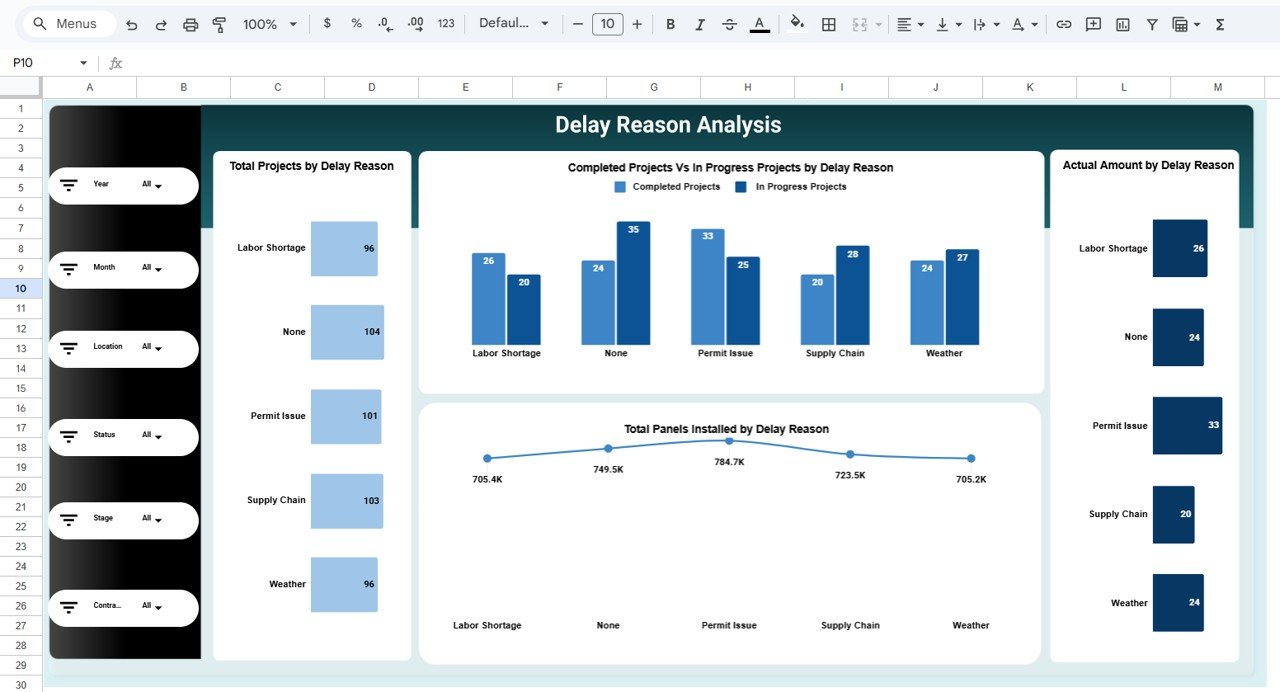
4️⃣ Delay Reason Analysis Page
Projects by Delay Reason
Cost Impact by Delay
Panels Installed by Delay Category
Completed vs In-Progress by Delay
Spot recurring issues before they affect profitability.
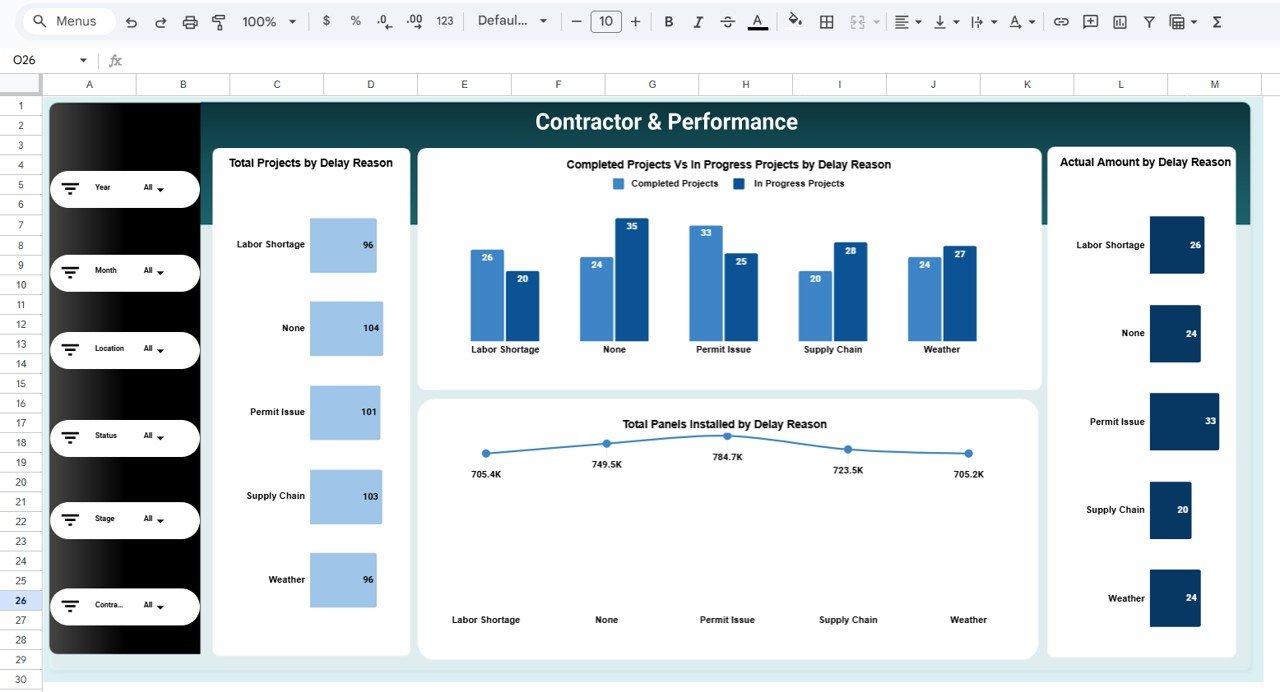
5️⃣ Contractor & Performance Page
Projects by Contractor
Cost Incurred by Contractor
Panel Installation Comparison
Delay Impact by Contractor
Evaluate efficiency clearly and objectively.
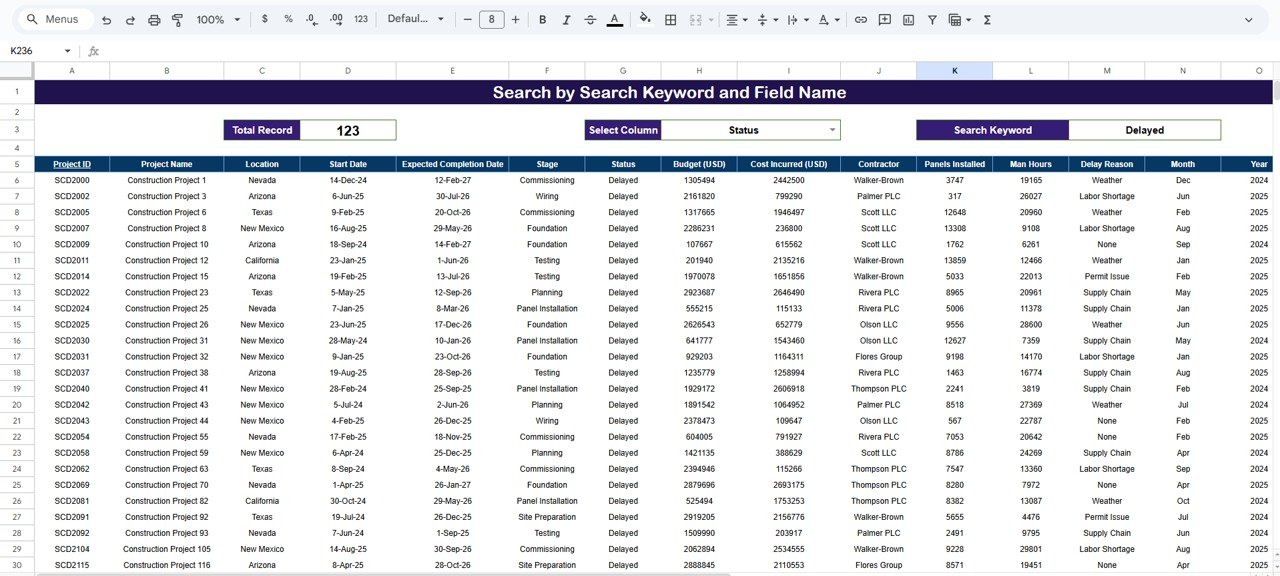
6️⃣ Search Page
Find any project instantly using keyword search. View detailed data including:
Project ID, Name, Location, Dates, Stage, Status, Budget, Cost, Contractor, Panels Installed, Man-Hours, Delay Reason, Month & Year.
Everything you need — centralized and structured.
⚙️ How to Use the Solar Project Construction Dashboard in Google Sheets
1️⃣ Enter project data (budget, cost, panels, man-hours, delays).
2️⃣ Select filters (year, month, stage, contractor, location).
3️⃣ Review overview KPIs instantly.
4️⃣ Analyze budget variance and delay patterns.
5️⃣ Evaluate contractor performance.
6️⃣ Use the search tool for detailed project lookup.
Within minutes, you gain complete visibility into your solar construction portfolio.
👷 Who Can Benefit from This Solar Project Construction Dashboard?
☀️ Solar EPC Companies
🏗️ Construction Project Managers
🌱 Renewable Energy Firms
🔧 Engineering Consultants
🏢 Government Solar Departments
📊 Solar Developers
Whether you manage 10 projects or 500, this dashboard scales with your needs.
Why This Dashboard Is a Must-Have
✔️ Prevent budget overruns
✔️ Reduce costly project delays
✔️ Improve contractor accountability
✔️ Monitor stage progress clearly
✔️ Track panels and workforce productivity
✔️ Make faster data-driven decisions
Solar construction demands precision. This dashboard gives you total control.
Stop juggling spreadsheets. Start managing projects strategically.
Click here to read the Detailed blog post
Watch the step-by-step video tutorial: