
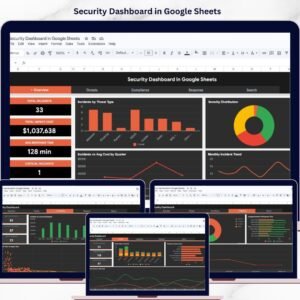
The Security Company Dashboard in Google Sheets tracks 4 KPI cards, 15 interactive charts, and 6 working sheet tabs from one editable Google Sheets file. Setup takes under 10 minutes — make your copy, paste your service records into the Data sheet, and every KPI, chart, and slicer updates automatically.
🌍 Join 8,400+ teams in 40+ countries using NextGenTemplates to replace paid SaaS tools with one-time-purchase Excel, Google Sheets, Power BI, and HTML templates.
✅ Instant download · One-time payment · No subscription · No per-user fees · Lifetime access
🔑 Key Features of the Security Company Dashboard in Google Sheets
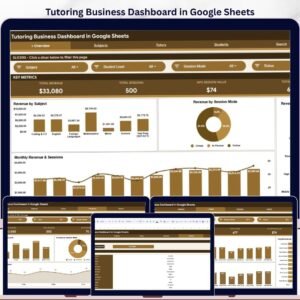
📊 4 KPI cards — Total Contract Value, Total Services, Incidents Logged, and Hours Logged sit across the Overview so leadership sees headline numbers the instant the file opens. Each card reads directly from the Data sheet.
📈 15 interactive charts spread across the Overview, Services, Regions, and Incidents tabs — covering contract value by service type, region, and client sector, plus monthly trends for contract value, hours logged, and incidents. Chart ranges auto-expand as you add rows.
🎛️ Native slicers on every page let you filter the whole dashboard by service type, region, shift, or client sector in one click. A dedicated Search sheet returns any full service record from a single Service ID.
📦 What’s Inside the Security Company Dashboard in Google Sheets
Overview Page
Four KPI cards — Total Contract Value, Total Services, Incidents Logged, Hours Logged — plus Contract Value by Service Type, Contract Value by Region, Contract Value by Client Sector, and Monthly Contract Value vs Hours Logged. Slicers reshape every chart instantly.

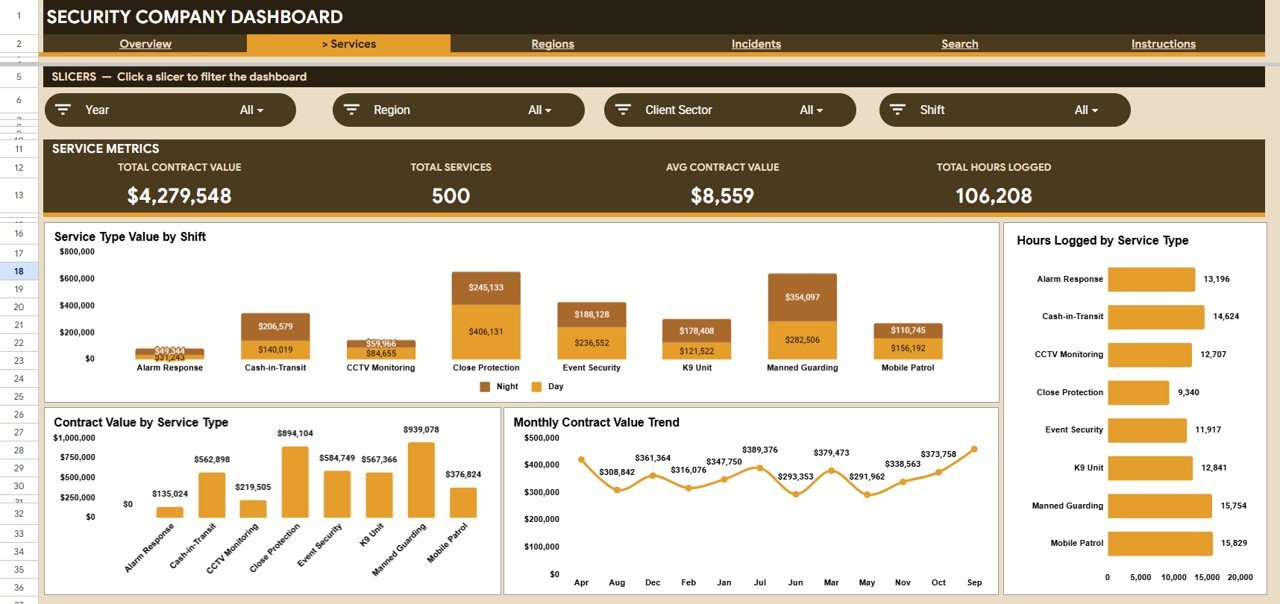
Services Analysis
Breaks the business down by what you sell: Service Type Value by Shift, Hours Logged by Service Type, Contract Value by Service Type, and a Monthly Contract Value Trend.
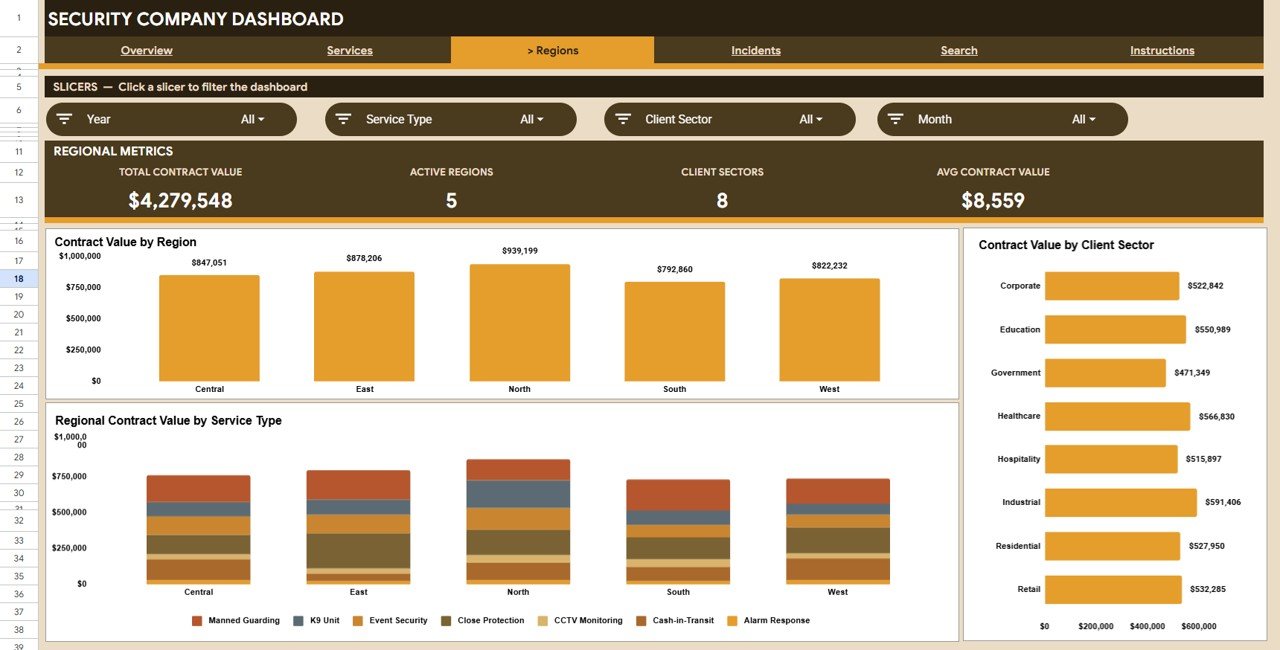
Regions Analysis
Compares territories with Contract Value by Region, Regional Contract Value by Service Type, and Contract Value by Client Sector — so you know where to deploy guards and focus sales.
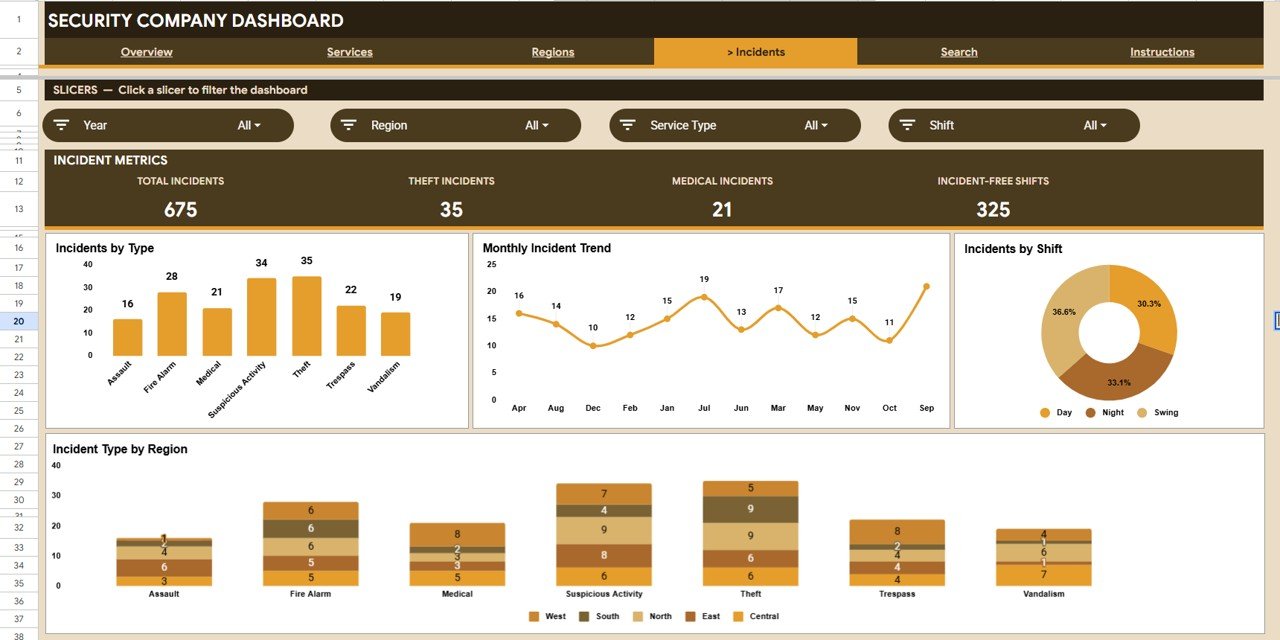
Incidents Analysis
Keeps risk in view with Incidents by Type, a Monthly Incident Trend, Incidents by Shift, and Incident Type by Region — revealing whether incidents cluster on certain shifts or regions.
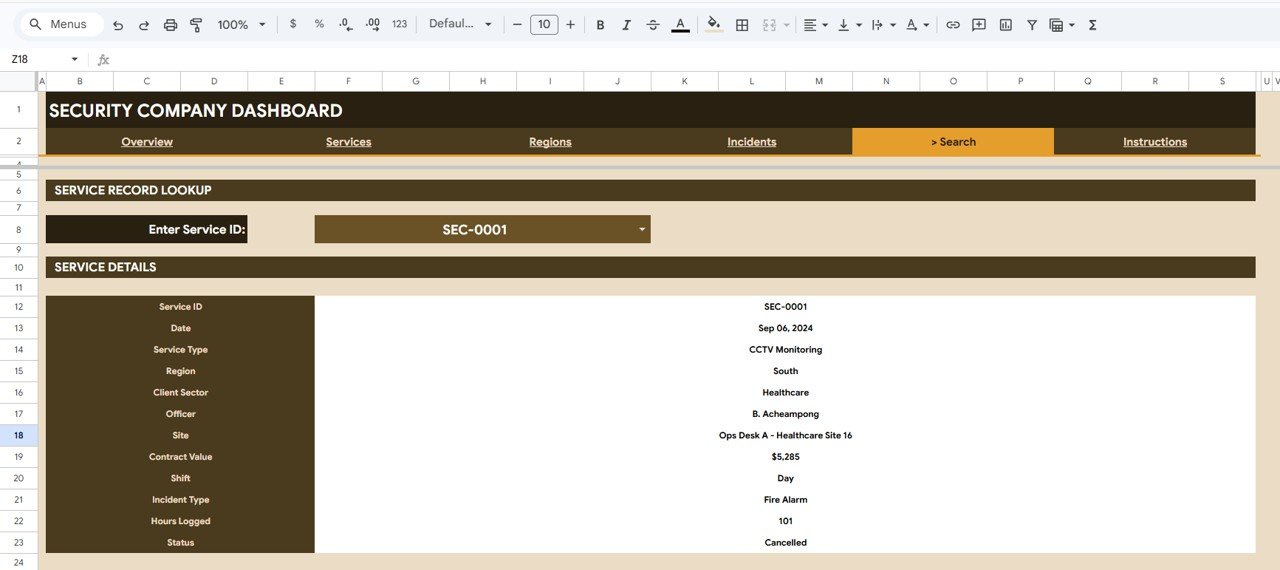
Search Sheet
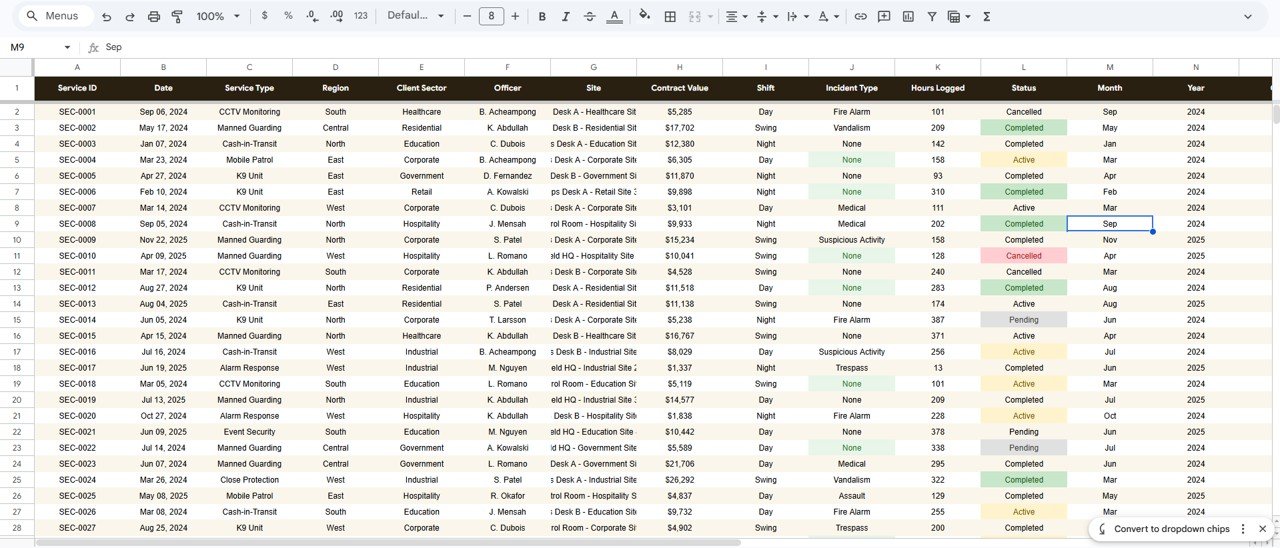
Enter a Service ID and the dashboard instantly returns the full record — date, service type, region, client sector, officer, site, contract value, shift, incident type, hours logged, and status.
Data Sheet
Add or paste your service records in the same column format. Every KPI, chart, and slicer across the workbook updates automatically — this is the only sheet you maintain day to day.
📊 Security Company Dashboard vs Microsoft Excel vs Paid Security Software — Where This Fits
| Feature | Security Company Dashboard (Google Sheets) | Microsoft Excel Dashboard | TrackTik / Silvertrac (Paid SaaS) |
|---|---|---|---|
| Cost | $9.99 one-time | $9.99-$17.99 one-time | $50-$150+ / user / month |
| Platform | Google Sheets (browser) | Microsoft Excel (desktop) | Proprietary web + app |
| Setup time | Under 10 minutes | Under 10 minutes | Days to weeks |
| Real-time team collaboration | ✅ Built in | Limited (OneDrive) | ✅ Yes |
| Mobile access | ✅ Sheets app | Excel mobile | ✅ Yes |
| Customizable fields | ✅ Fully editable | ✅ Fully editable | Limited to vendor schema |
| Share with a link | ✅ One click | File share | ✅ Account-based |
| You own your data | ✅ In your Drive | ✅ On your device | Vendor servers |
| Year-1 cost at 5 users | $9.99 | $9.99-$17.99 | $3,000-$9,000+ |
For security firms that want contract, hours, and incident visibility without paying thousands a year for guard-management SaaS, the Security Company Dashboard in Google Sheets sits in the sweet spot.
👥 Who This Template Is For — and Who It’s Not For
✅ This template is built for:
- Owners and operations managers of small to mid-size security and guarding companies
- Security firms juggling multiple service types, regions, and client sectors
- Teams that want one shared, browser-based dashboard instead of monthly manual reports
❌ This template is NOT for:
- Firms needing live GPS guard tracking, geofenced tour scanning, or automated dispatch
- Enterprise teams requiring SSO and SOC 2 compliance controls
⚙️ How to Use the Security Company Dashboard in Google Sheets
- Open your download PDF and click the Google Sheets copy link to create your own editable copy.
- Open the Data sheet and paste your service records in the existing column format.
- Return to the Overview and watch the 4 KPI cards and charts update automatically.
- Use the slicers to filter by service type, region, shift, or client sector.
- Use the Search sheet to pull any single record by its Service ID.
💼 Real-World Use Cases
Rajesh runs a 60-guard security company across three cities. He uses the Security Company Dashboard in Google Sheets to see contract value by region and which service types are growing, then redeploys guards toward the regions winning the most contracts — without per-seat SaaS fees.
Maria manages operations at a commercial guarding firm. Every Monday she checks the Incidents tab for the monthly trend and incidents by shift, then briefs supervisors on night-shift hotspots before the week starts.
❓ Frequently Asked Questions
What KPIs does the Security Company Dashboard in Google Sheets track?
The Security Company Dashboard in Google Sheets tracks 4 KPI cards: Total Contract Value, Total Services, Incidents Logged, and Hours Logged. All four update automatically when you add records to the Data sheet.
How long does setup take?
Setup takes under 10 minutes — make your copy of the Security Company Dashboard in Google Sheets, paste your records into the Data sheet, and every chart and KPI updates on its own.
How does this compare to paid security software like TrackTik?
Paid platforms such as TrackTik or Silvertrac charge $50-$150 per user per month. The Security Company Dashboard in Google Sheets is a one-time $9.99 purchase for reporting and analysis.
Do I need to install any software?
No. The Security Company Dashboard in Google Sheets runs entirely in Google Sheets through any web browser, on desktop or mobile.
Can my whole team use it at once?
Yes. Share the Security Company Dashboard in Google Sheets by link and multiple people can view and edit at the same time, with no per-user fees.
👤 About the Author
Built by PK — Microsoft Certified Professional with 15+ years of Excel, Google Sheets, and Power BI experience. Founder of NextGenTemplates, reaching 300K+ subscribers across YouTube channels (@PK-AnExcelExpert, @NextGenTemplates, @NeoTechNavigators). Every template is hand-built and tested before release.
🔗 Explore Related Templates
Browse more Google Sheets Dashboards, or pair this with the Equipment Maintenance Management System Web App and the Pest Control Dashboard in Google Sheets.
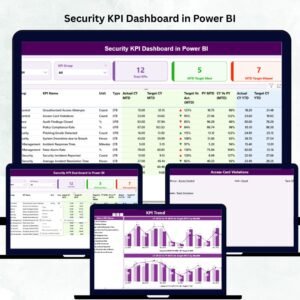
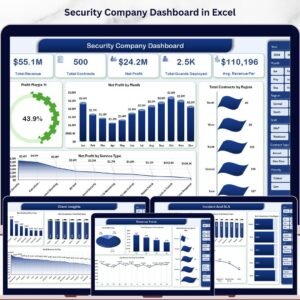
Also available as: the same dashboard in Microsoft Excel and Power BI.
📖 Click here to read the Detailed Blog Post
Watch the step-by-step video tutorial:
🎥 Visit our YouTube channel for step-by-step video tutorials
👉 YouTube.com/@NextGenTemplates


Reviews
There are no reviews yet.