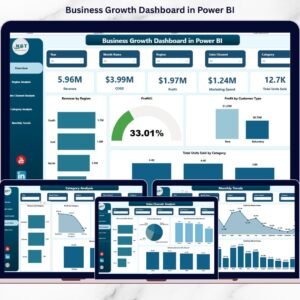
Are you ready to unlock real growth insights in minutes instead of hours? Stop guessing and start making powerful, data-driven decisions with our Business Growth Dashboard in Power BI.
In today’s fast-moving market, businesses cannot afford delays. Revenue changes daily. Costs fluctuate unexpectedly. Marketing performance shifts every month. If you are still using scattered spreadsheets, you are missing opportunities.
This ready-to-use Power BI dashboard brings all your critical business metrics into one interactive and professional report — designed to help you scale smarter and faster.
🚀 Key Feature of Business Growth Dashboard in Power BI
📌 5 Fully Designed Dashboard Pages – Structured analytics across Overview, Region, Channel, Category, and Monthly Trends.
📊 Powerful KPI Cards – Instantly track Revenue, COGS, Profit, Marketing Spend, and Total Units Sold.
🌍 Region-Level Performance Insights – Identify high-growth and low-profit regions quickly.
🛒 Sales Channel Comparison – Analyze Online, Retail, Wholesale, Distributor, and Direct Sales performance.
📦 Category Profitability Analysis – Discover which product lines generate maximum margins.
📈 Monthly Trend Tracking – Monitor Revenue, COGS, and Profit patterns over time.
🎯 Interactive Slicers & Filters – Drill down by month, region, channel, or category in one click.
⚡ Real-Time Decision Support – Replace manual reporting with dynamic visualization.

📂 What’s Inside the Business Growth Dashboard in Power BI
This digital product includes a professionally built Power BI file with:
✔️ Clean data model
✔️ Pre-built DAX measures
✔️ Structured relationships
✔️ Optimized visuals
✔️ Interactive charts
✔️ KPI comparison logic
✔️ Growth-focused layout
Dashboard Pages Included:
1️⃣ Overview Page
Your command center. Instantly view Revenue, COGS, Profit, Marketing Spend, and Units Sold along with performance breakdowns by region, category, and customer type.
2️⃣ Region Analysis Page
Compare cost, profit, marketing investment, and sales volume across regions to optimize geographic strategy.
3️⃣ Sales Channel Analysis Page
Identify your most profitable channel and improve underperforming ones using data-backed insights.
4️⃣ Category Analysis Page
Understand product-level profitability and allocate marketing budgets more effectively.
5️⃣ Monthly Trends Page
Track growth consistency, seasonal demand patterns, and cost fluctuations month over month.
🛠 How to Use the Business Growth Dashboard in Power BI
Using this dashboard is simple and powerful:
1️⃣ Import your structured business data into Power BI.
2️⃣ Connect it to the existing data model.
3️⃣ Refresh the dataset.
4️⃣ Use slicers to filter by region, channel, category, or month.
5️⃣ Analyze KPI cards and charts instantly.
Within a few clicks, you can identify revenue drivers, profit gaps, and growth opportunities.
No advanced programming is required. Basic DAX understanding is enough — and the file already includes pre-configured measures.
👥 Who Can Benefit from This Business Growth Dashboard in Power BI
This dashboard is perfect for:
🏢 Small & Medium Businesses
🏭 Growing Enterprises
📊 Sales Managers
💰 Finance Teams
📣 Marketing Leaders
📈 Business Analysts
👔 Executives & Decision Makers
If your goal is to improve profitability, optimize costs, and scale operations efficiently — this dashboard is built for you.
💡 Why This Dashboard is a Game-Changer
Instead of waiting for manual reports, you get instant clarity. Instead of guessing performance, you see facts. Instead of reacting late, you act early.
With structured insights on revenue, profit, COGS, marketing spend, and sales volume, your business decisions become smarter and faster.
Stop losing growth opportunities. Start controlling them.
Click here to read the Detailed Blog Post
Watch the step-by-step video tutorial:
Visit our YouTube channel to learn step-by-step video tutorials
Compatibility and Requirements
- Works in Power BI Desktop, which is free to download from Microsoft. See Get Power BI Desktop.
- You import your own business data and connect it to the existing data model, then refresh the dataset.
- Basic DAX knowledge is enough. The pre-built measures are already in the file.
Frequently Asked Questions
Which pages does the dashboard include?
Five pages: Overview, Region Analysis, Sales Channel Analysis, Category Analysis and Monthly Trends.
Which KPIs does it track?
Revenue, COGS, Profit, Marketing Spend and Total Units Sold. The Overview page also breaks performance down by region, category and customer type.
Do I need to write DAX measures myself?
No. The file includes pre-built DAX measures and a prepared data model. Basic DAX understanding is enough if you want to adjust anything.
Can I filter the report?
Yes. Slicers let you filter by month, region, sales channel or category.
Is there an Excel or Google Sheets version?
Yes. See the Business Growth Dashboard in Excel and the Business Growth Dashboard in Google Sheets.
Related Power BI and Business Dashboard Templates
- Business Growth Dashboard in Excel: the same growth dashboard in Excel
- Business Growth Dashboard in Google Sheets: the Google Sheets edition
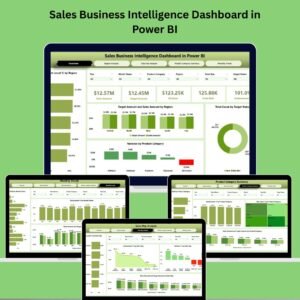
- Sales Business Intelligence Dashboard in Power BI: sales analysis in Power BI
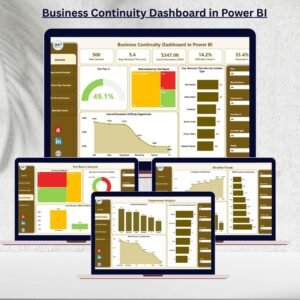
- Business Continuity Dashboard in Power BI: another business dashboard for Power BI
- Power BI Dashboard Mega Collection: 15 Power BI templates in one download
Browse all Power BI dashboards.