


Managing procurement costs efficiently is a critical responsibility for finance, operations, and supply chain teams. Every organization deals with purchase orders, vendors, categories, departments, locations, quantities, and payment terms. However, when procurement data is scattered across multiple spreadsheets or manual reports, understanding total spend, pending orders, and cost-saving opportunities becomes difficult and time-consuming.
That is exactly why the Procurement Cost Analysis Dashboard in Google Sheets becomes a powerful, ready-to-use solution.
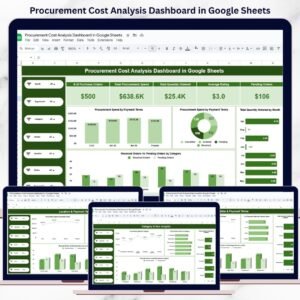
This dashboard transforms raw procurement data into clear KPIs, interactive charts, and actionable insights—all inside Google Sheets. Instead of manually reviewing rows of purchase orders, teams can instantly analyze procurement performance by vendor, department, category, location, payment terms, and order status from a single centralized dashboard.
Because it is built in Google Sheets, this dashboard is cloud-based, collaborative, cost-effective, and easy to customize, without requiring any advanced BI tools or technical skills.
📊 Key Features of Procurement Cost Analysis Dashboard
🔹 Centralized Procurement Visibility
Track all procurement activity—spend, quantities, vendors, and order status—in one dashboard.
🔹 Interactive Filters & Slicers
Analyze data dynamically by:
Month
Department
Category
Vendor
Location
Order Status
Payment Terms
All charts update instantly based on selections.
🔹 Spend & Quantity Analysis
Monitor total procurement spend and quantities ordered across different dimensions.
🔹 Order Status Tracking
Clearly track Ordered, Received, Pending, and Cancelled purchase orders.
🔹 Vendor & Department Accountability
Identify high-spend vendors, delayed suppliers, and departments with high pending orders.
📁 What’s Inside the Procurement Cost Analysis Dashboard
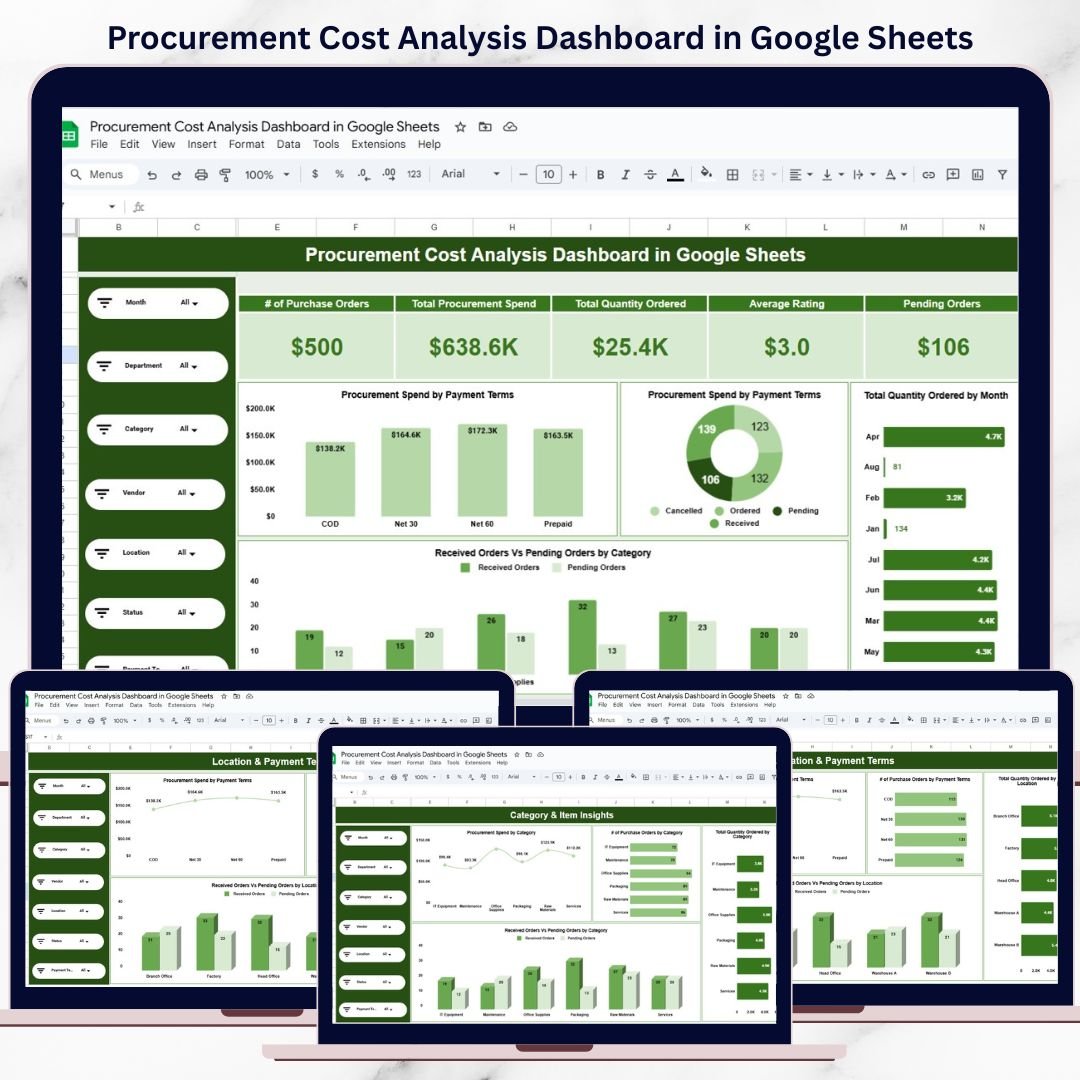
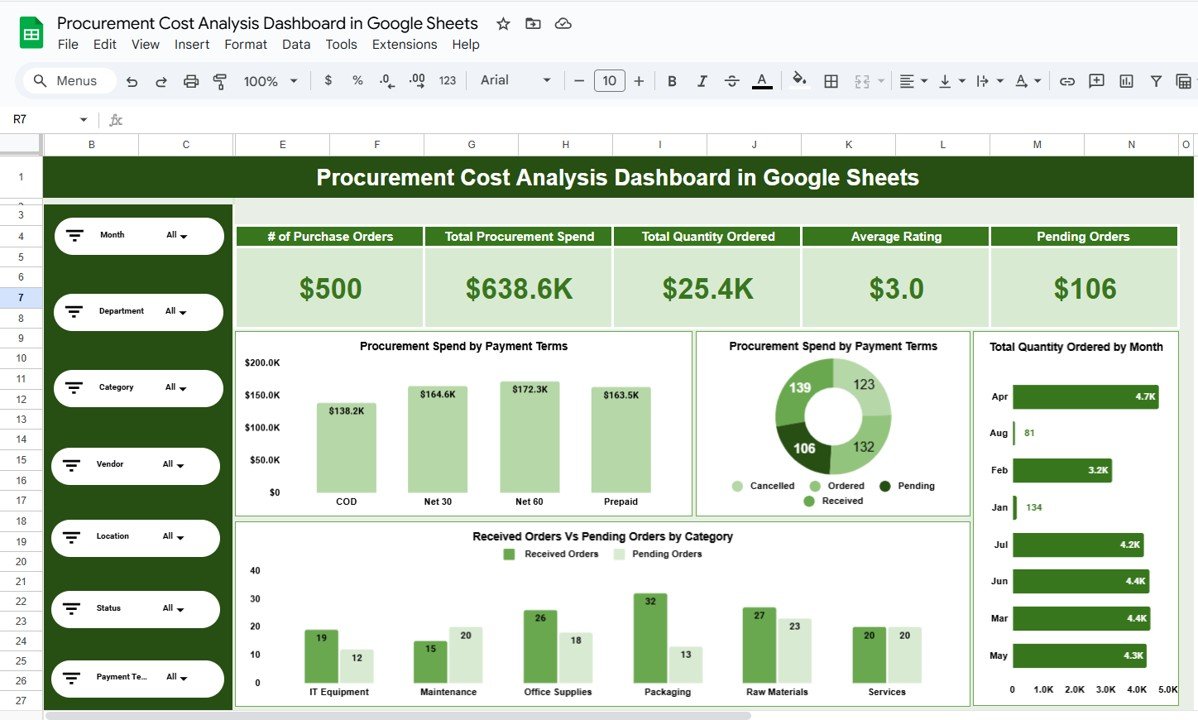
🧭 Overview Sheet – Procurement Snapshot
The Overview sheet provides a high-level summary of procurement performance.
KPI Cards Display:
Number of Purchase Orders
Total Procurement Spend
Total Quantity Ordered
Average Vendor Rating
Pending Orders
Charts Included:
Procurement Spend by Payment Terms
Order Status Distribution (Ordered, Received, Pending, Cancelled)
Total Quantity Ordered by Month
Received Orders vs Pending Orders by Category
This page allows leadership to understand procurement health instantly.
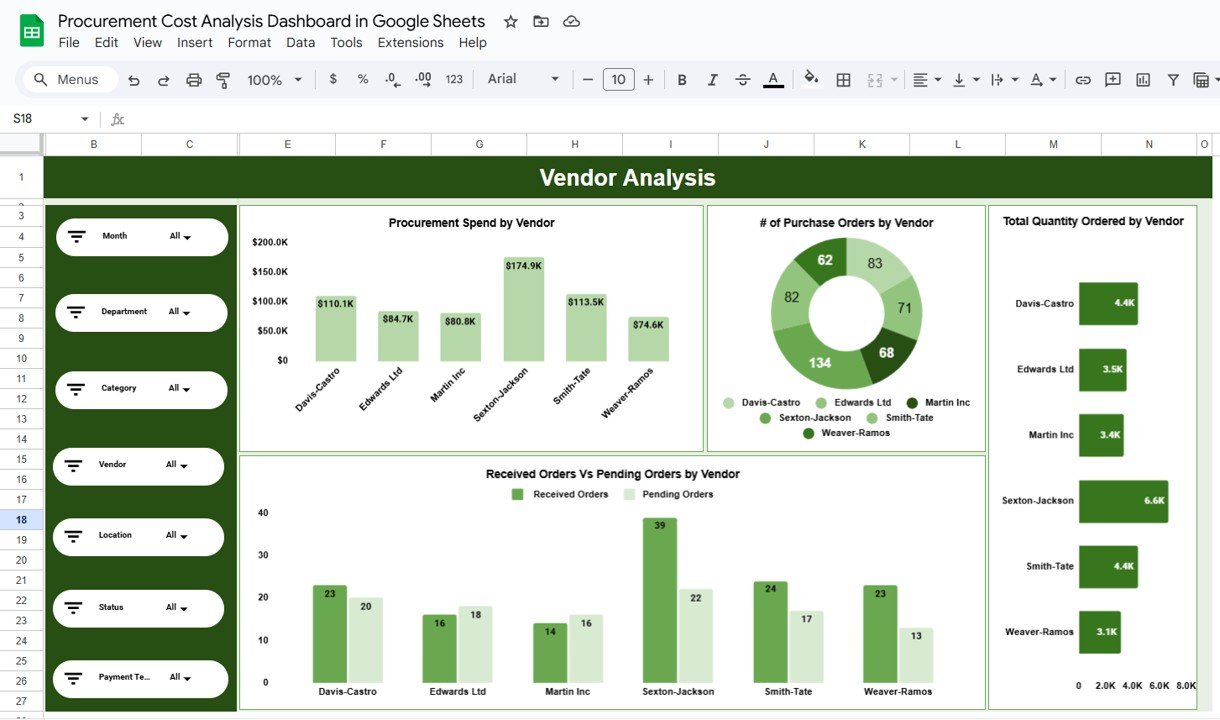
🤝 Vendor Analysis – Supplier Performance
This sheet focuses on vendor-wise procurement insights.
Charts Included:
Procurement Spend by Vendor
Number of Purchase Orders by Vendor
Total Quantity Ordered by Vendor
Received Orders vs Pending Orders by Vendor
It helps identify high-dependency vendors, suppliers causing delays, and opportunities for renegotiation or consolidation.
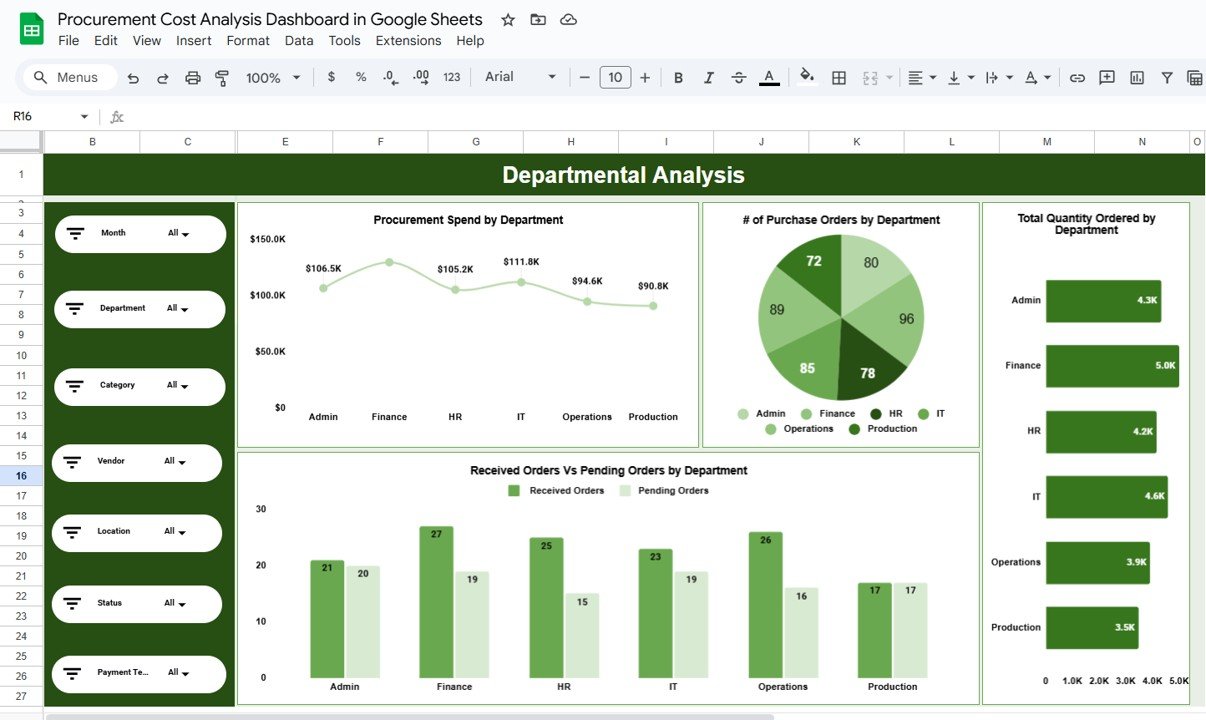
🏢 Departmental Analysis – Internal Spend Control
The Departmental Analysis sheet evaluates procurement behavior across departments.
Charts Included:
Procurement Spend by Department
Number of Purchase Orders by Department
Total Quantity Ordered by Department
Received vs Pending Orders by Department
This analysis improves budget control and internal accountability.
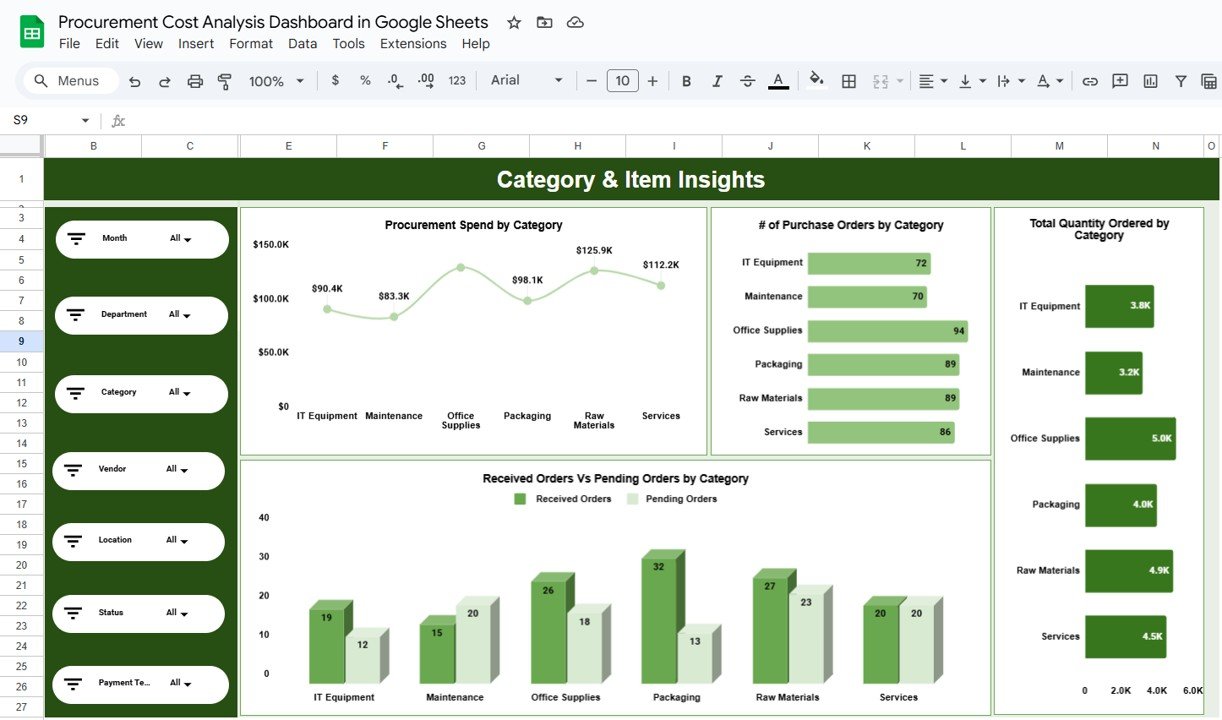
🗂️ Category & Item Insights – Spend Breakdown
This section analyzes procurement by category and item type.
Charts Included:
Procurement Spend by Category
Number of Purchase Orders by Category
Total Quantity Ordered by Category
Received vs Pending Orders by Category
It helps identify high-cost categories, frequently ordered items, and cost-reduction opportunities through bulk purchasing.
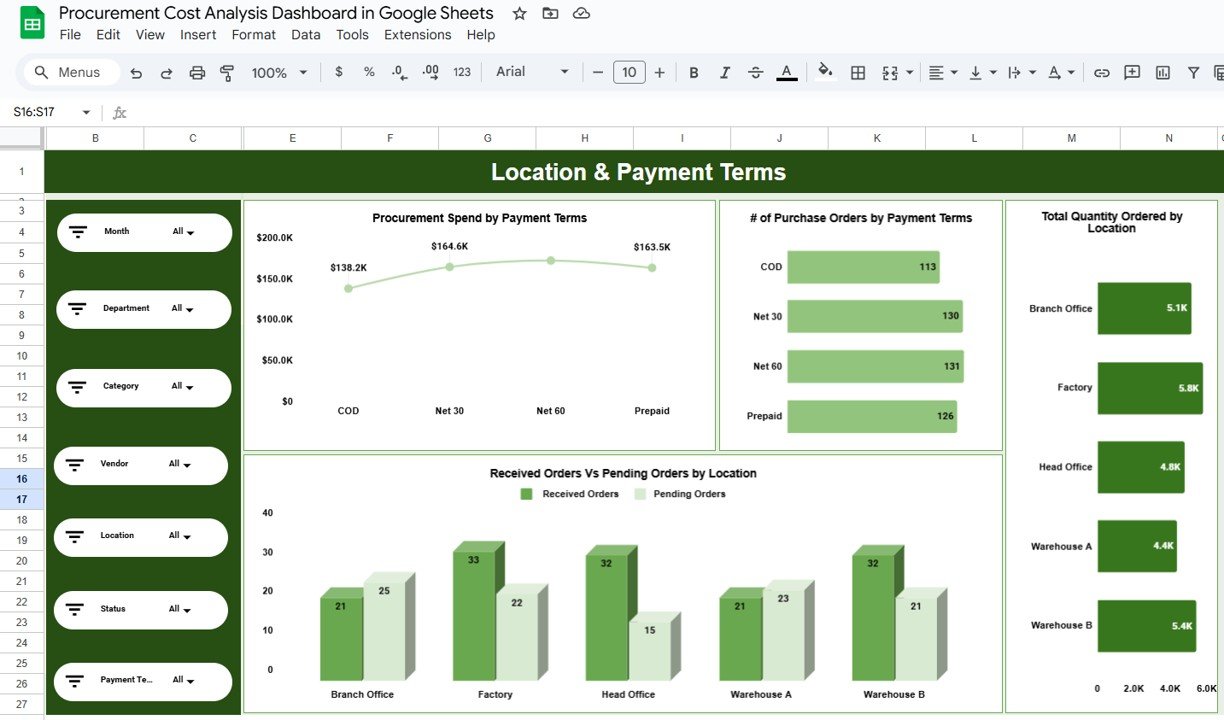
🌍 Location & Payment Terms Analysis
This section focuses on geographical and financial dimensions.
Location Analysis:
Total Quantity Ordered by Location
Received vs Pending Orders by Location
Payment Terms Analysis:
Procurement Spend by Payment Terms
Number of Purchase Orders by Payment Terms
This helps finance teams manage cash flow and optimize supplier payment cycles.
👥 Who Can Benefit from This Dashboard
Procurement Managers
Finance & Accounting Teams
Supply Chain Managers
Operations Teams
Business Owners & Leadership
Internal Audit & Compliance Teams
⚙️ How to Use the Procurement Cost Analysis Dashboard
Enter or paste procurement data into the data sheet
Use filters to analyze spend and orders
Review KPIs and charts regularly
Identify cost overruns and pending orders
Take data-driven procurement decisions
No advanced Google Sheets knowledge required.
### Click here to read the Detailed blog post
Watch the step-by-step video tutorial:
### Visit our YouTube channel to learn step-by-step video tutorials
👉 https://youtube.com/@NeotechNavigators
Compatibility and Requirements
- Works in Google Sheets. You need a free Google account and a web browser.
- The dashboard is built from Google Sheets charts. Google explains them in Add & edit a chart or graph.
Frequently Asked Questions
Which KPIs are on the Overview sheet?
Number of purchase orders, total procurement spend, total quantity ordered, average vendor rating and pending orders.
How can I filter the data?
Use the filters for month, department, category, vendor, location, order status and payment terms. All charts update with your selection.
Which order statuses does it track?
Ordered, Received, Pending and Cancelled.
What analysis pages are included?
Overview, Vendor Analysis, Departmental Analysis, Category and Item Insights, and Location and Payment Terms analysis.
Where do I enter my purchase orders?
Enter or paste them into the data sheet. The KPIs and charts read from that sheet.
Related Procurement Templates
- Procurement Cost Analysis Dashboard in Excel: the same analysis in Excel
- Procurement Tracker and Dashboard in Google Sheets: log purchases and see them on a dashboard
- Purchase Order Tracker in Google Sheets: track each purchase order
- Vendor Payment Dashboard in Google Sheets: follow payments to suppliers
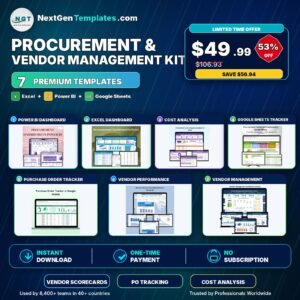
- Procurement and Vendor Management Kit: 7 procurement templates in one download
Browse all Google Sheets dashboards.































Reviews
There are no reviews yet.