

Real estate development is a high-stakes business. Every project involves large capital investments, long execution cycles, multiple phases, location-based risks, and tight profit margins. Developers, investors, and project managers must continuously monitor costs, revenues, progress, and risk exposure. Real Estate Development Dashboard in Power BI However, relying on static Excel reports or disconnected spreadsheets often leads to delayed insights, cost overruns, and missed opportunities.
Real Estate Development Dashboard in Power BI That is exactly where the Real Estate Development Dashboard in Power BI becomes a game-changing solution 🚀.
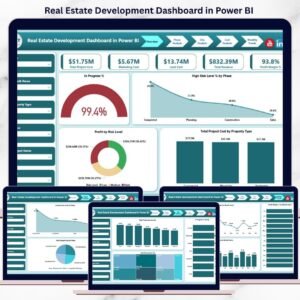
Real Estate Development Dashboard in Power BI This ready-to-use Power BI dashboard converts complex real estate project data into clear, interactive, and decision-ready insights. Instead of manually reviewing multiple reports, stakeholders can track financial performance, project progress, risk levels, and trends from a single visual platform. Moreover, Power BI’s interactive slicers, KPI cards, and charts allow users to explore data instantly and confidently.
Designed for modern real estate organizations, this dashboard helps you control costs, manage risks, improve profitability, and make smarter investment decisions—all in real time.
⭐ Key Features of Real Estate Development Dashboard in Power BI
🏗️ Centralized Project Performance Monitoring
Track cost, revenue, margin, progress, and risk in one dashboard.
💰 Financial Visibility in Real Time
Monitor total project cost, land cost, marketing cost, revenue, and profit margin.
⚠️ Risk-Focused Insights
Analyze high-risk phases and profitability by risk level.
🌍 City & Property Type Analysis
Compare performance across locations and property categories.
📈 Monthly Trend Tracking
Understand cost, revenue, and margin trends over time.
🎛️ Interactive Power BI Experience
Use slicers, filters, and visuals for instant analysis.
📦 What’s Inside the Real Estate Development Dashboard in Power BI
This professionally designed Power BI file includes 5 interactive analytical pages, each answering a critical business question.
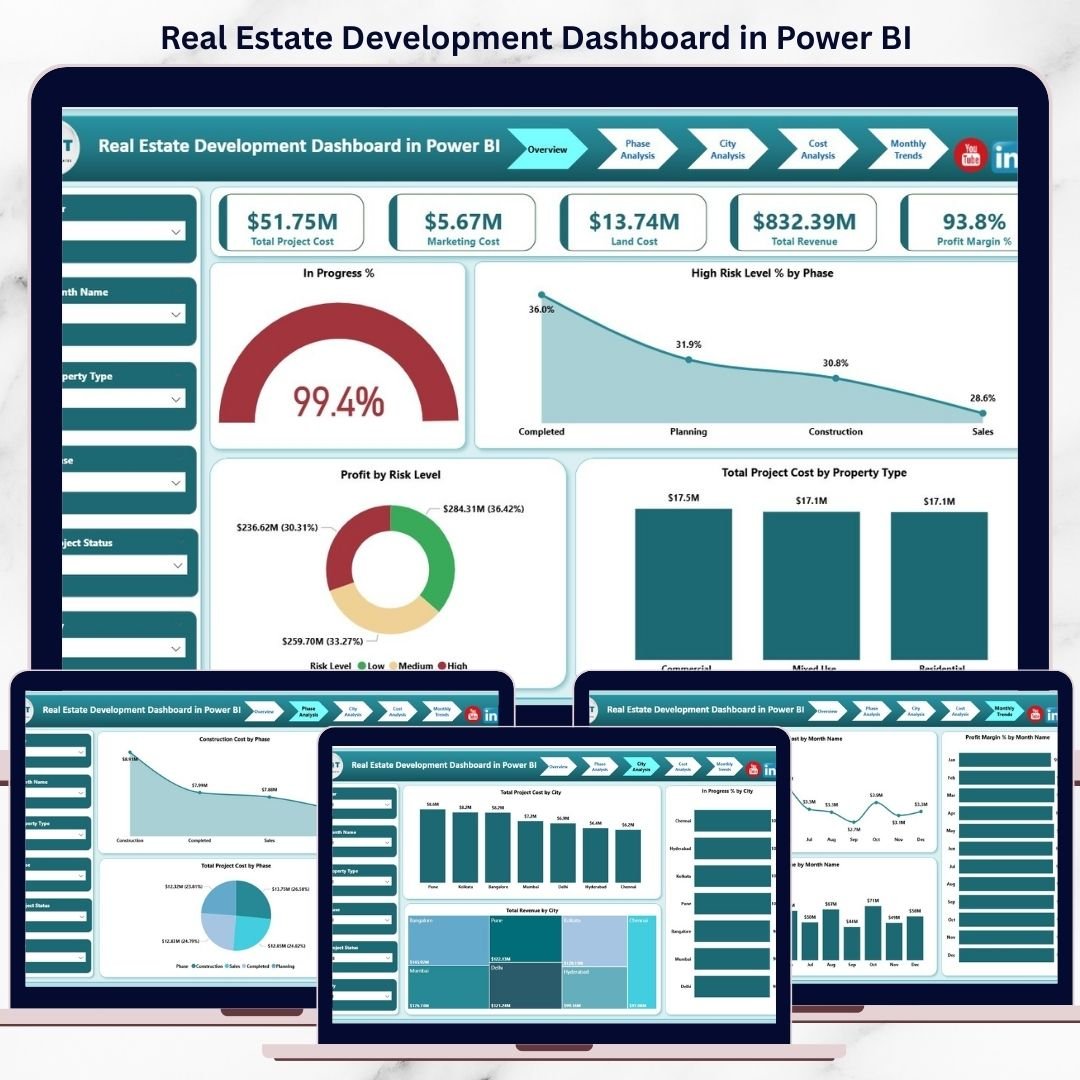
📊 Overview Page
The executive summary of all projects.
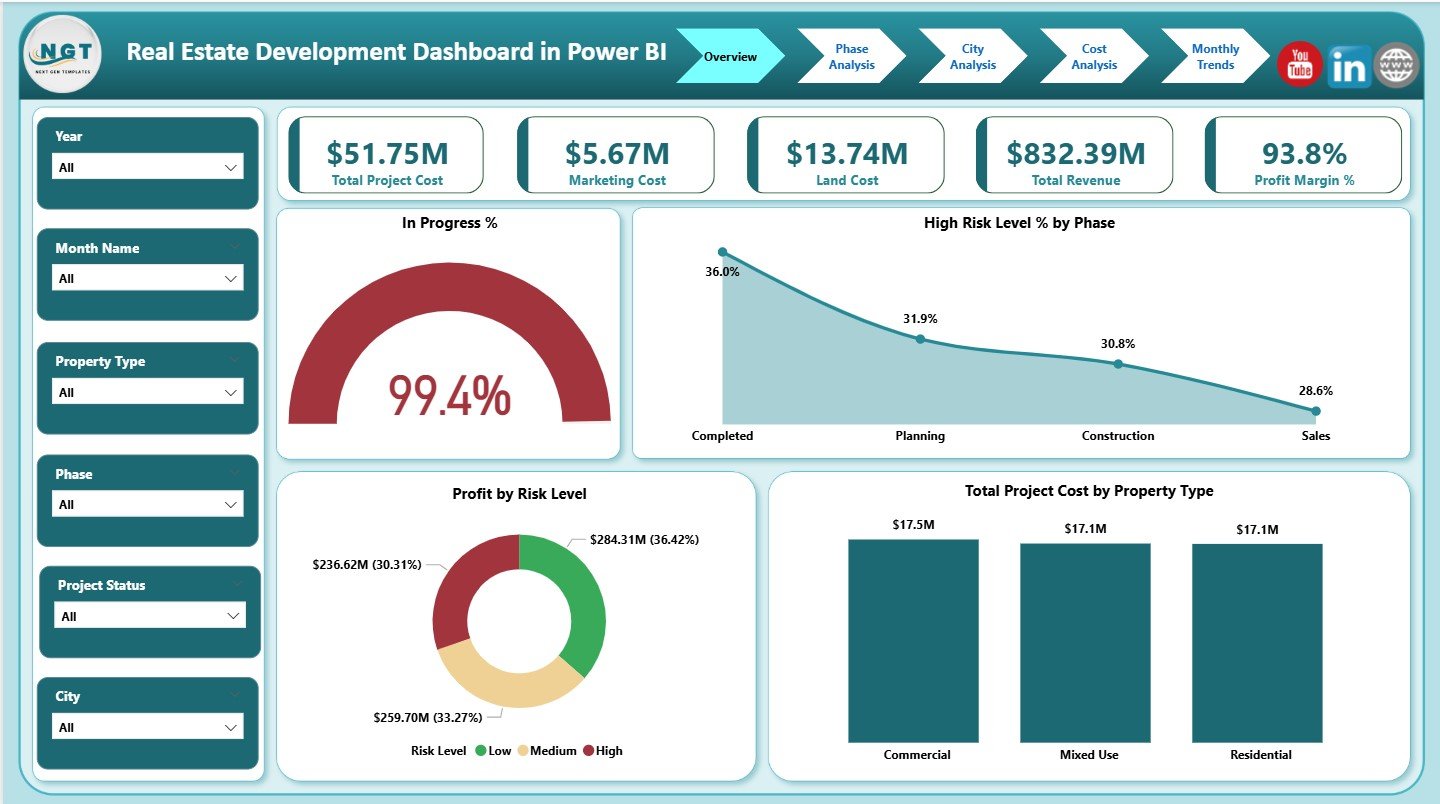
KPI Cards
Total Project Cost
Marketing Cost
Land Cost
Total Revenue
Profit Margin %
Charts
In Progress %
High Risk Level % by Phase
Profit by Risk Level
Total Project Cost by Property Type
This page gives leadership an instant view of project health.
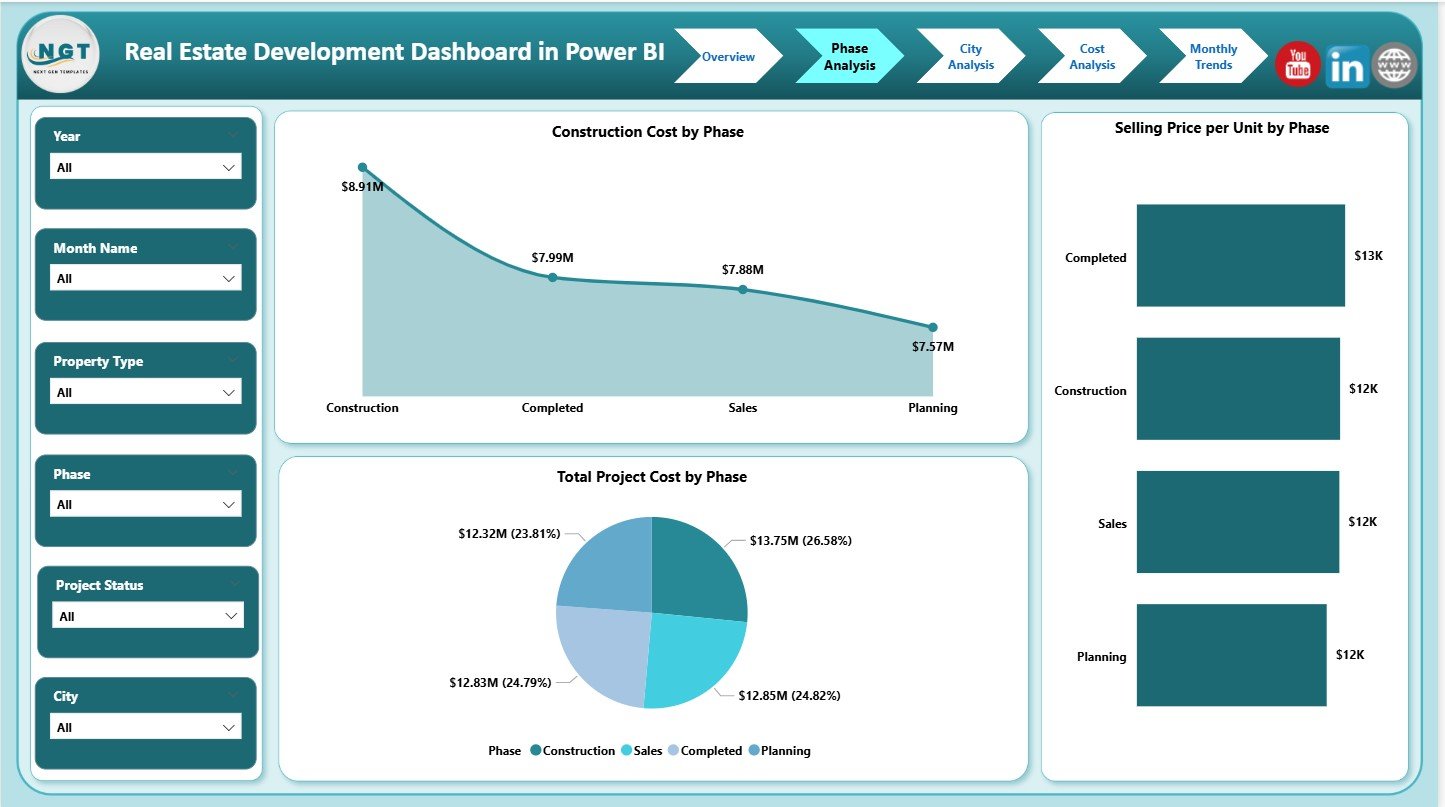
🏗️ Phase Analysis Page
Focuses on performance across development phases.
Charts
Construction Cost by Phase
Total Project Cost by Phase
Selling Price per Unit by Phase
Helps control construction costs and optimize phase-wise pricing.
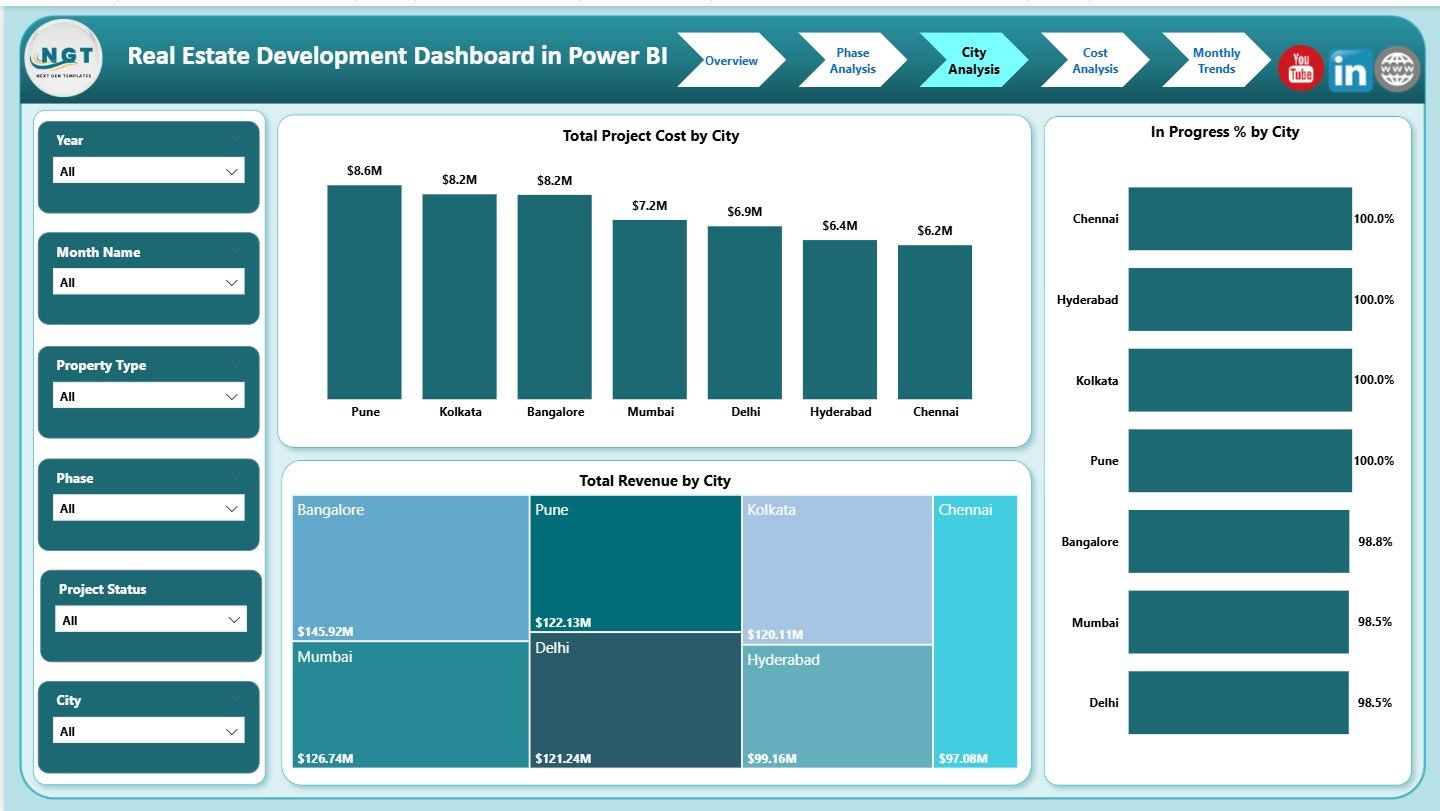
🌆 City Analysis Page
Compares real estate performance across cities.
Charts
Total Project Cost by City
Total Revenue by City
In Progress % by City
Supports location-based investment and expansion decisions.
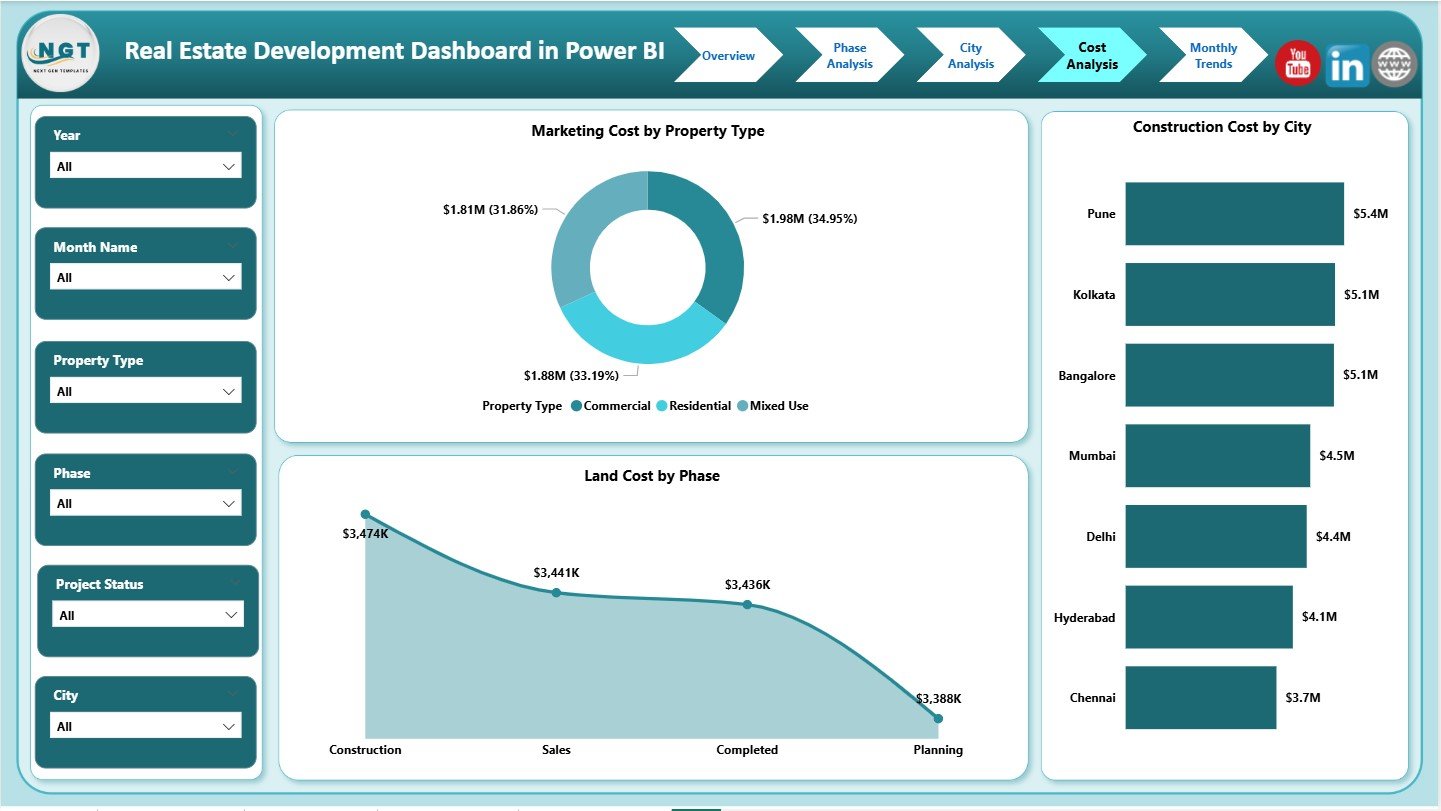
💸 Cost Analysis Page
Deep dive into cost drivers.
Charts
Marketing Cost by Property Type
Land Cost by Phase
Construction Cost by City
Reveals where money is spent and how to improve margins.
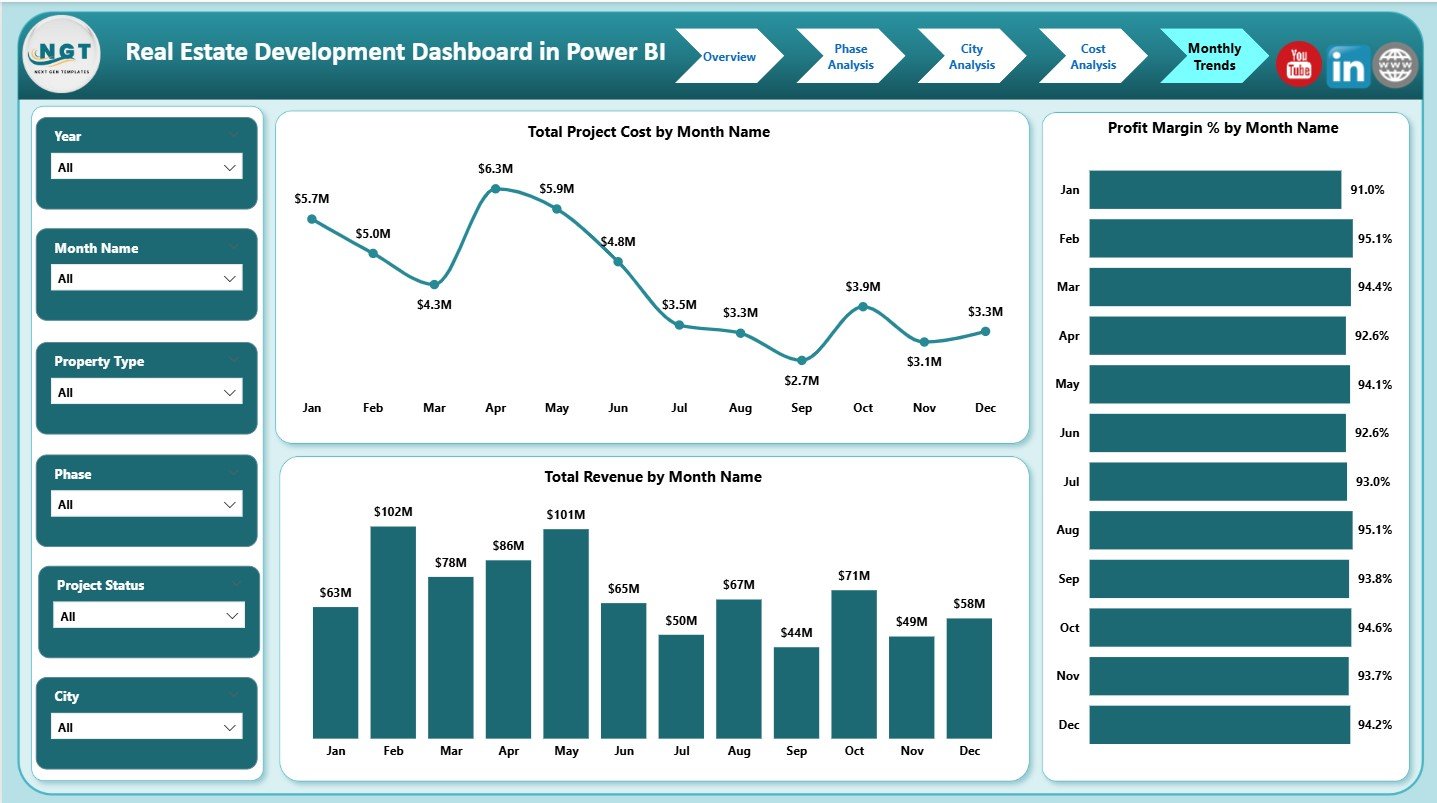
📅 Monthly Trends Page
Tracks performance over time.
Charts
Total Project Cost by Month
Total Revenue by Month
Profit Margin % by Month
Supports forecasting, budgeting, and long-term planning.
🛠️ How to Use the Real Estate Development Dashboard in Power BI
Using this dashboard is simple and efficient:
1️⃣ Load structured project data into Power BI
2️⃣ Refresh the dataset
3️⃣ Use slicers to filter by city, phase, or property type
4️⃣ Review KPI cards and charts
5️⃣ Analyze trends and risk indicators
6️⃣ Make faster, data-driven decisions
Because Power BI handles calculations and visuals automatically, reporting becomes fast, accurate, and scalable.
👥 Who Can Benefit from This Real Estate Dashboard
This dashboard is ideal for:
🏗️ Real Estate Developers
📋 Project Managers
💰 Finance & Cost Controllers
📊 Investment & Strategy Teams
🏢 Business Owners
👔 Senior Leadership
Anyone involved in real estate decision-making will gain value from this dashboard.


























Reviews
There are no reviews yet.