


Real estate development is a capital-intensive business where even small mistakes can lead to massive cost overruns and profit leakage. Developers must track land cost, construction expenses, marketing spend, revenues, project phases, cities, risk levels, and profit margins continuously. Real Estate Development Dashboard in Excel However, many real estate teams still rely on scattered Excel sheets, manual calculations, and delayed reports. As a result, critical insights often arrive too late.
That is exactly why the Real Estate Development Dashboard in Excel becomes a powerful and practical solution 🚀.
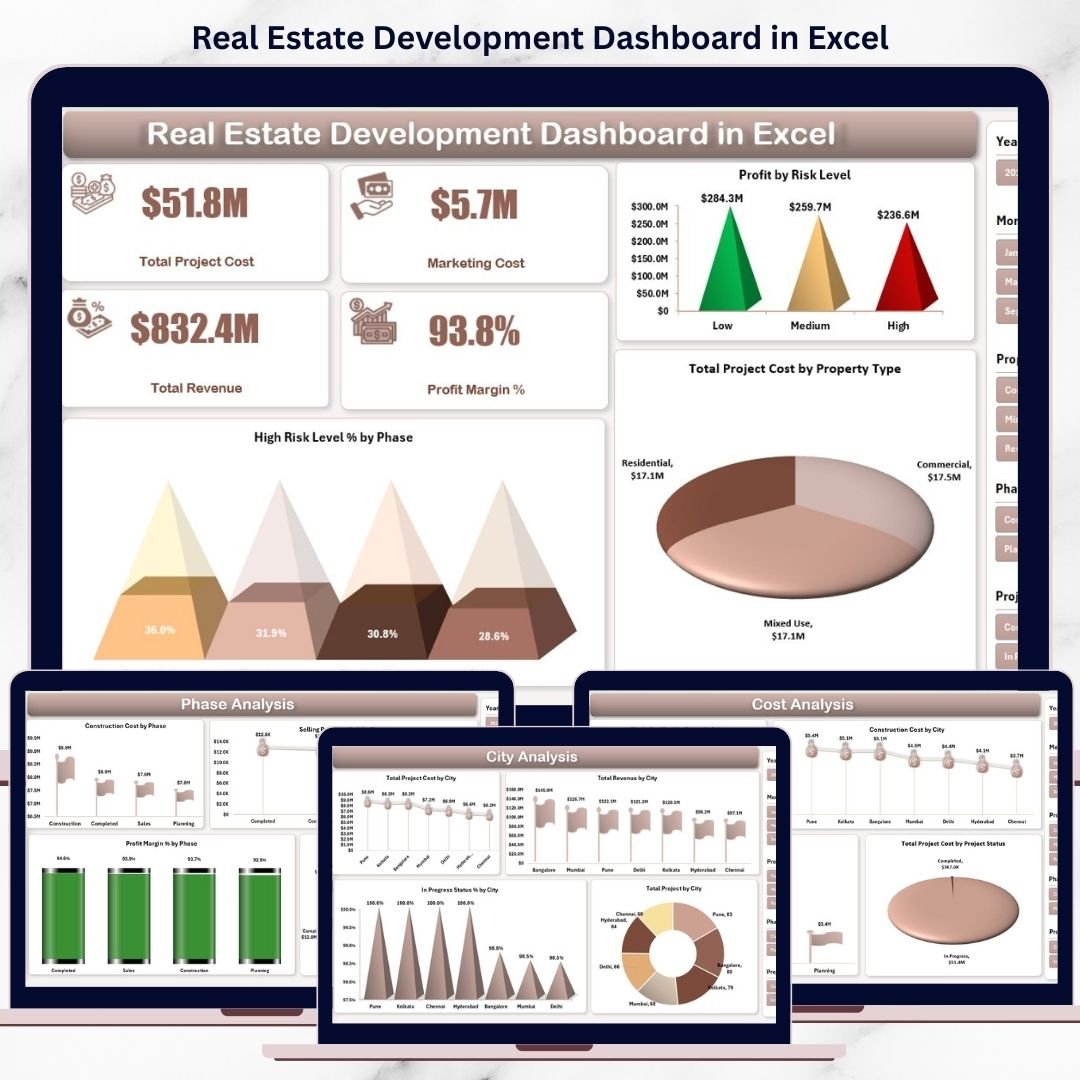
This ready-to-use Excel dashboard brings all critical real estate KPIs into one interactive and visual reporting system. Instead of managing multiple files, stakeholders can monitor project costs, revenues, risks, and profitability from a single dashboard. Moreover, the dashboard uses slicers, KPI cards, and trend charts to deliver instant clarity for developers, project managers, and investors.
Built entirely in Microsoft Excel, this dashboard remains flexible, affordable, and easy to customize—without the need for expensive BI tools or technical expertise.
⭐ Key Features of Real Estate Development Dashboard in Excel
🏗️ Centralized Project Performance Tracking
Monitor all real estate projects, phases, cities, and property types in one dashboard.
💰 Cost & Revenue Visibility
Track total project cost, construction cost, land cost, marketing cost, and total revenue clearly.
📊 Profit Margin & Risk Analysis
Identify profit drivers and high-risk projects before issues escalate.
🌍 City-Wise & Phase-Wise Analysis
Compare performance across locations and development phases.
📈 Monthly Trend Monitoring
Analyze cost, revenue, and profit trends over time.
🎛️ Interactive Excel Slicers
Filter insights instantly by city, phase, property type, risk level, and project status.
📦 What’s Inside the Real Estate Development Dashboard in Excel
This professionally designed Excel file includes five interactive dashboard pages, supported by structured data sheets.
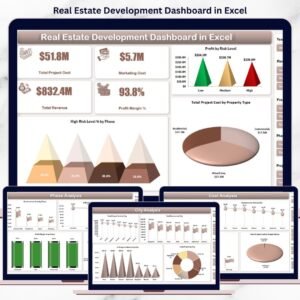
📊 Overview Page
Provides an executive-level snapshot with KPI cards:
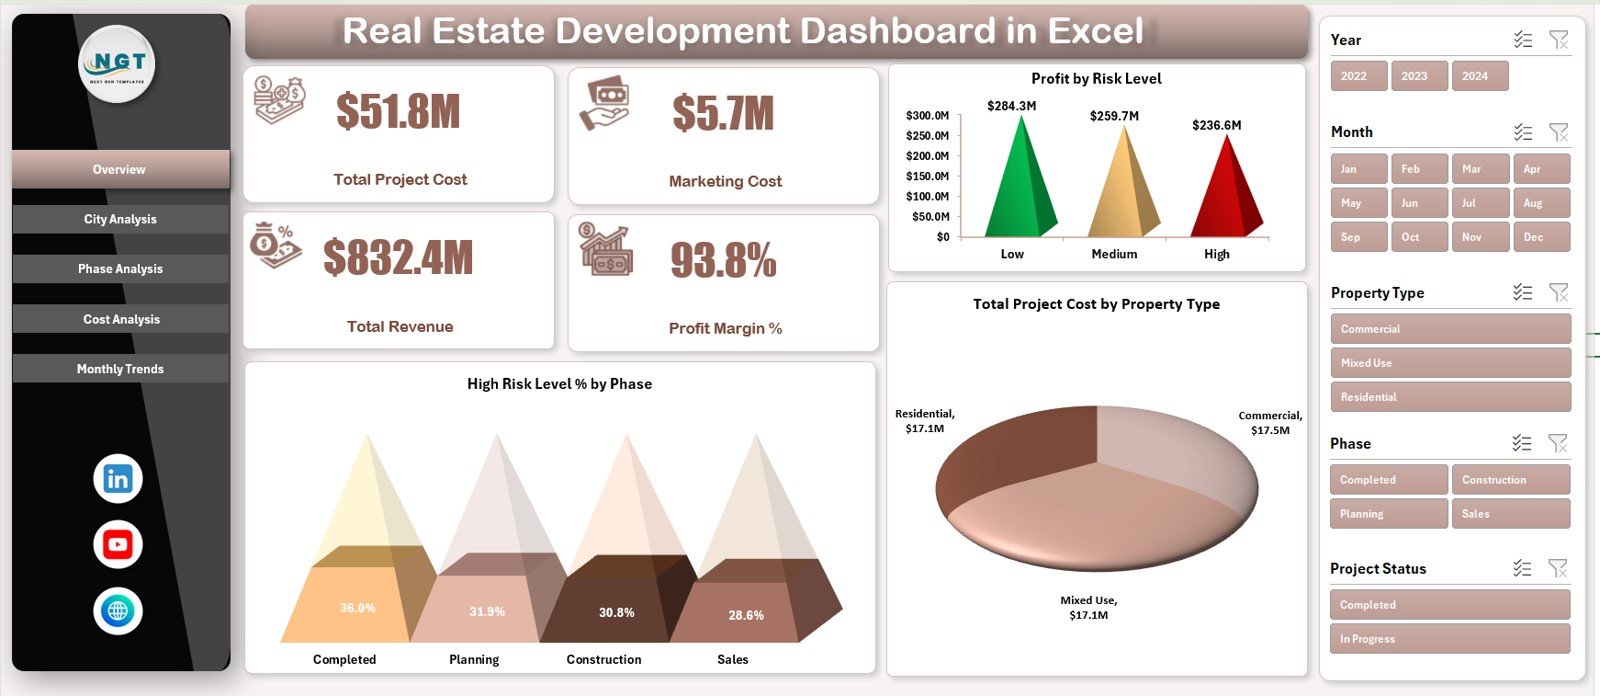
Total Project Cost
Marketing Cost
Total Revenue
Profit Margin %
Includes charts:
Profit by Risk Level
High Risk Level % by Phase
Total Project Cost by Property Type
🌆 City Analysis Page
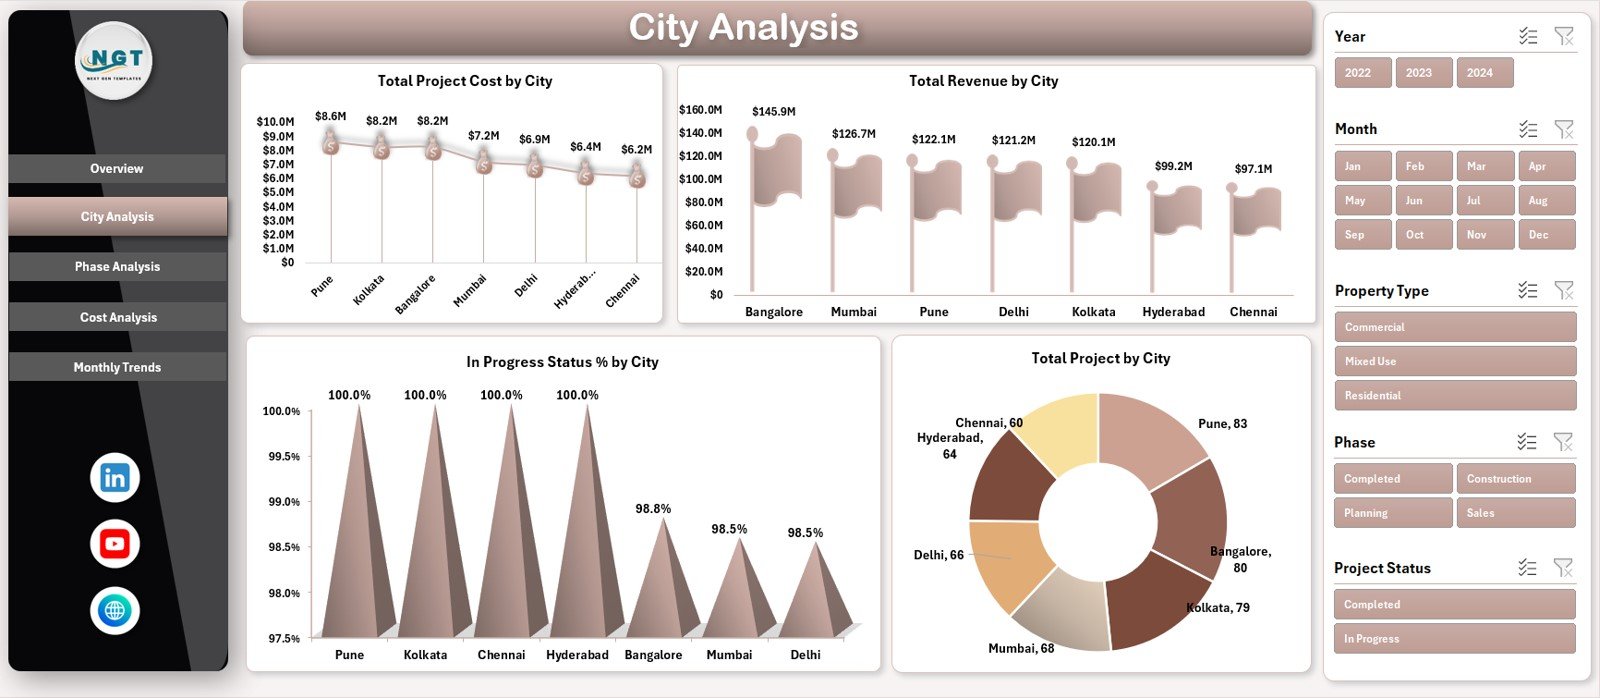
Helps evaluate location-based performance with charts for:
Total Project Cost by City
Total Revenue by City
In-Progress Status % by City
Total Projects by City
🧱 Phase Analysis Page
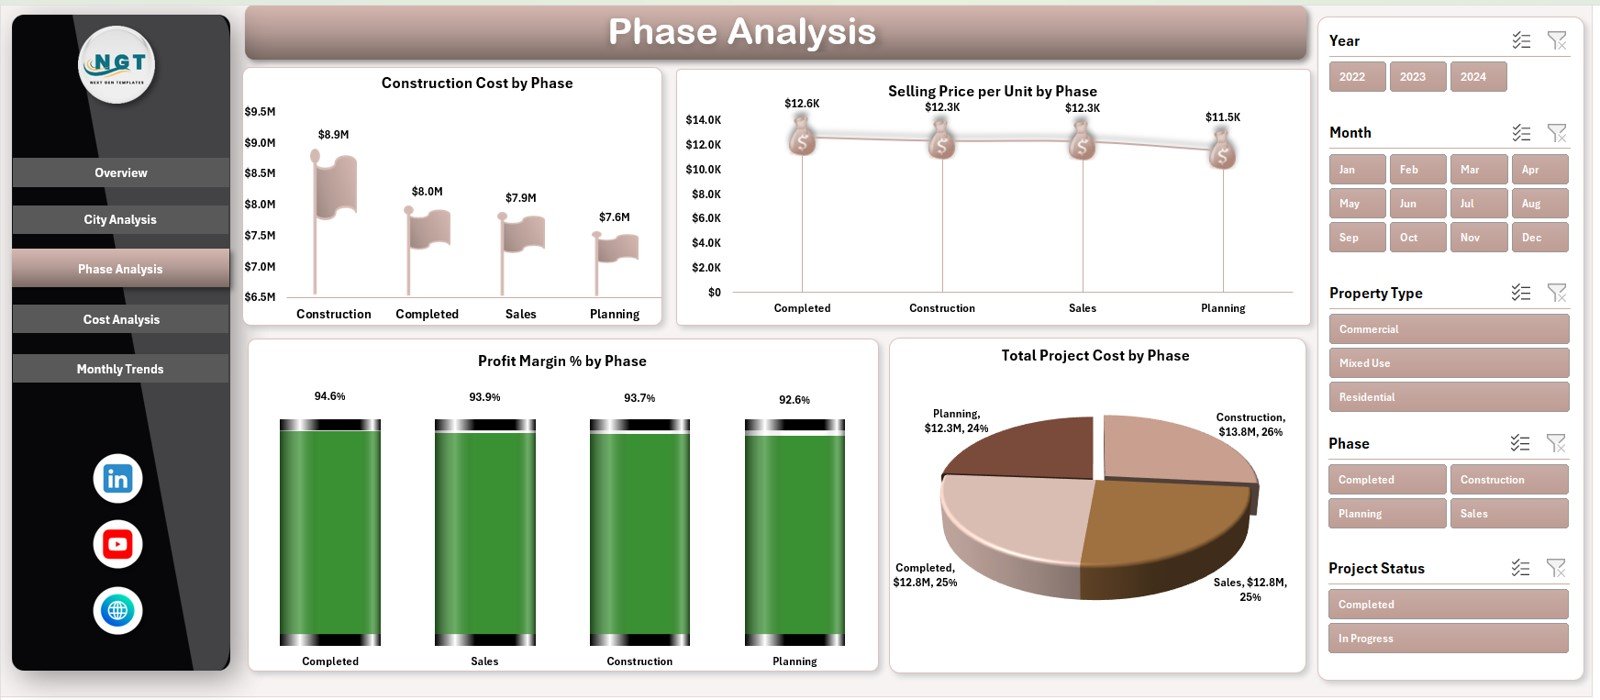
Tracks performance across development stages:
Construction Cost by Phase
Selling Price per Unit by Phase
Profit Margin % by Phase
Total Project Cost by Phase
💸 Cost Analysis Page
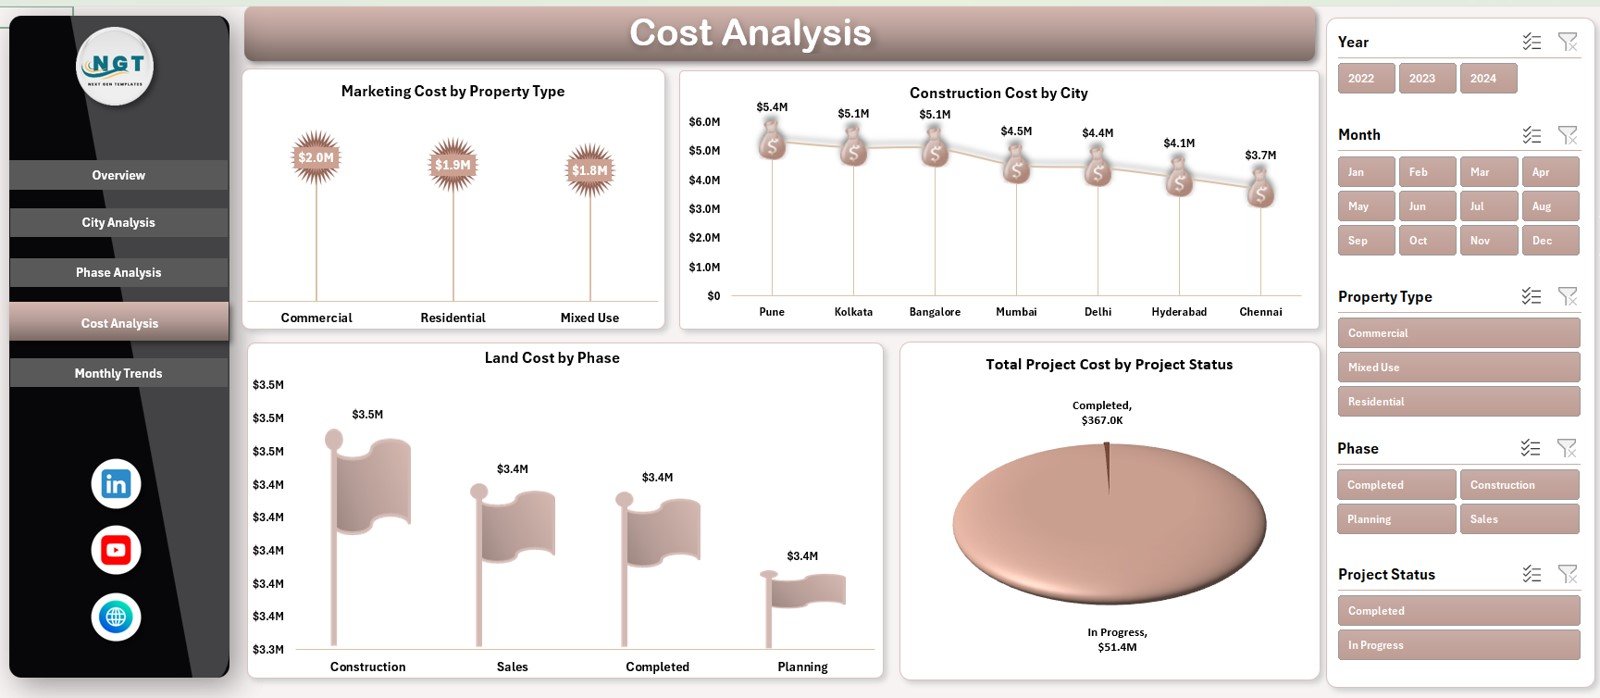
Delivers deep cost insights through:
Marketing Cost by Property Type
Construction Cost by City
Land Cost by Phase
Total Project Cost by Project Status
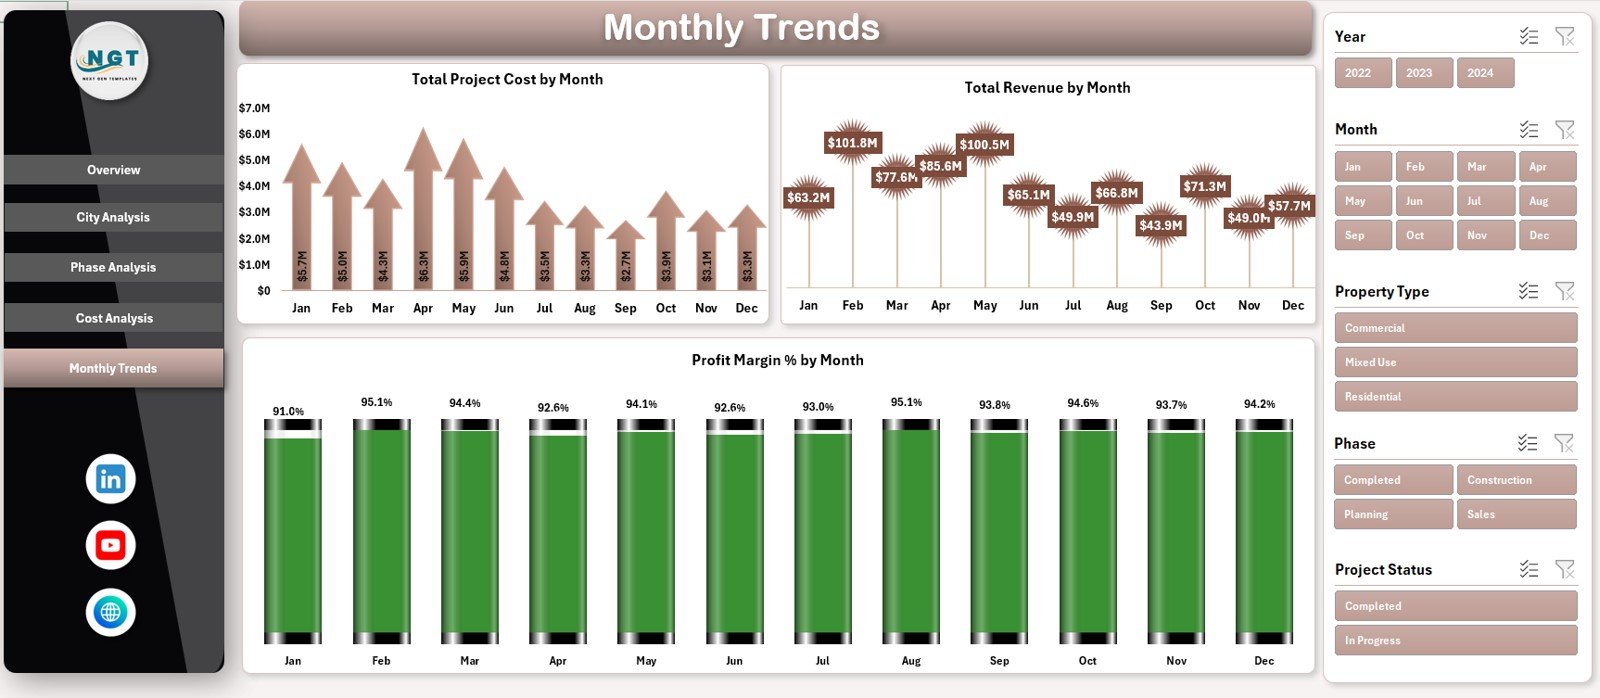
📆 Monthly Trends Page
Shows long-term financial patterns with:
Total Project Cost by Month
Total Revenue by Month
Profit Margin % by Month
A Page Navigator on the left allows smooth navigation across all pages.
🛠️ How to Use the Real Estate Development Dashboard in Excel
Using this dashboard is simple and intuitive:
1️⃣ Enter project data into the structured Data Sheet
2️⃣ Refresh pivot tables (if required)
3️⃣ Use slicers to filter by city, phase, property type, or risk level
4️⃣ Review KPI cards and charts
5️⃣ Analyze trends to support planning and investment decisions
Because calculations are automated, reporting becomes faster and error-free.
👥 Who Can Benefit from This Real Estate Development Dashboard
This dashboard is ideal for:
🏢 Real Estate Developers
📐 Project Managers
💼 Finance & Accounts Teams
📊 Investment Analysts
🏦 Investors & Business Owners
👔 Senior Management
Any organization managing real estate projects will benefit from this tool.
📖 Click here to read the Detailed blog post
▶️ Visit our YouTube channel to learn step-by-step video tutorials
Watch the step-by-step video tutorial:
Compatibility and Requirements
- Works in Microsoft Excel desktop (Excel 2016 or later, or Microsoft 365).
- You filter the pages with slicers. Microsoft explains them in Use slicers to filter data.
Frequently Asked Questions
How many pages does the dashboard have?
It has five pages: Overview, City Analysis, Phase Analysis, Cost Analysis and Monthly Trends, with a page navigator on the left.
Which KPI cards are on the Overview page?
The Overview page shows Total Project Cost, Marketing Cost, Total Revenue and Profit Margin %.
Which costs can I track?
You can track land cost, construction cost, marketing cost and total project cost.
How do I filter the data?
Use the slicers to filter by city, phase, property type, risk level and project status.
Is there a Power BI version?
Yes. The Real Estate Development Dashboard in Power BI covers the same data in Power BI.
Related Real Estate and Construction Templates
- Real Estate Development Dashboard in Power BI: the same dashboard in Power BI
- Real Estate Development Dashboard in Google Sheets: the same dashboard in Google Sheets
- Real Estate Dashboard in Excel: track property sales and listings
- Construction Dashboard in Excel: follow construction projects and costs
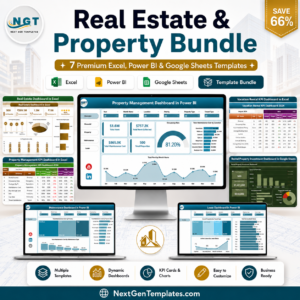
- Real Estate & Property Bundle: 7 property templates in one download
Browse all Excel dashboards.


























Reviews
There are no reviews yet.