



Managing Clinic Tender Dashboard is never simple. Healthcare organizations handle hundreds of tenders related to medical equipment, facility services, IT systems, diagnostics, and maintenance contracts. Each tender involves bid values, estimated costs, award status, timelines, and multiple clinics. However, when this information lives in scattered Excel files or manual reports, errors increase, insights disappear, and decision-making slows down.
That is exactly why the Clinic Tender Dashboard in Excel becomes a powerful, practical, and time-saving solution.
This ready-to-use Excel dashboard converts raw tender data into clear visuals, interactive insights, and management-ready KPIs. Instead of reviewing long rows of numbers, clinic administrators, procurement teams, and finance managers can instantly understand tender performance from a single Excel file. As a result, organizations gain better control, transparency, and confidence in tender management.
Because this dashboard is built entirely in Excel, you do not need any technical or coding skills. You simply update the Data Sheet, and all charts, KPIs, and analysis pages refresh automatically. Therefore, you save hours of manual reporting while improving accuracy and clarity.
🔑 Key Features of Clinic Tender Dashboard in Excel
📊 Centralized Tender Tracking – Manage all clinic tenders in one Excel file
📈 Awarded Tender Performance – Track success rate instantly
💰 Bid Value & Estimated Cost Analysis – Compare bids and costs visually
🏥 Clinic-Wise & Clinic Type Insights – Identify top and weak performers
📂 Tender Category Breakdown – Analyze equipment, IT, services, and supplies
📅 Monthly Trend Analysis – Spot seasonal tender patterns
🎛️ Easy Navigation Panel – Move across pages with one click
⚡ Fully Automated Dashboard – No manual calculations required
📂 What’s Inside the Clinic Tender Dashboard in Excel
This professionally designed dashboard contains five structured analytical pages, each answering a critical business question.
📊 Overview Page – High-level tender performance snapshot

Awarded Tender %
Bid Value by Bid Status
Estimated Cost by City
Tender Value by Tender Category
🏥 Clinic Name Analysis Page – Clinic-wise tender performance
Tender Value by Clinic Name
Estimated Cost by Clinic Name
Bid Value by Clinic Name
Awarded Tender % by Clinic Name
🏥 Clinic Type Analysis Page – Compare different clinic categories
Tender Value by Clinic Type
Estimated Cost by Clinic Type
Bid Value by Clinic Type
Awarded Tender % by Clinic Type
📂 Tender Category Analysis Page – Category-wise insights
Estimated Cost by Tender Category
Bid Value by Tender Category
Awarded Tenders by Tender Category
Total Tenders by Tender Category
📅 Month Analysis Page – Time-based tender trends
Tender Value by Month
Estimated Cost by Month
Bid Value by Month
Each page includes clear visuals and structured insights for fast decision-making.
▶️ How to Use the Clinic Tender Dashboard in Excel
1️⃣ Enter tender data into the Data Sheet
2️⃣ Let Excel automatically process KPIs and charts
3️⃣ Use the Page Navigator to switch analysis views
4️⃣ Review awarded %, costs, and bid performance
5️⃣ Use insights to improve tender strategy and planning
No advanced Excel knowledge is required.
👥 Who Can Benefit from This Clinic Tender Dashboard in Excel
This dashboard is ideal for:
🏥 Clinic & Hospital Administrators
📑 Procurement & Tender Management Teams
💰 Finance & Budget Planning Teams
📊 Healthcare Consultants
🏢 Multi-clinic Healthcare Organizations
### 👉 Click here to read the Detailed Blog Post
Visit our YouTube channel to learn step-by-step video tutorials.
Watch the step-by-step video tutorial:
Compatibility and Requirements
- Works in Microsoft Excel desktop (Excel 2016 or later, or Microsoft 365).
- You enter tender data on the Data Sheet, and the charts and KPIs on the five analysis pages refresh from it. Microsoft explains how to build and read charts in Create a chart from start to finish.
Frequently Asked Questions
Which pages does the dashboard include?
Five pages: Overview, Clinic Name Analysis, Clinic Type Analysis, Tender Category Analysis and Month Analysis.
Where do I enter my tender data?
Enter it on the Data Sheet. The KPIs and charts on the analysis pages update from that sheet, so you do not calculate anything by hand.
Can I see how many tenders were awarded?
Yes. The Overview page shows Awarded Tender %, and the Clinic Name, Clinic Type and Tender Category pages show awarded tender results for each group.
Can I compare bid value with estimated cost?
Yes. Bid Value and Estimated Cost are shown by clinic name, clinic type, tender category and month, so you can compare them side by side.
Is there a Power BI version?
Yes. See the Clinic Tender Dashboard in Power BI.
Related Clinic Tender and Clinic Templates
- Clinic Tender Dashboard in Power BI: the same tender analysis in Power BI
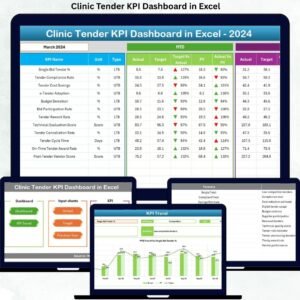
- Clinic Tender KPI Dashboard in Excel: a KPI view of clinic tenders
- Clinic Dashboard in Excel: an Excel dashboard for clinic performance
- Clinics KPI Dashboard in Excel: KPIs across clinics
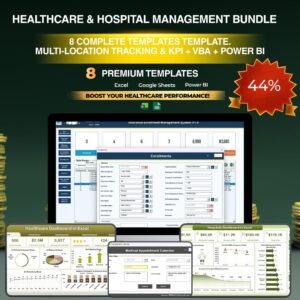
- Healthcare & Hospital Management Bundle: 8 healthcare templates in one download
Browse all Excel dashboards.























Reviews
There are no reviews yet.