

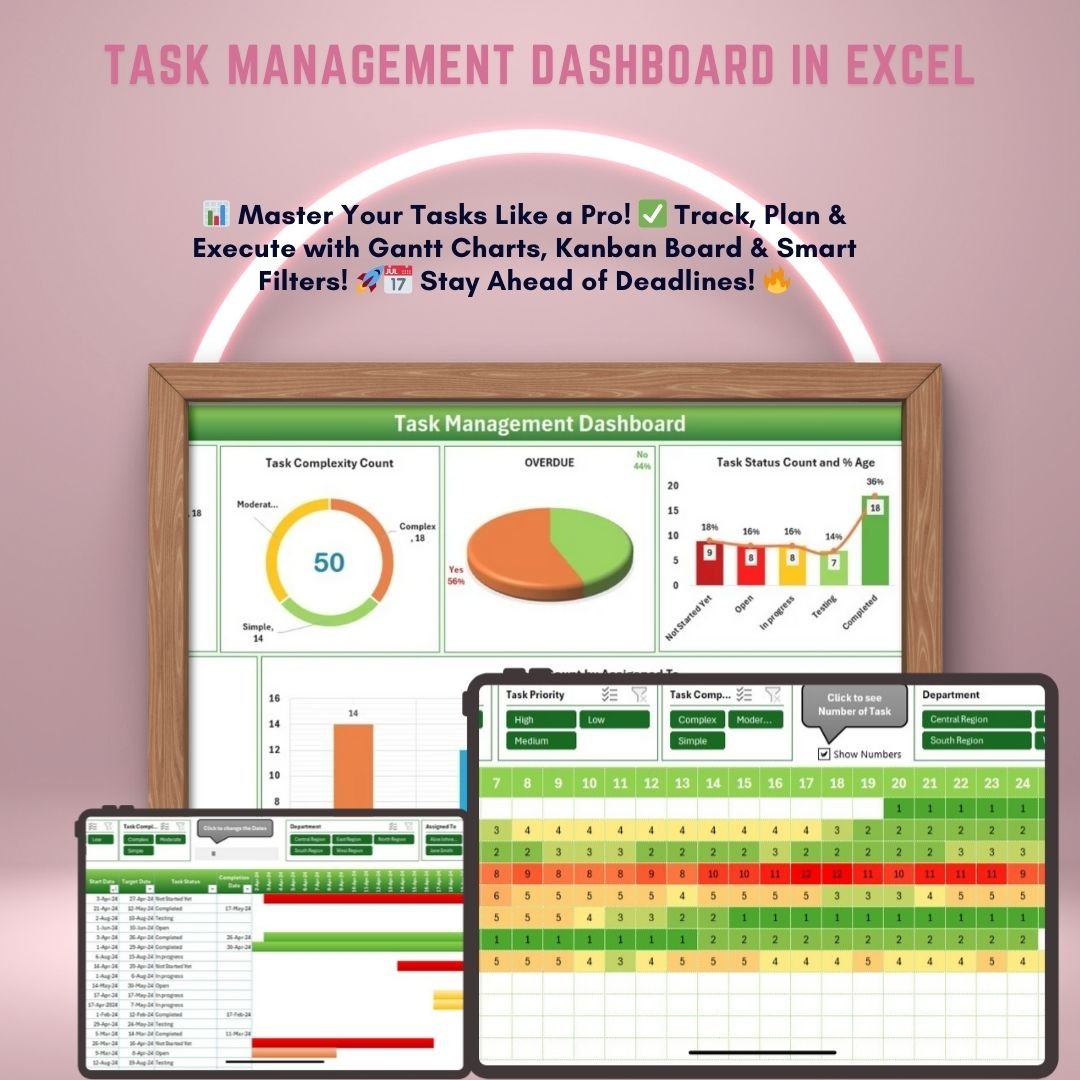


The Task Management Dashboard in Excel is a ready-made, interactive Excel file for tracking tasks, deadlines, priorities and statuses in one place. It suits individuals, team leads and managers in project management, business operations or team collaboration. You get a clear, automated view of every task without complicated software and without VBA.
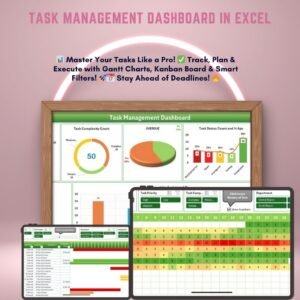
The template includes a summary dashboard, a Gantt chart, a Kanban board, an annual heatmap and slicers. Together they show progress, overdue work and how the workload is spread across departments and team members.
Key Features of the Task Management Dashboard
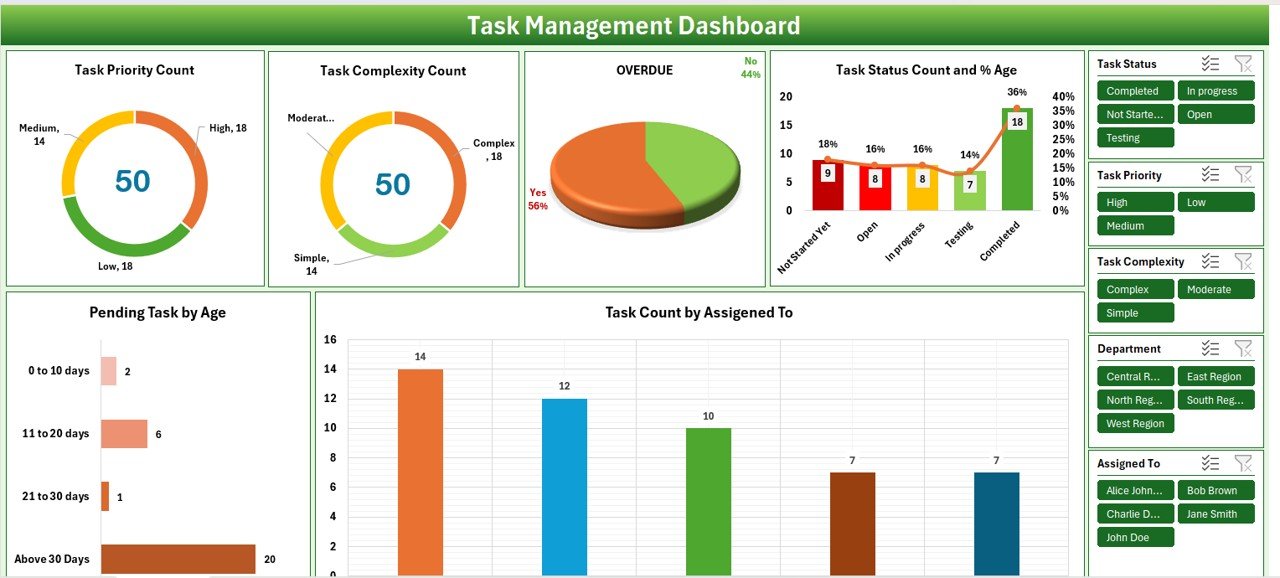
- Visual summary with interactive charts: Automated charts and slicers show task priorities, complexities, statuses and overdue assignments at a glance.
- Gantt chart scheduling: The built-in Gantt chart shows task progress across timelines, so you can meet deadlines and avoid overlaps or delays.
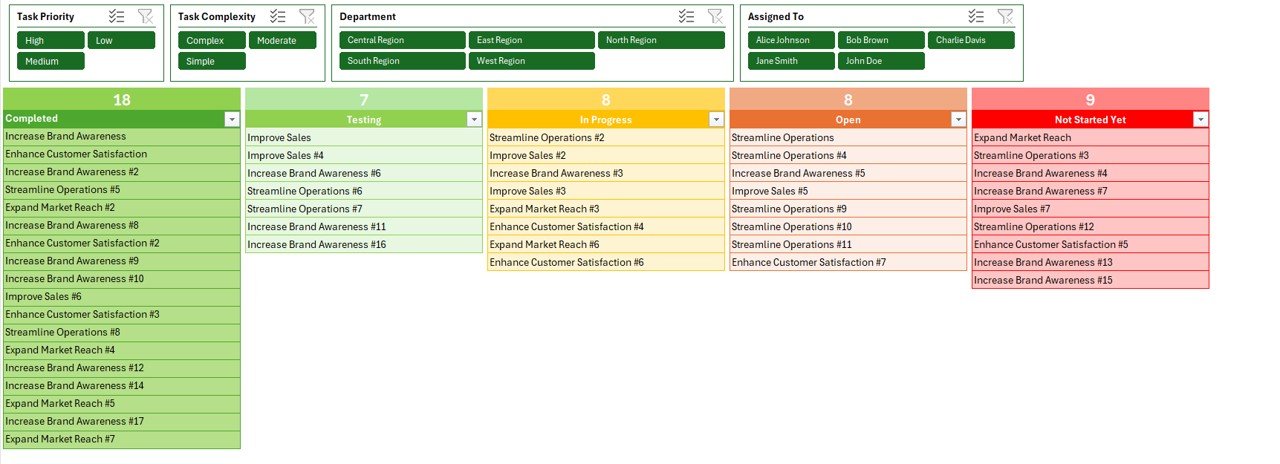
- Kanban board for workflow visualization: Follow tasks through four statuses on a Kanban-style board: Not Started, In Progress, Testing and Completed.
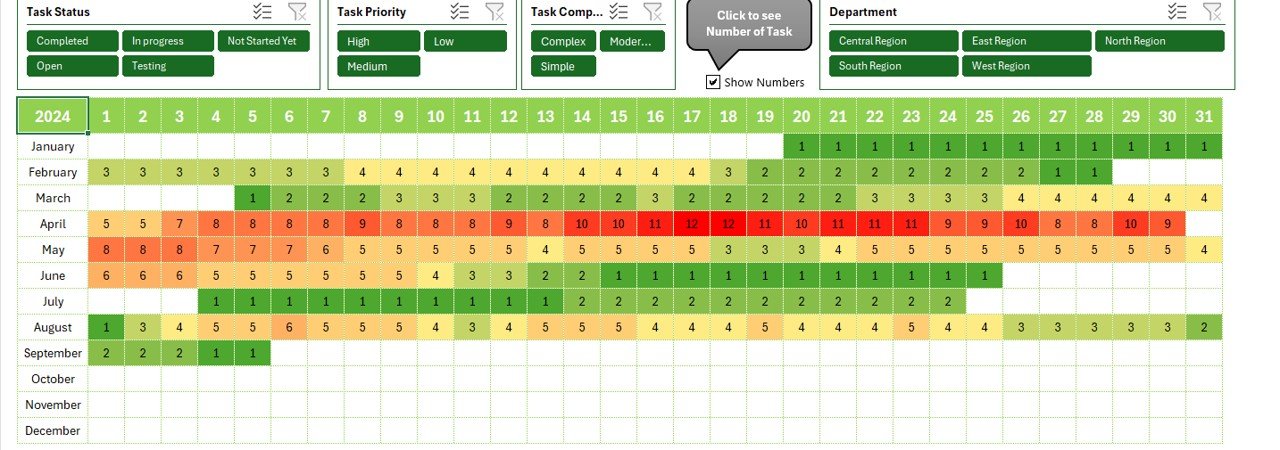
- Annual heatmap for task distribution: A color-coded annual heatmap shows workload trends across the whole year. It makes peak workload periods easy to spot so you can plan resources.
- Customizable slicers for smart filtering: Filter tasks by priority, complexity, department, assigned personnel or task status for a focused analysis.
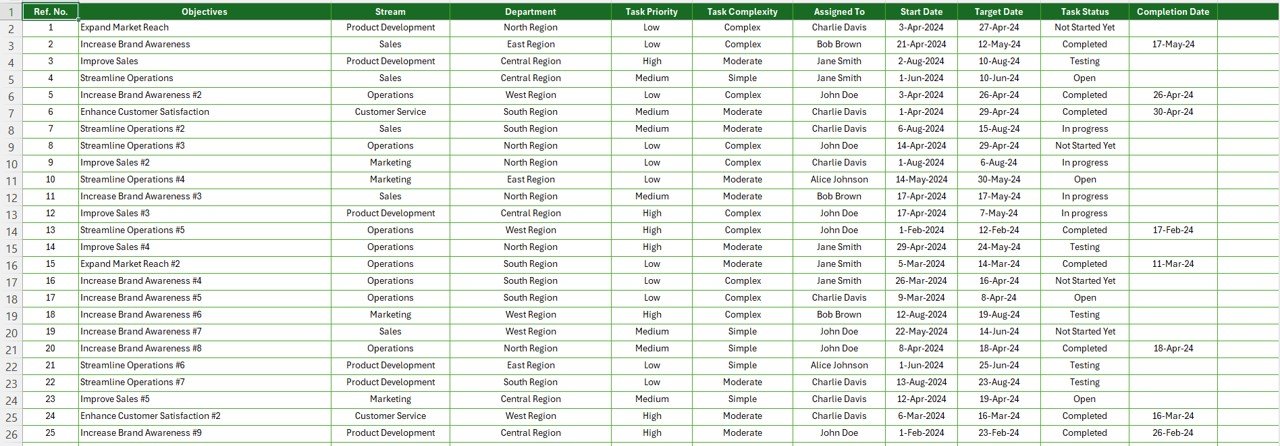
- Comprehensive data entry system: A structured Input Data sheet lets you add, edit and manage task details with just a few clicks.
- Overdue task alerts: Overdue task indicators highlight tasks that need immediate attention.
- Automated priority and complexity tracking: Tasks are automatically grouped by priority level (Low, Medium, High) and complexity (Simple, Moderate, Complex) to make workload planning easier.
- Department-wise and assigned-to analysis: See how tasks are spread across departments and team members, which supports accountability and delegation.
- No VBA required: The file is fully formula-driven and automated, so it is easy to use, modify and customize.
What’s Inside the Excel Task Tracker
| Component | What It Does |
|---|---|
| Summary Dashboard | Interactive charts and slicers for task status, priority, complexity and overdue assignments |
| Gantt Chart | Timeline view of tasks for scheduling and deadline management |
| Kanban Board | Kanban-style board showing tasks as Not Started, In Progress, Testing or Completed |
| Annual Heatmap | Color-coded view of task workload across the entire year |
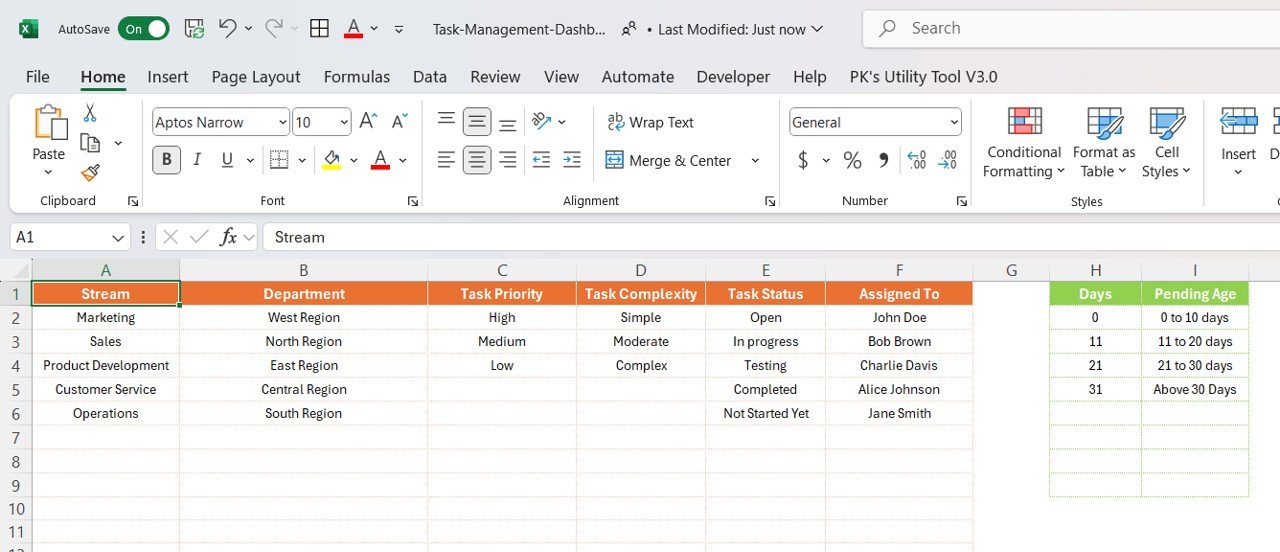
| Input Data Sheet | Structured sheet for adding, editing and managing task details |
How This Dashboard Improves Productivity
- Saves time: Tracks tasks automatically, so there are no manual calculations.
- Improves accountability: Every assigned task has a clear status and deadline.
- Supports better decisions: Gives real-time insights into task completion trends.
- Reduces workload stress: Visual dashboards make overdue and pending tasks easy to follow.
- Helps team collaboration: Clearly defines tasks, responsibilities and progress.
Who It’s For
- Project managers who handle several projects and deadlines at once
- Team leads who need to see workload distribution and assign tasks fairly
- Business operations teams who track tasks by department
- Individuals who want a structured way to manage daily work tasks
- Anyone who prefers a simple Excel task tracker to complicated software
How to Use It
- Download and open the file in Excel. No installation is required.
- Enter your tasks in the Input Data sheet with priority, complexity, department, assignee, status and dates.
- Review the summary dashboard and use the slicers to filter by priority, complexity, department, assigned personnel or status.
- Plan your timeline with the Gantt chart and follow workflow progress on the Kanban board.
- Check the annual heatmap to spot peak workload periods, and watch the overdue task indicators to stay ahead of deadlines.
- Customize the template to suit your organization’s needs.
Instant Download and Easy Setup
- No installation required: Just open it in Excel and start managing tasks right away.
- Fully customizable: Modify it to suit your organization’s needs.
- Lifetime access: No recurring fees or subscriptions.
Tutorials and Resources
Click here to read the detailed blog post.
Visit our YouTube channel for step-by-step video tutorials: Youtube.com/@PKAnExcelExpert
Watch the step-by-step video tutorial:
Frequently Asked Questions
Does the Task Management Dashboard in Excel require VBA or macros?
No. The dashboard is fully formula-driven and automated, so no VBA is required. This makes it easy to use, modify and customize.
Which task statuses does the Kanban board show?
The Kanban board tracks tasks across four statuses: Not Started, In Progress, Testing and Completed.
How can I filter tasks in the dashboard?
Customizable slicers let you filter tasks by priority, complexity, department, assigned personnel or task status.
Does it show overdue tasks?
Yes. Overdue task indicators highlight tasks that have missed their deadlines and need immediate attention.
What does the annual heatmap show?
The annual heatmap is a color-coded view of task workload across the year. It helps you spot peak workload periods and manage resources.
Is there a subscription fee?
No. You get an instant download with lifetime access and no recurring fees or subscriptions.
Also check our Download Attachments from Multiple Emails Automatically using VBA
Last updated: October 2026
Compatibility and Requirements
- Works in Microsoft Excel desktop (Excel 2016 or later, or Microsoft 365).
- The file is formula-driven with no VBA, so there are no macros to enable.
- Microsoft explains slicers in Use slicers to filter data.
Related Task and Project Templates
- Task Management Tracker in Google Sheets: a task tracker for Google Sheets
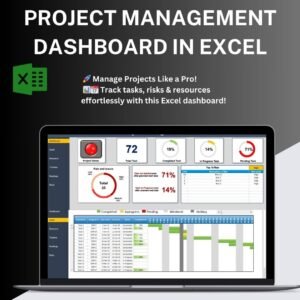
- Project Management Dashboard in Excel: Gantt, workload and risk views for projects
- Fully Functional To-do List in Excel: a simpler list for daily tasks
- To-do List for Multiple Projects with Summary: group tasks by project
- Project Management Pro Bundle: 9 project templates in one download
Browse all Excel dashboards or the Excel project management templates.


























Reviews
There are no reviews yet.