



Private Clubs Dashboard in Excel
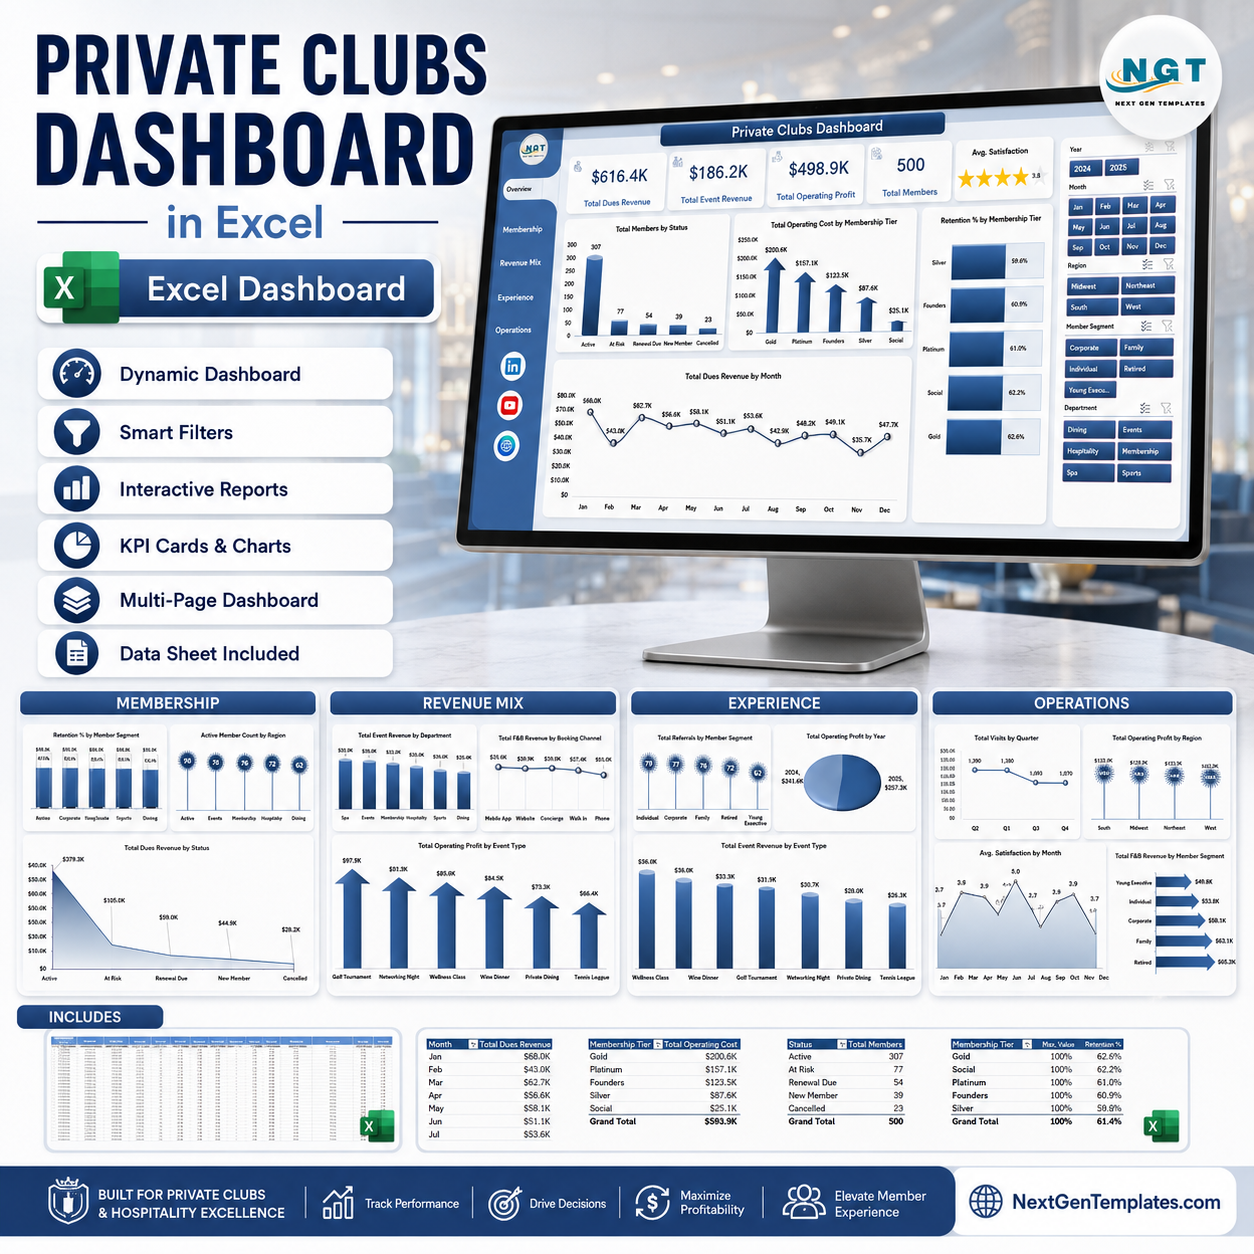
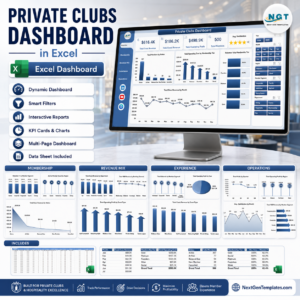
The Private Clubs Dashboard in Excel is a ready-to-use dashboard template for tracking club membership, dues revenue, event revenue, food and beverage revenue, operating costs, member satisfaction, referrals, visits, and profitability. It is designed for private clubs, country clubs, social clubs, recreational clubs, membership-based venues, and club operations teams that need a clear Excel reporting system without building everything from scratch.
This Excel dashboard includes multiple analysis pages, slicers, charts, a structured data sheet, and a support sheet with pivot tables. Replace the sample data in the Data sheet, refresh the workbook, and the dashboard pages update dynamically.
Overview Page
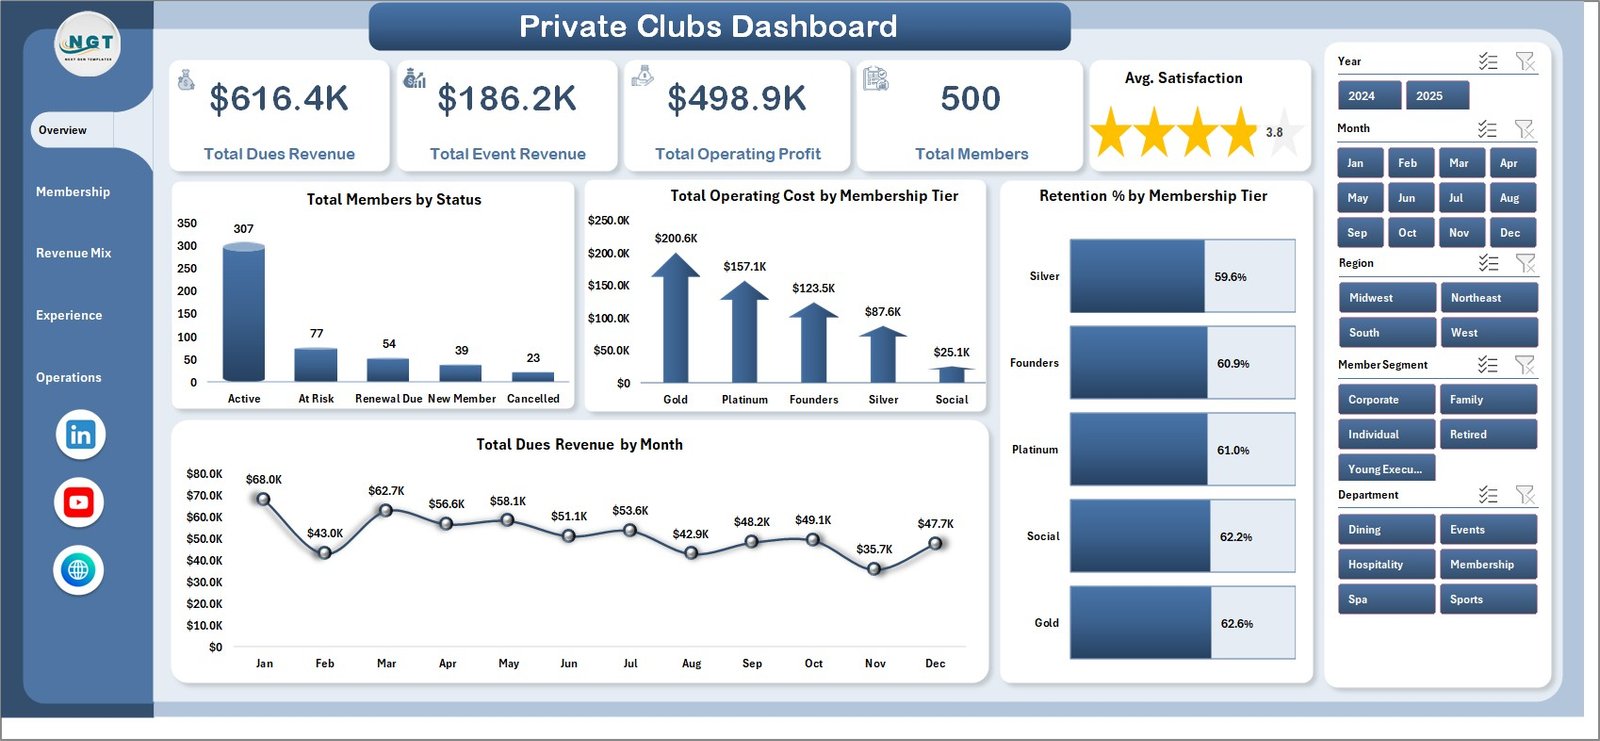
The Overview page gives a high-level view of club performance using KPI cards, charts, and slicers. It helps management quickly review financial health, membership volume, and satisfaction trends in one place.
Overview KPI Cards
- Total Dues Revenue: Shows the total revenue generated from member dues, helping you understand the recurring membership income base.
- Total Event Revenue: Summarizes income from club events, making it easier to monitor event-driven revenue performance.
- Total Operating Profit: Displays profit after operating costs, giving a quick view of overall financial performance.
- Total Members: Shows the total member count so teams can track overall club participation and growth.
- Avg. Satisfaction: Highlights the average satisfaction score to monitor member experience and service quality.
Overview Charts
- Total Members by Status: Breaks down members by active, inactive, pending, or other status groups. This helps identify membership retention and reactivation opportunities.
- Total Operating Cost by Membership Tier: Compares operating cost across tiers such as standard, premium, or VIP memberships. It helps spot which membership levels drive higher service or operational expense.
- Retention % by Membership Tier: Shows how well each membership tier retains members over time. This helps management identify tiers that need stronger engagement or renewal strategies.
- Total Dues Revenue by Month: Tracks dues revenue month by month. It helps reveal seasonality, growth patterns, and changes in recurring revenue.
Membership Page
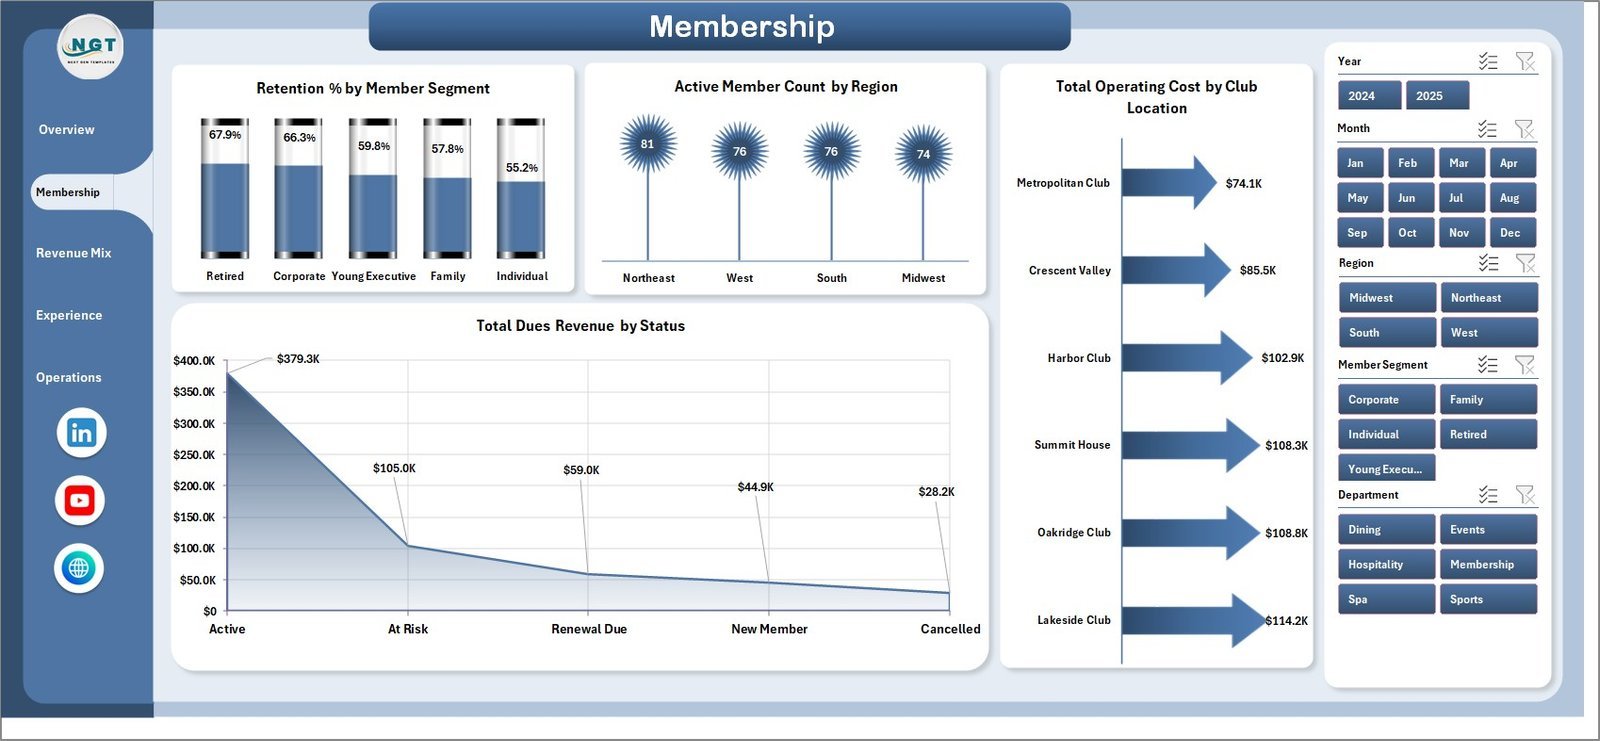
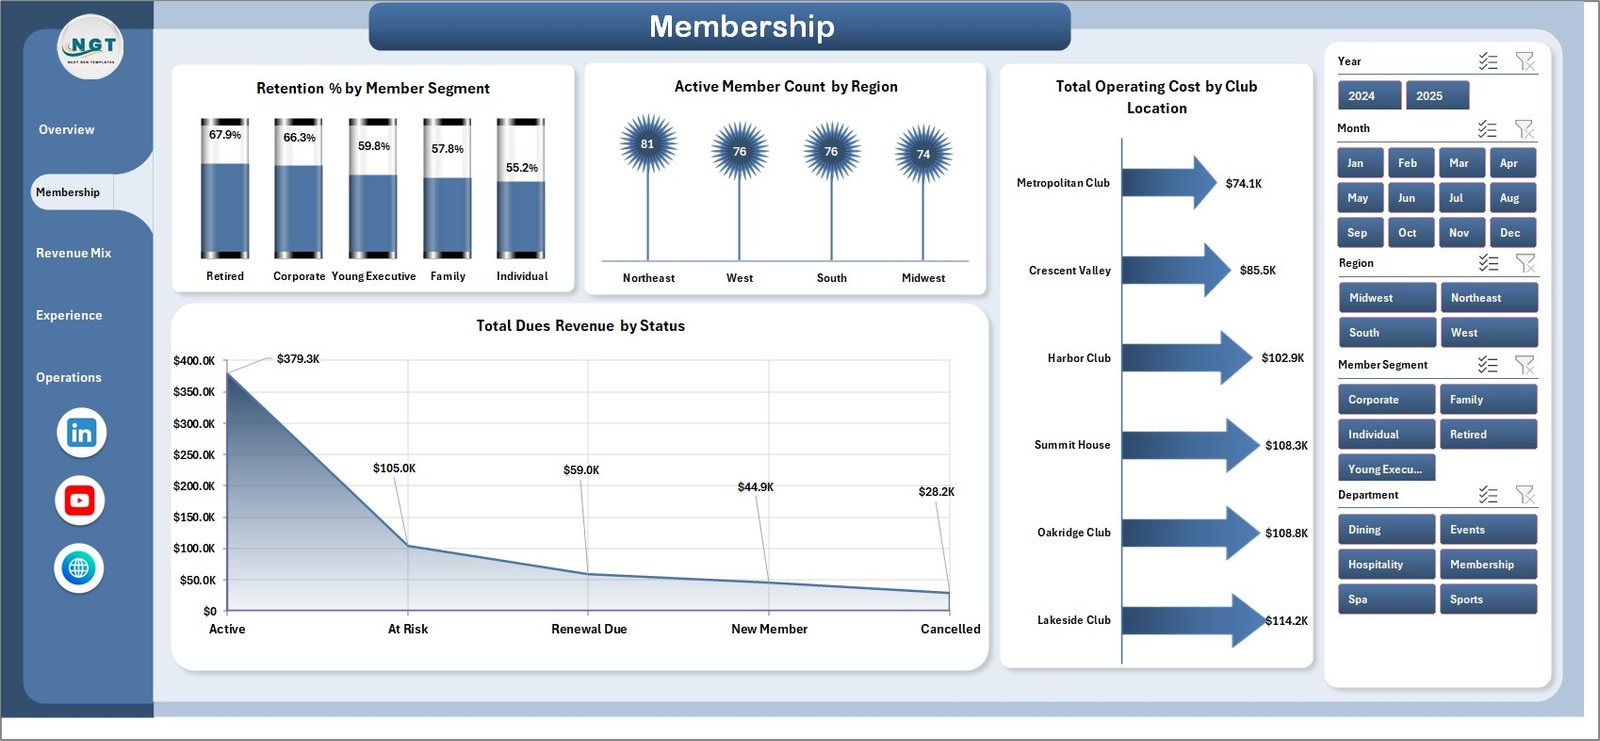
The Membership page focuses on member composition, retention, regional distribution, operating costs, and dues revenue status. It is useful for understanding who your members are and where membership performance can improve.
- Retention % by Member Segment: Compares retention across different member segments. This helps identify the member groups that are most loyal and the groups that need additional attention.
- Active Member Count by Region: Shows where active members are located. It helps clubs understand regional participation and plan location-specific engagement efforts.
- Total Operating Cost by Club Location: Compares operating costs across club locations. This makes it easier to find locations with higher cost pressure.
- Total Dues Revenue by Status: Breaks dues revenue down by membership status. It helps show how much revenue comes from active or other status groups.
Revenue Mix Page
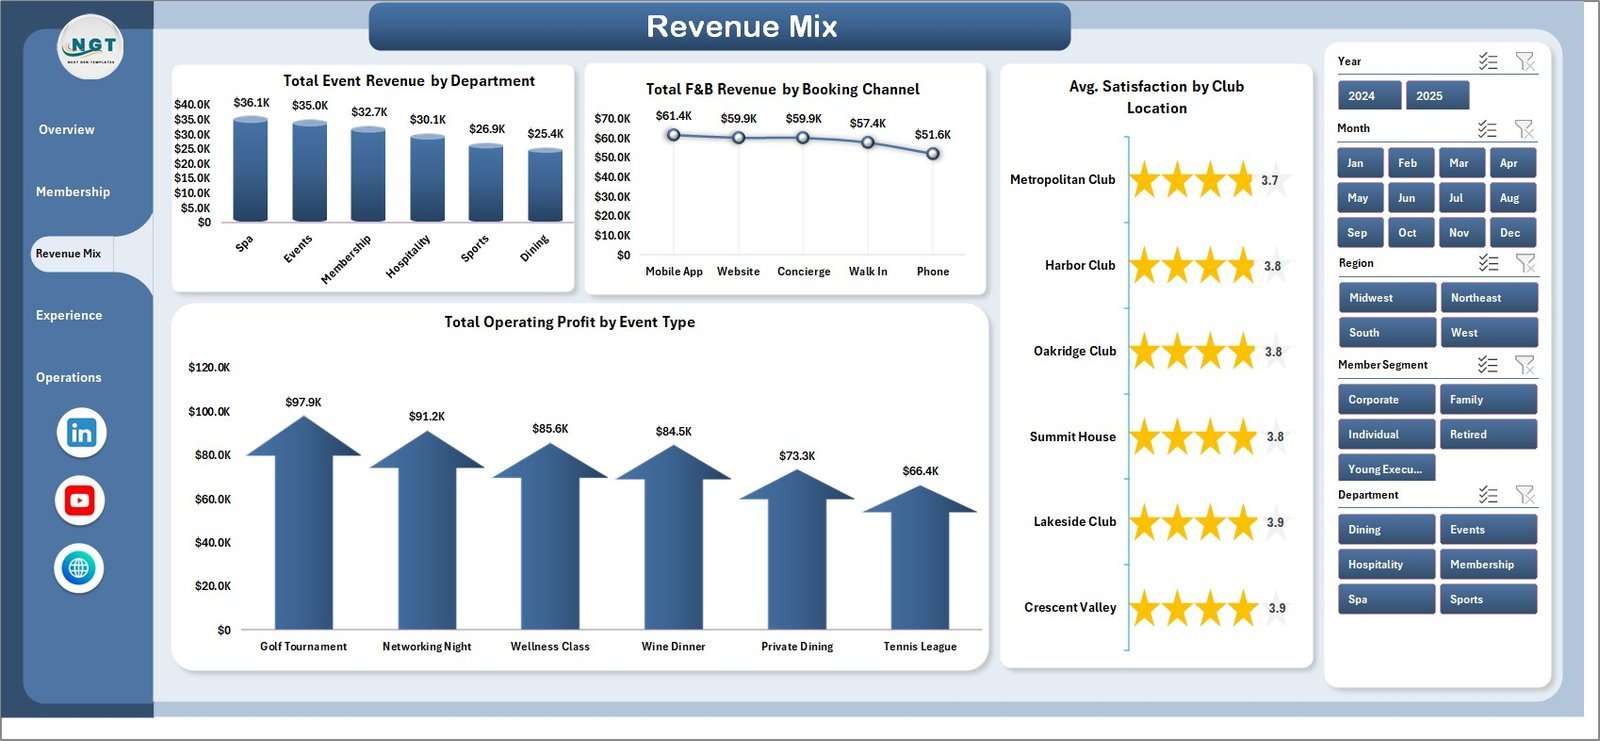
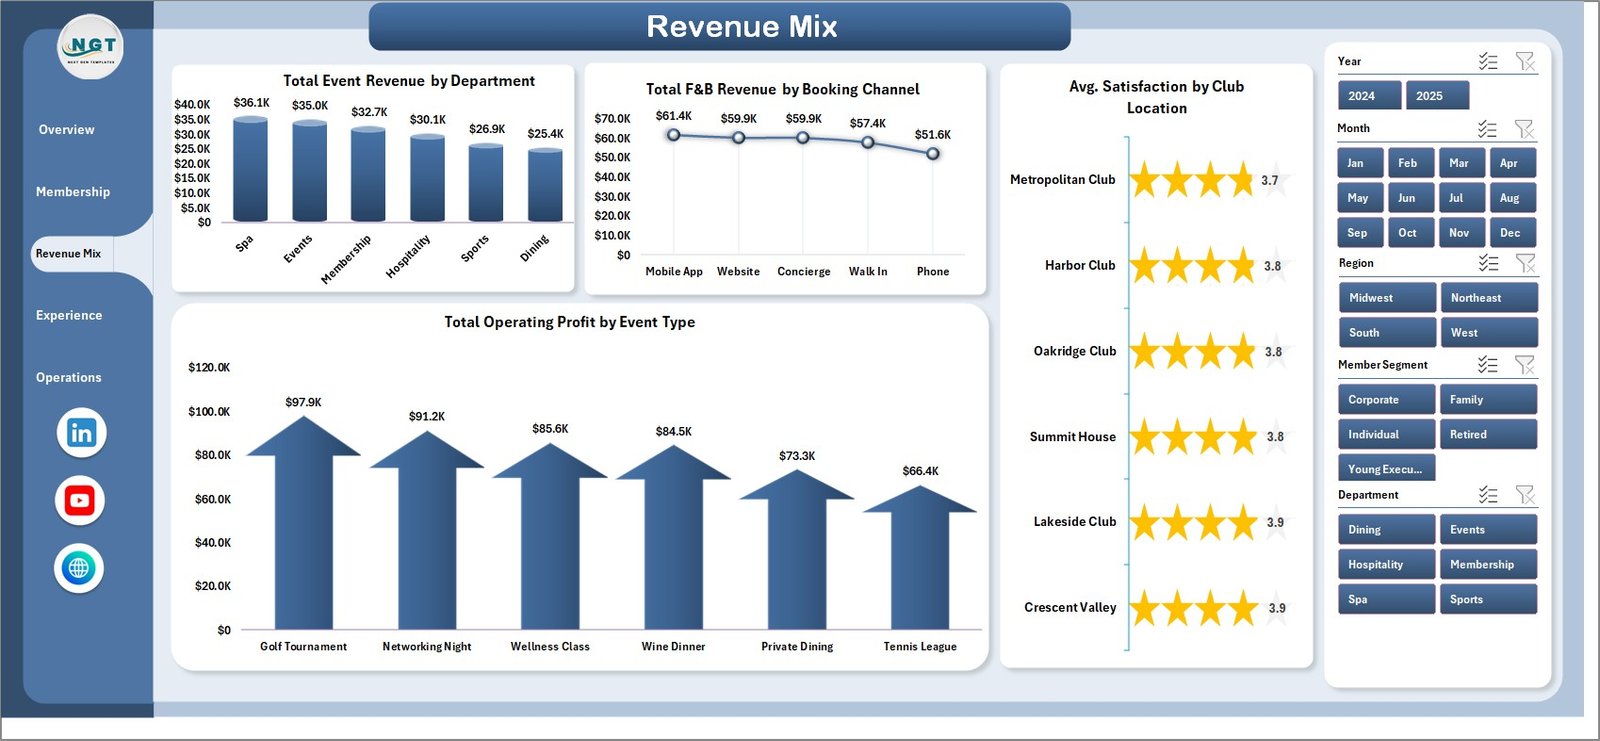
The Revenue Mix page analyzes how different departments, booking channels, locations, and event types contribute to revenue and profit. It gives a broader view of how the club earns money beyond dues.
- Total Event Revenue by Department: Shows event revenue generated by each department. This helps identify the departments that contribute most to event income.
- Total F&B Revenue by Booking Channel: Compares food and beverage revenue across booking channels. It helps reveal which booking sources drive the strongest F&B performance.
- Avg. Satisfaction by Club Location: Compares satisfaction scores by location. This helps management find locations with stronger or weaker member experience.
- Total Operating Profit by Event Type: Shows profitability by event type. It helps determine which types of events are most valuable for the club.
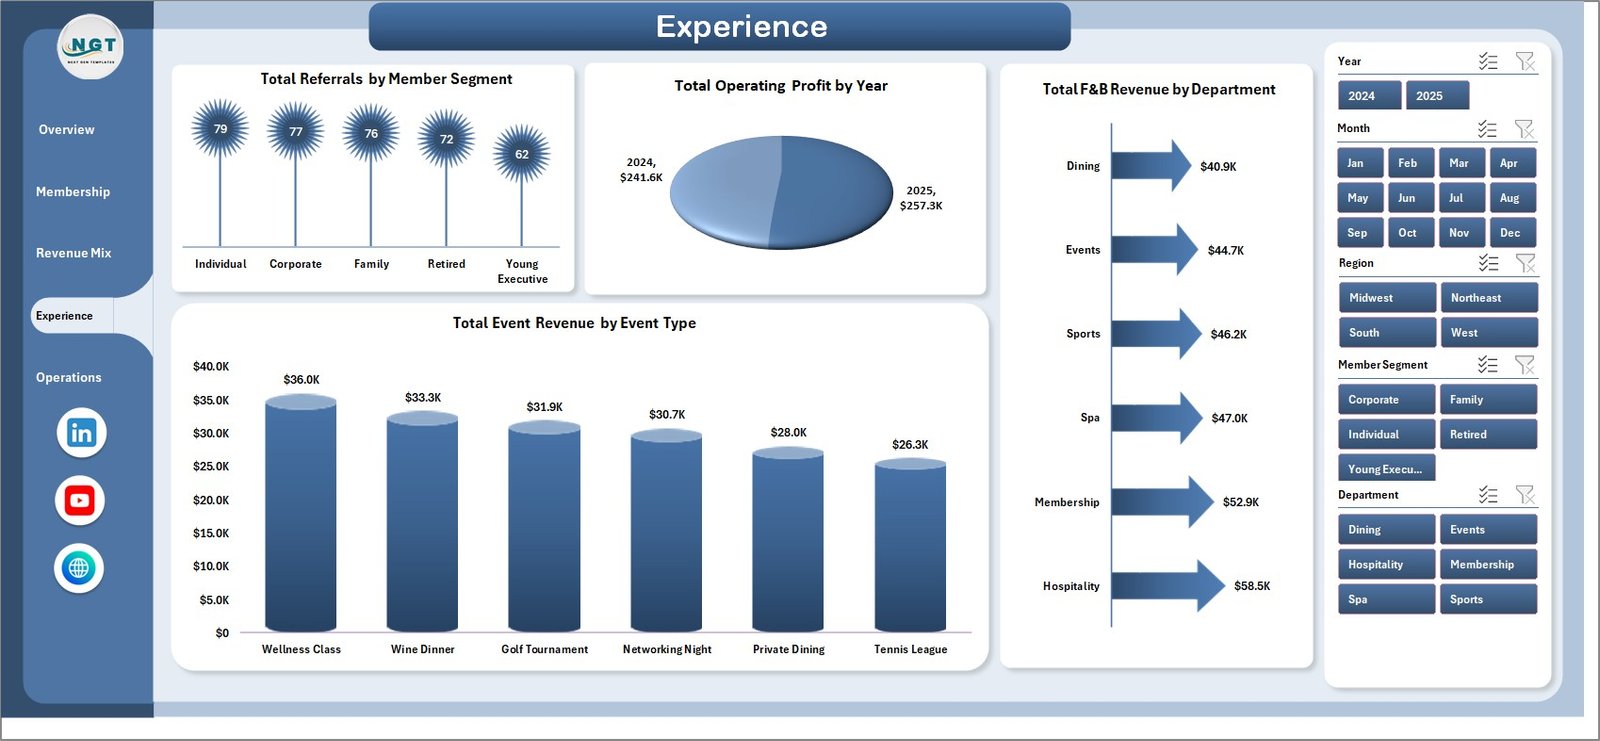
Experience Page
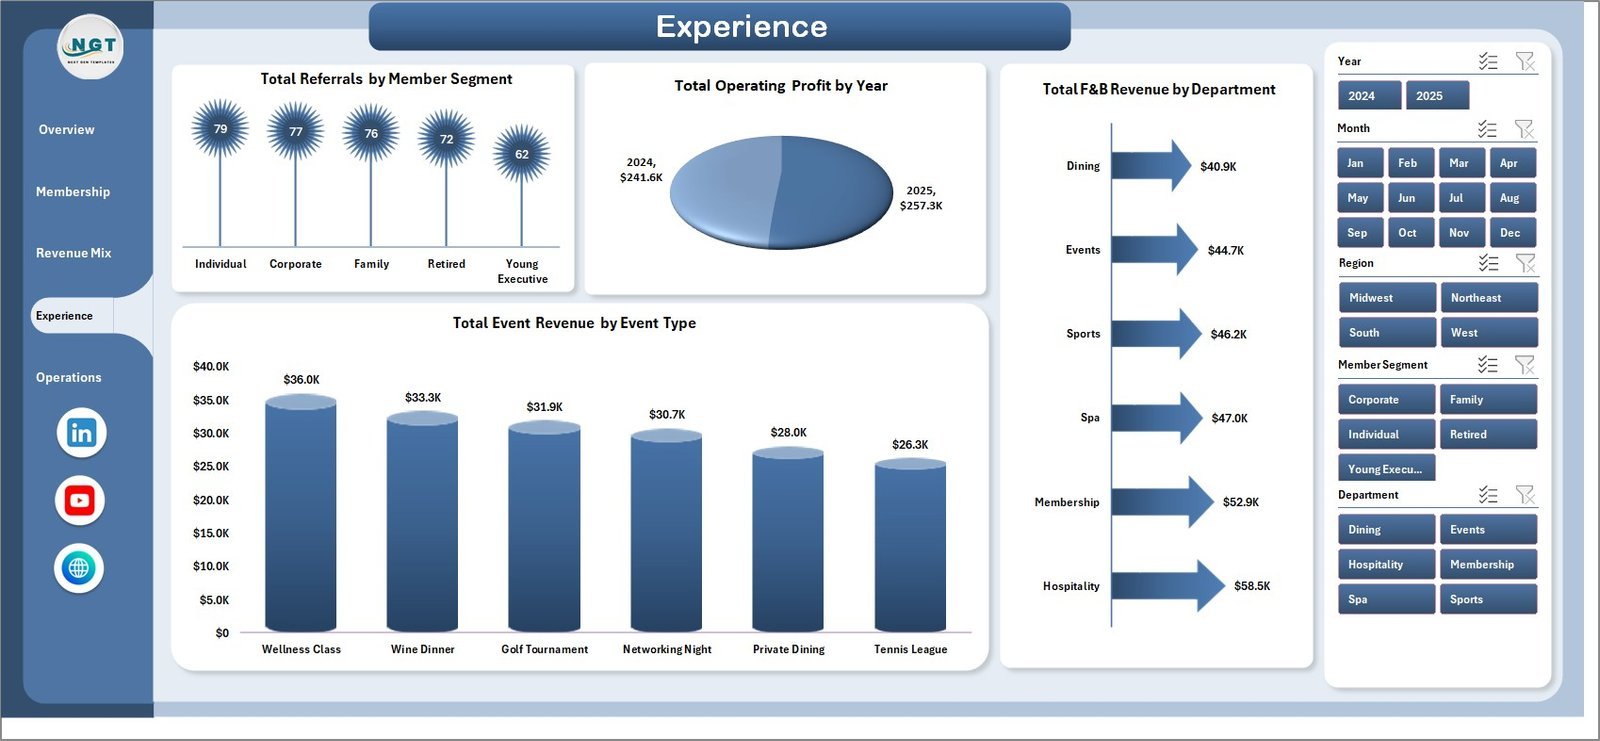
The Experience page connects member referrals, satisfaction-related performance, department revenue, event revenue, and yearly profit analysis. It helps teams review engagement and experience-driven outcomes.
- Total Referrals by Member Segment: Shows referral volume by member segment. This helps identify which member groups are strongest advocates for the club.
- Total Operating Profit by Year: Tracks operating profit year by year. It helps management review long-term performance and growth trends.
- Total F&B Revenue by Department: Breaks food and beverage revenue down by department. This helps reveal which areas are contributing most to F&B sales.
- Total Event Revenue by Event Type: Compares event revenue across event types. It helps clubs plan the most effective event calendar.
Operations Page
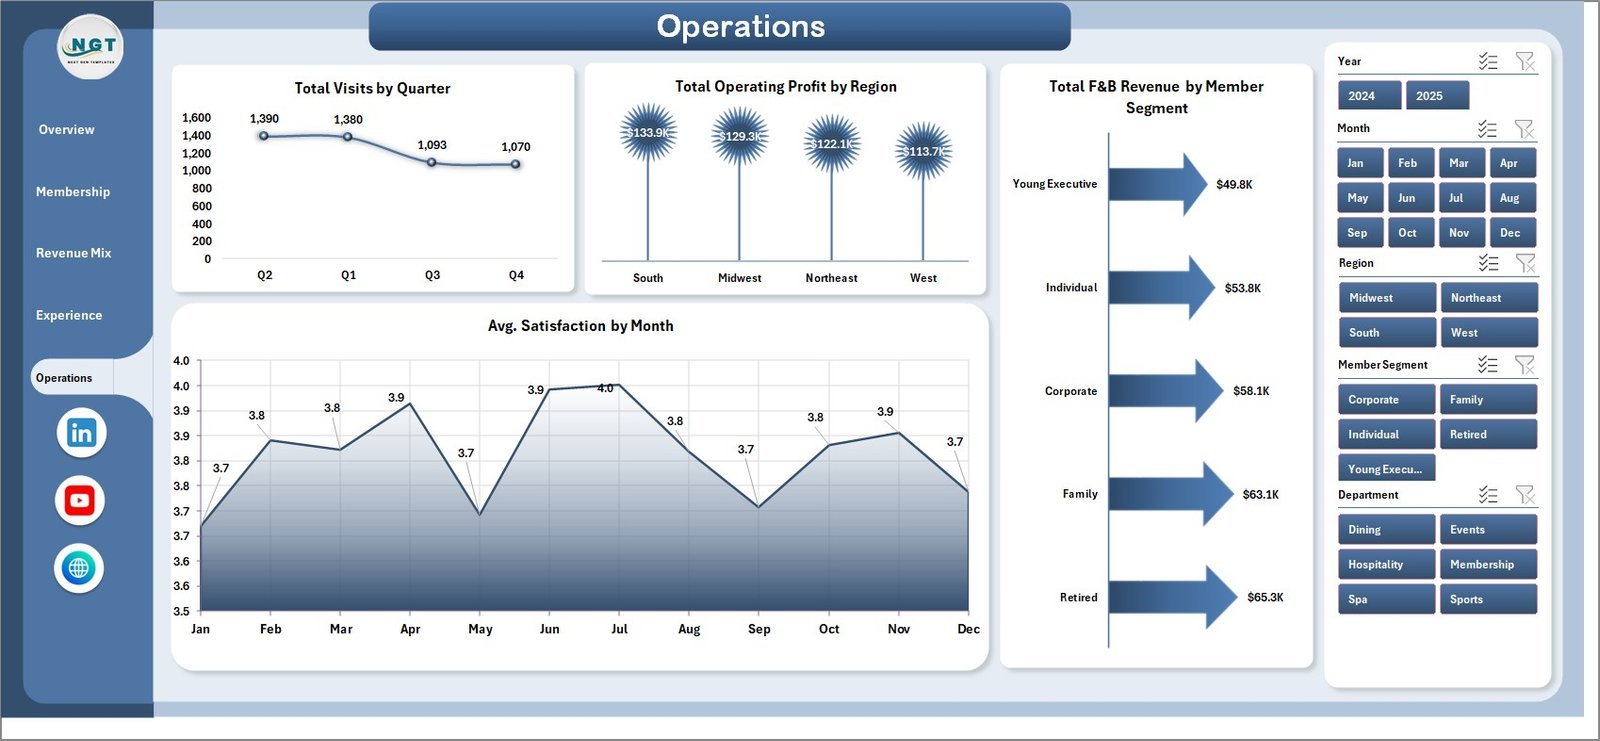
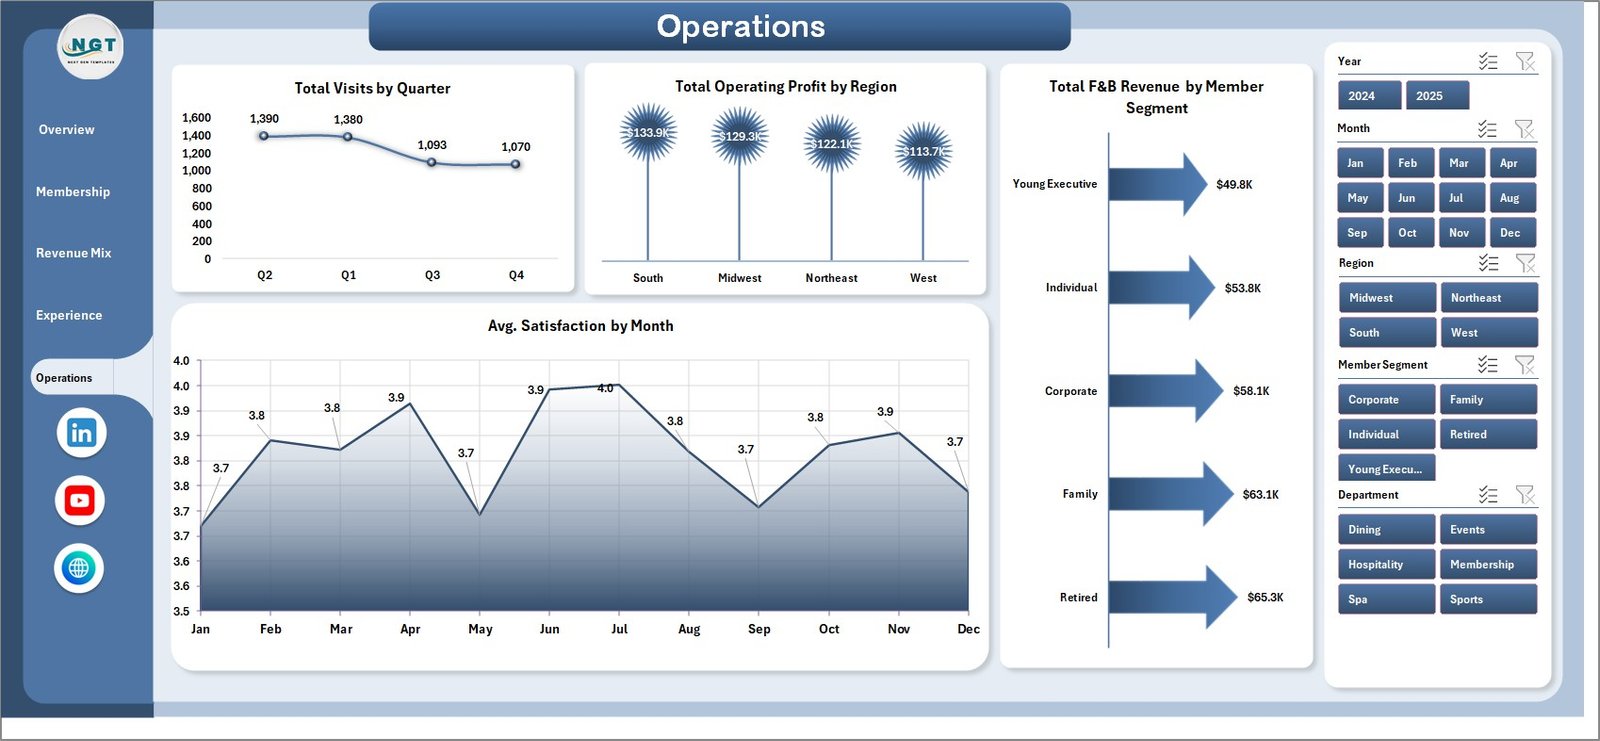
The Operations page helps track visit activity, profit by region, F&B revenue by segment, and satisfaction trends by month. It is built for operational review and recurring performance meetings.
- Total Visits by Quarter: Shows the total visits for each quarter. This helps teams understand seasonal activity and member usage patterns.
- Total Operating Profit by Region: Compares operating profit across regions. It helps identify high-performing and underperforming regions.
- Total F&B Revenue by Member Segment: Breaks food and beverage revenue down by segment. This helps identify which member groups spend more on F&B services.
- Avg. Satisfaction by Month: Tracks monthly satisfaction trends. It helps teams monitor whether member experience is improving or declining over time.
Data Sheet Tab
The Data sheet is where you add or replace your private club data in the same structured format. After updating the data, refresh the workbook so the pivots, charts, cards, and slicers update with your latest information.

Support Sheet Tab
The Support sheet contains the pivot tables used to power the dashboard dynamically. After changing the Data sheet, go to the Data tab in the Excel Ribbon and click Refresh All. The pivot tables and charts will refresh automatically. You can keep this sheet hidden after setup.

What You Get
- Excel dashboard workbook for private club reporting
- Overview, Membership, Revenue Mix, Experience, and Operations dashboard pages
- Editable Data sheet for adding your own records
- Support sheet with pivot tables for dynamic dashboard updates
- Slicers for quick filtering and interactive analysis
- Ready-to-use charts and KPI cards
Who Can Use This Dashboard?
- Private clubs and country clubs
- Membership managers
- Club finance and operations teams
- Event and F&B managers
- Business analysts supporting club performance reporting
Click to Purchases
Visit our YouTube channel to learn step-by-step video tutorials










Reviews
There are no reviews yet.