Short-form video reaches billions of people every month, but the reporting often stays messy. DataReportal reports that YouTube ads reach 2.65 billion users monthly and TikTok ad reach is 2.21 billion worldwide. The Short Video Platforms Dashboard in Excel helps you bring platform, creator, content, campaign, region, revenue, engagement, and cost data into one editable workbook. It is a one-time purchase, includes sample data, and can be reviewed before publishing because every sheet is visible and customizable in Microsoft Excel.
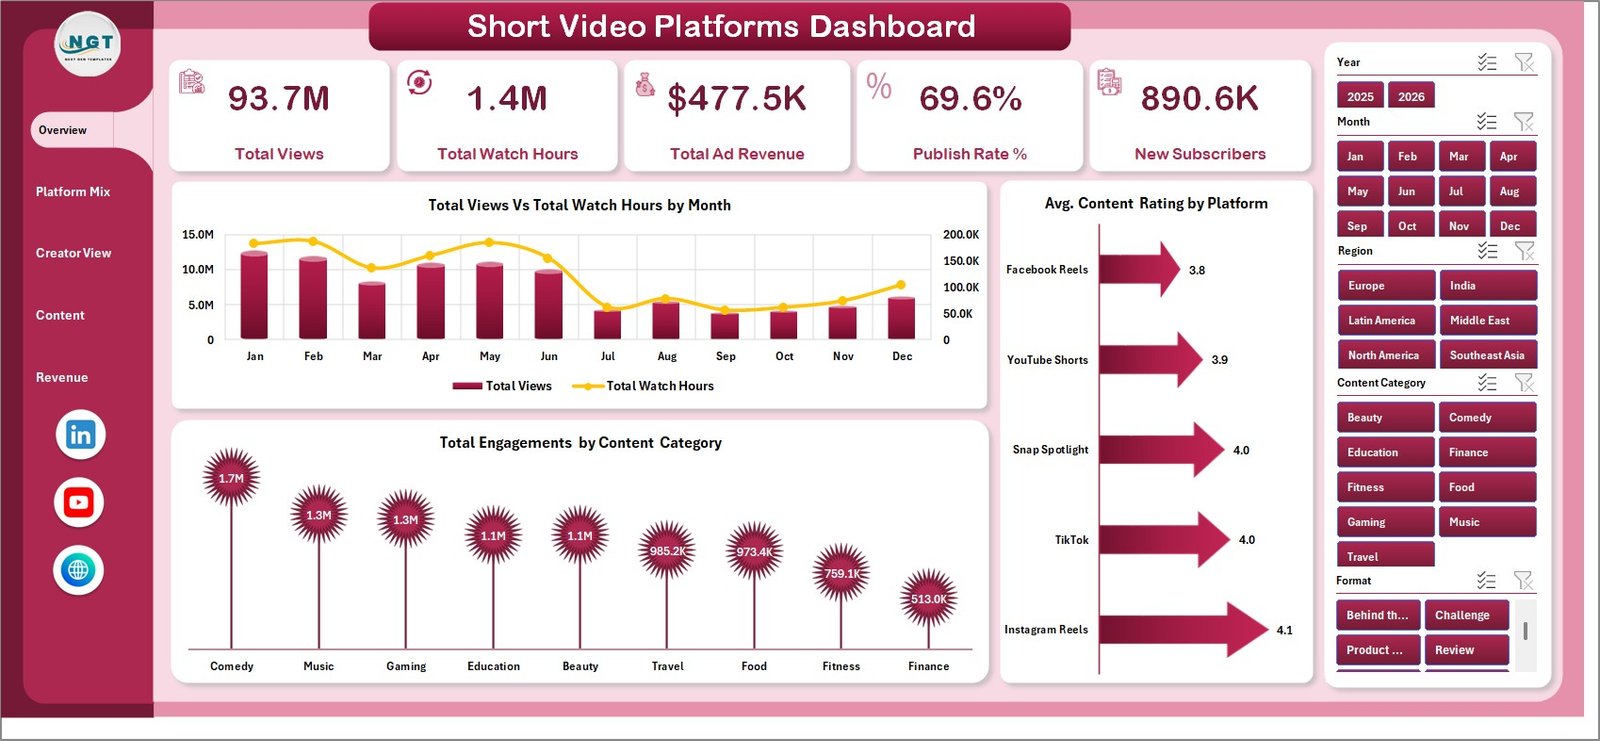
Short Video Platforms Dashboard in Excel
Key Features of Short Video Platforms Dashboard in Excel
- Track Total Views, Total Watch Hours, Total Ad Revenue, Publish Rate %, and New Subscribers.
- Analyze short video performance across Overview, Platform Mix, Creator View, Content, and Revenue pages.
- Use slicers to filter platform, creator, category, campaign, region, format, audience, and monetization views.
- Compare views, watch hours, engagement, content rating, ad revenue, production cost, and subscriber growth.
- Replace sample data in the Data Sheet and refresh the pivots to update the dashboard.
- Keep the Support Sheet hidden while preserving the pivot tables that drive the workbook.
What’s Inside the Short Video Platforms Dashboard in Excel
The workbook includes 7 sheet tabs. The Overview Page shows KPI cards for Total Views, Total Watch Hours, Total Ad Revenue, Publish Rate %, and New Subscribers, plus charts for Total Views Vs Total Watch Hours by Month, Total Engagements by Content Category, and Avg. Content Rating by Platform.
The Platform Mix sheet includes Engagement Rate % by Platform, Total Videos by Monetization Type, Total Views by Region, and Total Production Cost by Creator. The Creator View sheet includes Total Engagements by Audience Segment, Published Videos by Campaign, Publish Rate % by Content Category, and Total Ad Revenue Vs Total Production Cost by Creator.
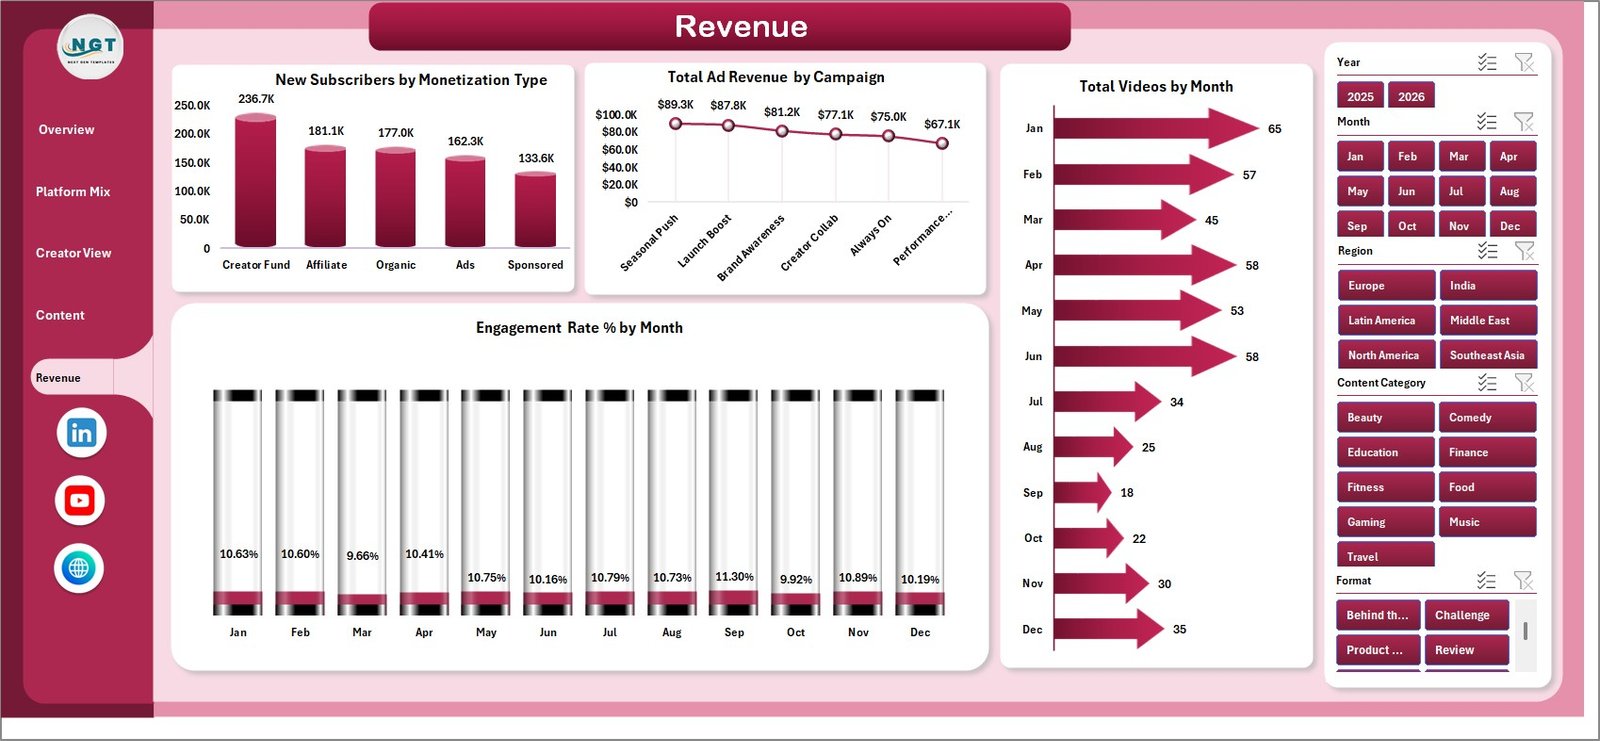
The Content sheet reviews Engagement Rate % by Format, Total Ad Revenue Vs Total Production Cost by Year, Publish Rate % by Region, and Avg. Content Rating by Content Category. The Revenue sheet includes New Subscribers by Monetization Type, Total Ad Revenue by Campaign, Engagement Rate % by Month, and Total Videos by Month.
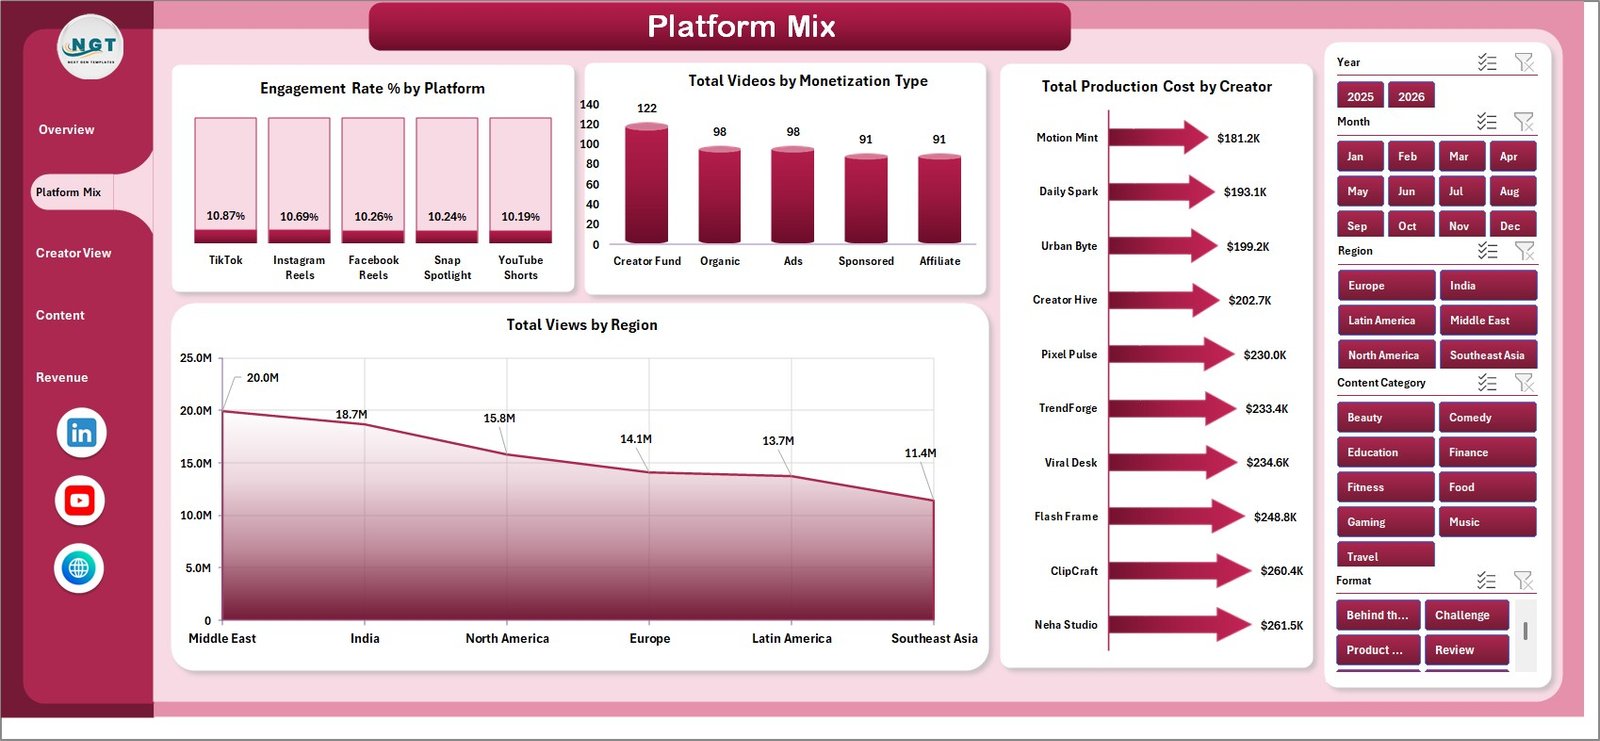
Platform Mix
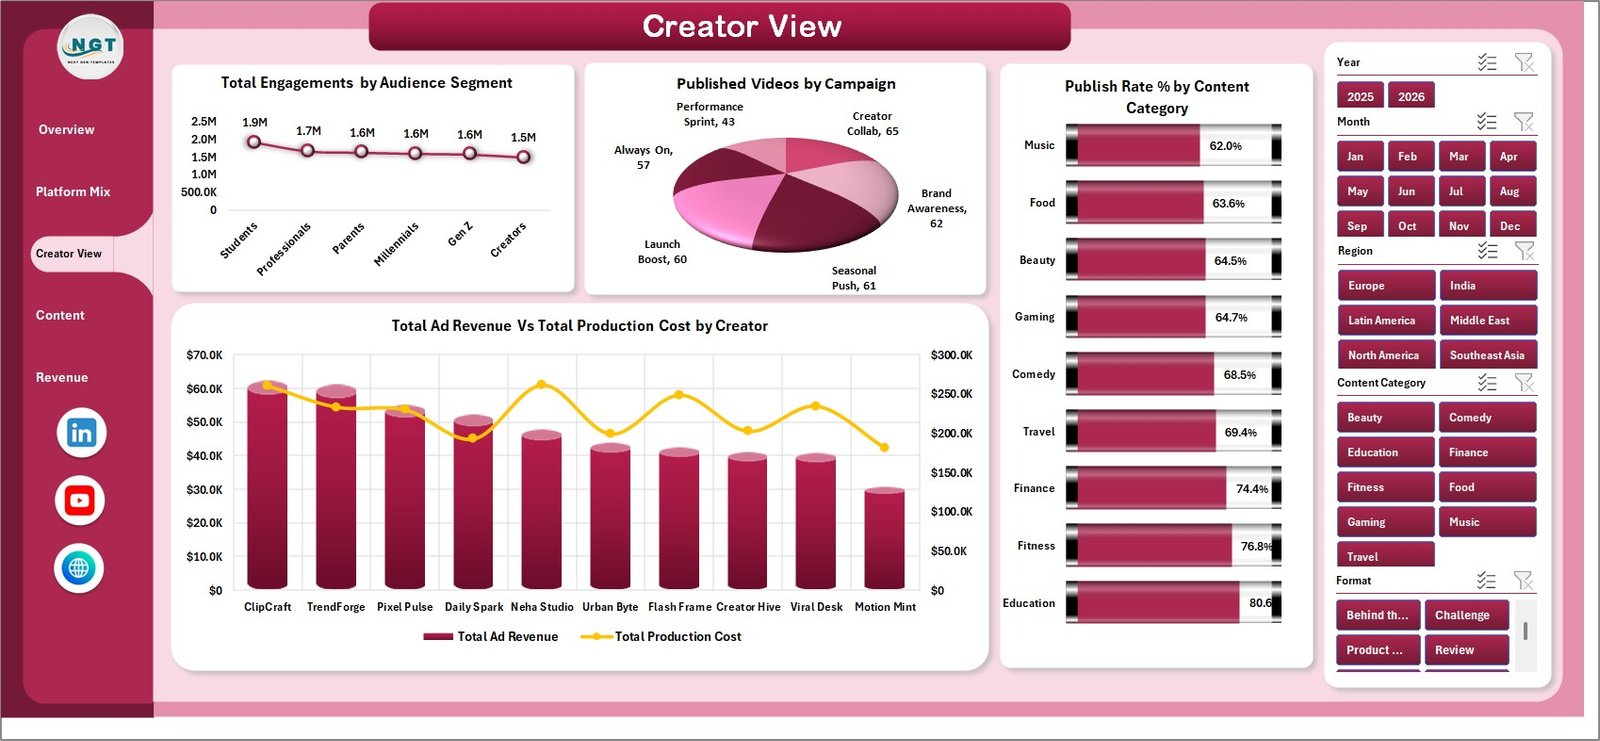
Creator View
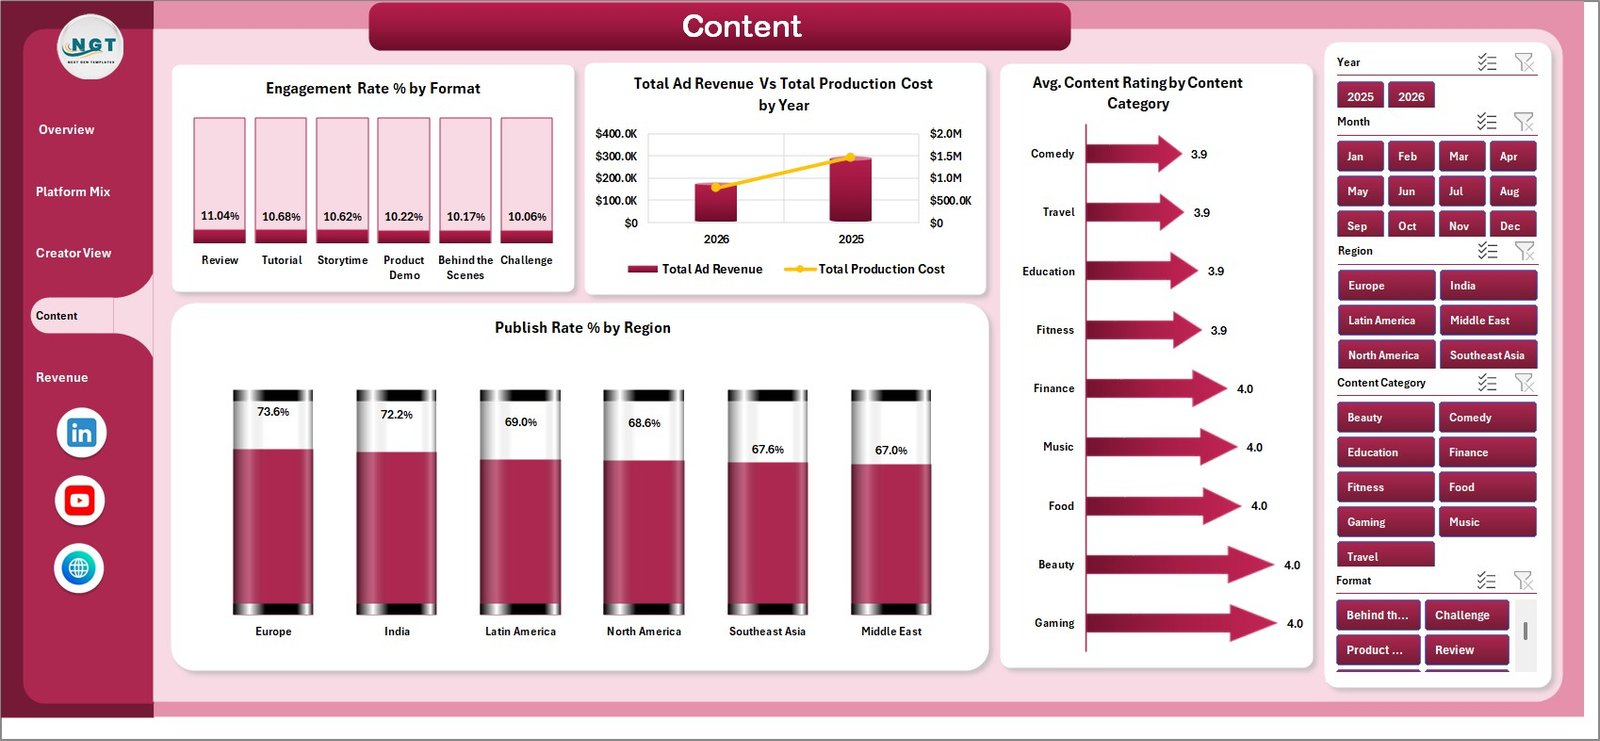
Content
Revenue
Short Video Platforms Dashboard in Excel vs. Google Sheets vs. Paid CRM/SaaS – Where This Fits
| Area | This Excel Dashboard | Google Sheets Alternative | Paid Social Media SaaS |
|---|---|---|---|
| Cost | One-time template purchase | Low software cost plus setup time | Recurring subscription |
| Setup | Replace data and refresh pivots | Build formulas and visuals manually | Connect accounts and configure permissions |
| Customization | Edit workbook, charts, pivots, slicers, and labels | Editable but requires manual maintenance | Limited by vendor plan |
| Best fit | Recurring short video performance reporting | Cloud-first team collaboration | Live scheduling, approvals, and API reporting |
Who This Template Is For – and Who It’s Not For
This template is for social media managers, creators, creator economy teams, agencies, brand marketing teams, influencer managers, video analysts, and media startups that need an Excel-based dashboard for short video reporting. It is especially useful when you export data from multiple sources and want one workbook for monthly review.
It is not for teams that need automatic API sync, live post scheduling, content approval workflow, social listening, comment moderation, or ad campaign management. For those needs, a dedicated social media SaaS tool may be better.
How to Use the Short Video Platforms Dashboard in Excel
- Download and unzip the product file.
- Open the workbook in Microsoft Excel.
- Go to the Data Sheet and replace the sample records with your own short video data.
- Keep the same column structure and formats.
- Click Data > Refresh All in the Excel ribbon.
- Use slicers on the dashboard pages to analyze filtered views.

Data Sheet tab

Support sheet tab
Real-World Use Cases
Aisha, social media manager: uses the Overview and Revenue pages to compare monthly views, watch hours, engagement rate, and ad revenue before planning the next content calendar.
Daniel, creator partnerships lead: uses Creator View to compare revenue and production cost by creator before deciding which creators deserve more budget.
Meera, agency analyst: uses Platform Mix and Content pages to prepare a client report that explains which platforms, regions, formats, and categories performed best.
Frequently Asked Questions
Does this dashboard work for TikTok, YouTube Shorts, and Instagram Reels?
Yes. The dashboard can be used for any short video platform when your data follows the workbook format.
Do I need macros?
No macro requirement is described for this template. It is built around Excel sheets, charts, slicers, pivot tables, and structured data.
Can I customize the charts?
Yes. Since this is an Excel workbook, you can edit charts, pivot tables, labels, colors, and sheet layouts.
How do I update the dashboard?
Replace the sample records in the Data Sheet, then use Data > Refresh All to refresh pivot tables and charts.
Can I hide the Support Sheet?
Yes. The Support Sheet contains pivot tables that drive the dashboard, and it can be hidden for regular use.
Is this a live social media analytics tool?
No. It is an Excel reporting dashboard. It does not connect directly to platform APIs or schedule posts.
About the Author
Built by PK – Microsoft Certified Professional with 15+ years of Excel, Google Sheets, and Power BI experience. Founder of NextGenTemplates, reaching 300K+ subscribers across YouTube channels. Every template is hand-built and tested before release.
Explore Related Templates
Explore more Excel Dashboard Templates and MS Excel Templates on NextGenTemplates.
Get the Short Video Platforms Dashboard in Excel today and turn your short video data into a clean Excel reporting workbook.
Last updated: August 10, 2026.