In the modern digital landscape, marketing success depends on data-driven decision-making. Guesswork is no longer enough — businesses need clear insights into campaign performance, channel effectiveness, and ROI. That’s why we built the Marketing Analytics Dashboard in Excel, a cost-effective and powerful solution that turns raw marketing data into actionable insights.
This dashboard consolidates all your campaign data into interactive charts, KPIs, and trend analysis, enabling you to track cost vs. revenue, monitor conversions, and evaluate manager performance — all inside Excel. Forget complex and expensive BI tools. With this template, you get professional analytics at a fraction of the cost.
🔑 Key Features of the Marketing Analytics Dashboard in Excel
✨ Five Analytical Pages – Overview, Campaign Analysis, Channel Analysis, Manager Analysis, and Monthly Trends.
✨ At-a-Glance KPIs – Cost vs. revenue, conversions, and lead generation performance.
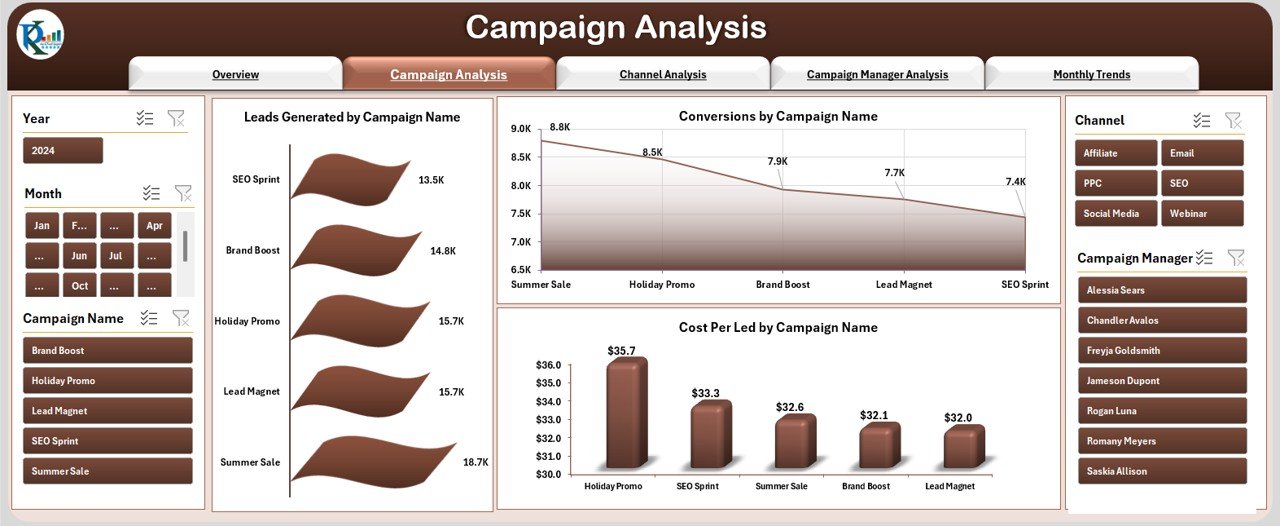
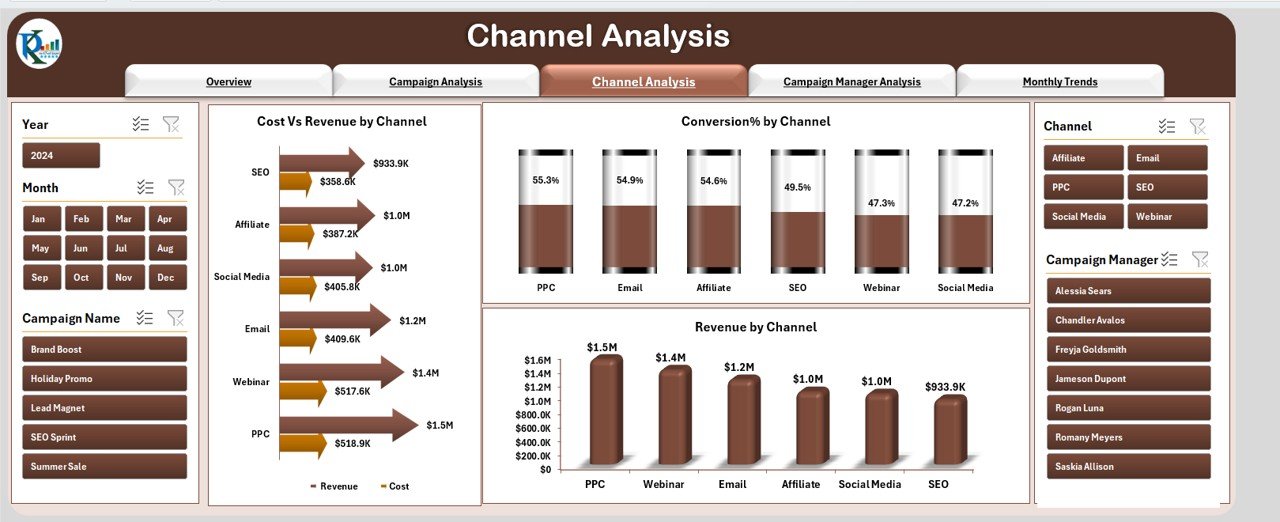
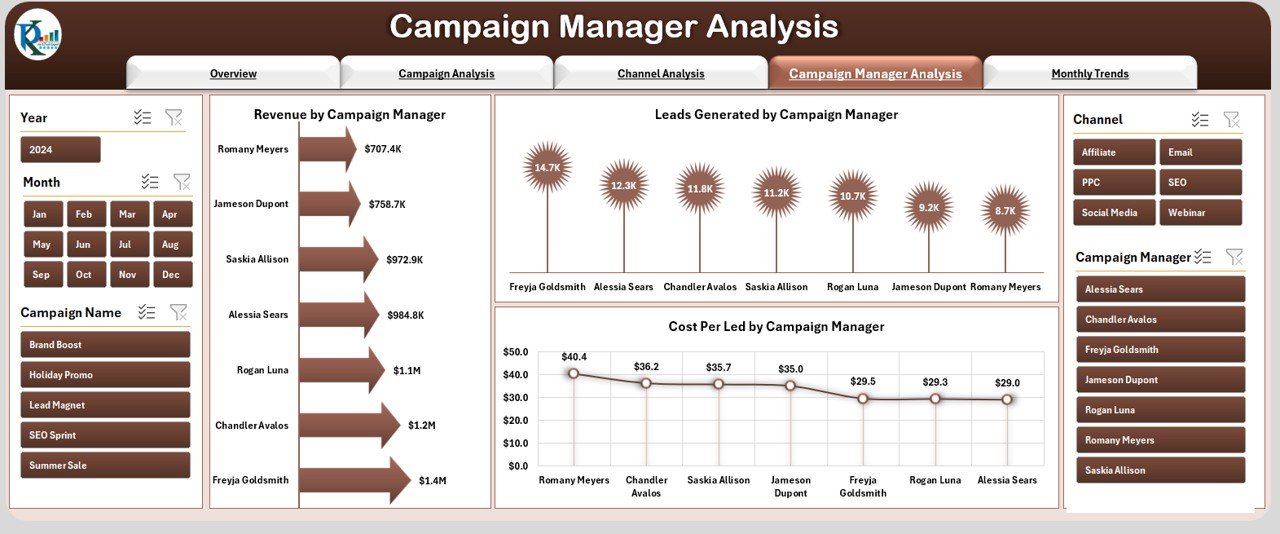
✨ Interactive Slicers – Filter results by campaign, channel, or manager in seconds.
✨ Manager Evaluation – Track cost efficiency and revenue contribution per manager.
✨ Monthly Trend Tracking – Identify seasonal patterns and long-term performance shifts.
✨ Central Data Sheet – Store all marketing inputs (costs, leads, conversions, revenue).
✨ Support Sheet – Reference lists, dropdowns, and lookup tables for automation.
✨ Excel-Based – No extra software or subscription fees required.
📦 What’s Inside the Dashboard
When you purchase the Marketing Analytics Dashboard in Excel, you get:
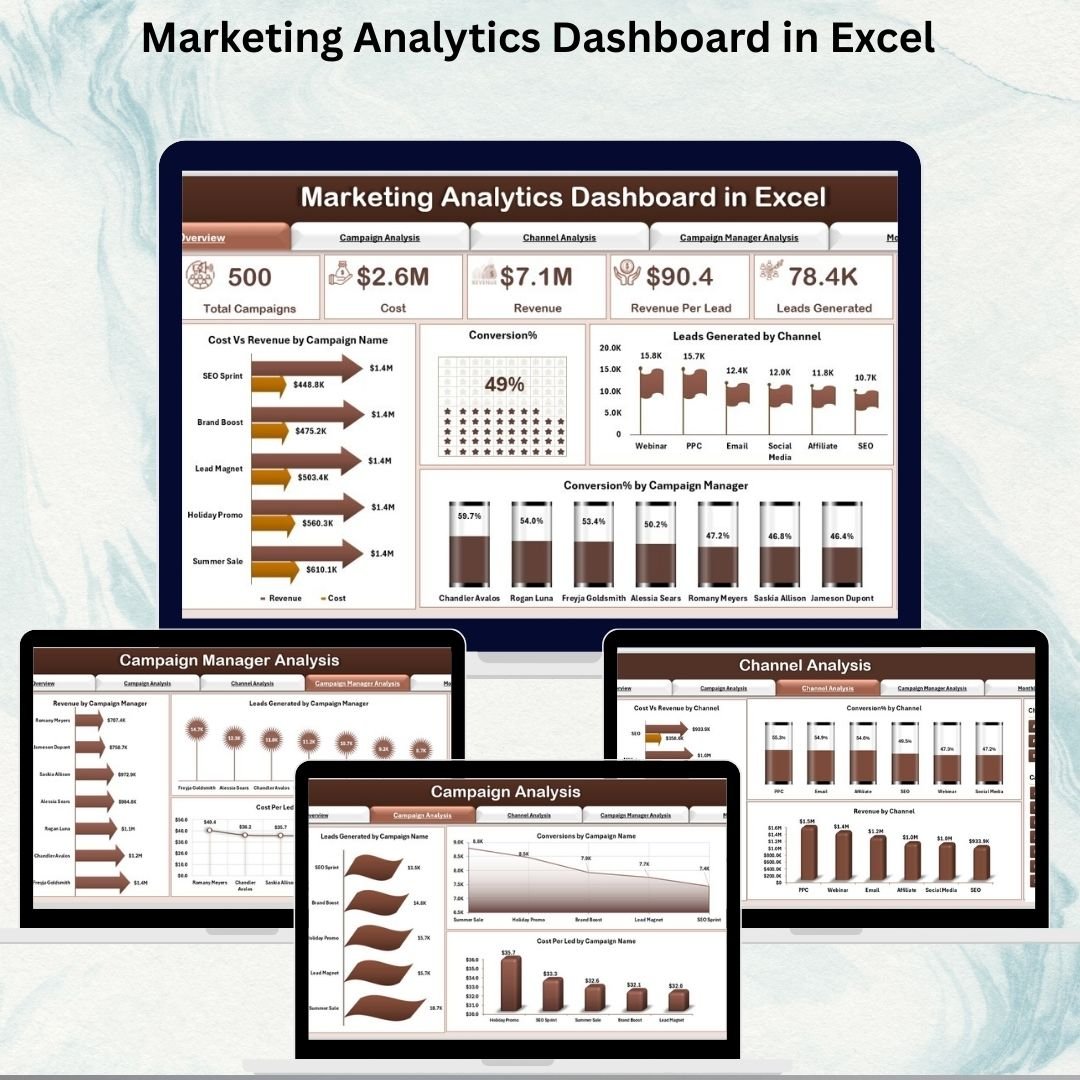
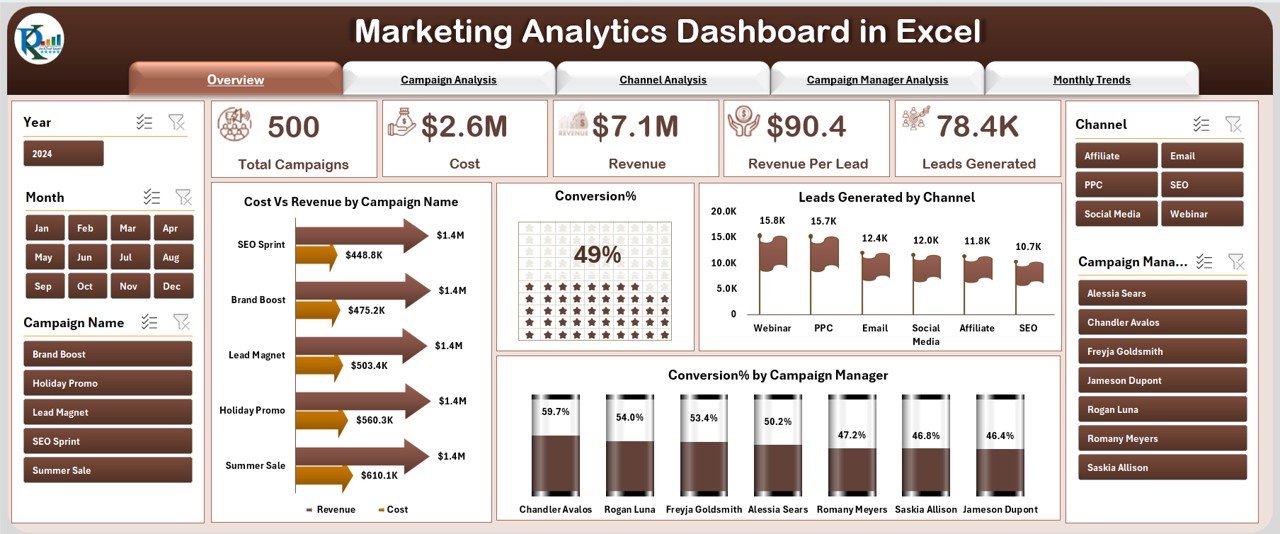
1️⃣ Overview Page – A control panel with KPIs such as Cost vs. Revenue, Conversion %, Leads by Channel, and Manager Performance.
2️⃣ Campaign Analysis Page – Drill down into leads, conversions, and cost-per-lead by campaign.
3️⃣ Channel Analysis Page – Compare channel efficiency across cost, revenue, and conversions.
4️⃣ Campaign Manager Analysis Page – Evaluate manager-driven performance for accountability.
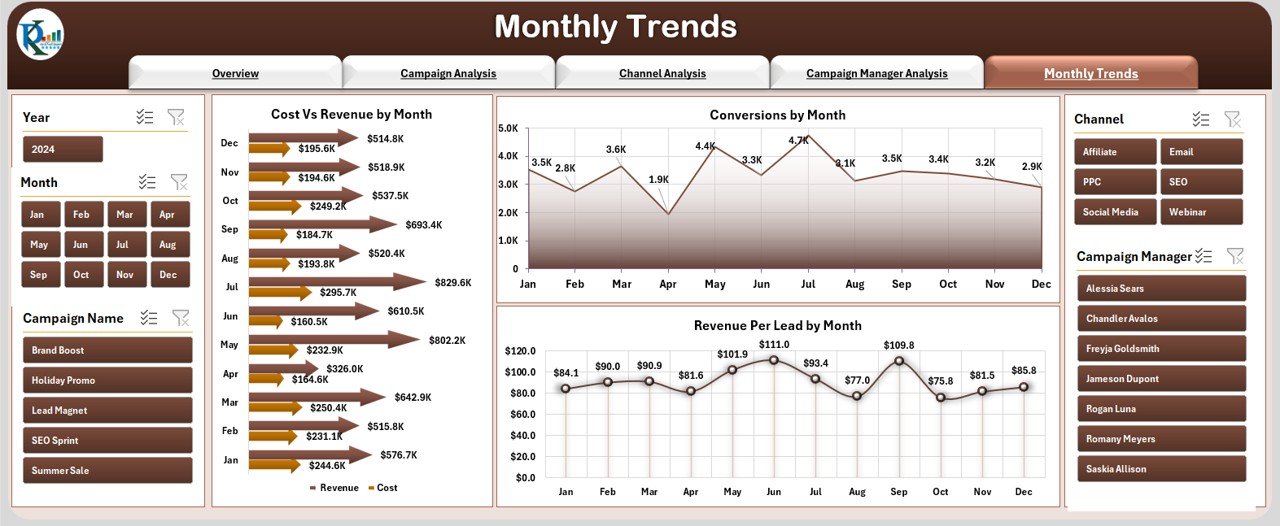
5️⃣ Monthly Trends Page – View cost vs. revenue by month, conversion changes, and revenue per lead.
6️⃣ Data Sheet – Input all raw marketing data; the dashboard updates automatically.
7️⃣ Support Sheet – Manage lists and references for dropdowns and slicers.
This structure ensures you can manage campaigns effectively and present insights instantly.
🛠️ How to Use the Marketing Analytics Dashboard
✔️ Step 1 – Enter Raw Data: Record campaign costs, leads, conversions, and revenue in the Data Sheet.
✔️ Step 2 – Navigate Pages: Use the navigator to switch between Overview, Campaign, Channel, Manager, and Trends.
✔️ Step 3 – Apply Filters: Slice results by campaign, channel, or manager for targeted insights.
✔️ Step 4 – Review KPIs: Monitor ROI, cost per lead, conversion %, and revenue trends.
✔️ Step 5 – Generate Reports: Export visuals into presentations, PDFs, or share directly with stakeholders.
It’s simple, flexible, and effective — perfect for marketers with or without advanced Excel skills.
👥 Who Can Benefit from This Dashboard
📈 Small Businesses – Track campaigns without costly BI tools.
💼 Marketing Agencies – Showcase transparent results to clients.
🛒 E-Commerce Stores – Monitor ad spend and revenue across platforms.
🏢 Corporate Teams – Evaluate channel ROI and campaign manager performance.
🎯 Marketing Managers – Make smarter budget allocation decisions.
From startups to enterprises, this tool adapts to all business sizes and marketing strategies.
With the Marketing Analytics Dashboard in Excel, you will:
✅ Save money on expensive analytics tools.
✅ Centralize all marketing data in one place.
✅ Gain clarity with clear KPIs and charts.
✅ Track ROI, conversions, and revenue trends easily.
✅ Optimize campaigns for maximum returns.
Click here to read the Detailed blog post
Visit our YouTube channel to learn step-by-step video tutorials 👉 Youtube.com/@PKAnExcelExpert


Reviews
There are no reviews yet.