
Tracking craft brewery KPIs in Excel gives brewery owners and operations managers instant visibility into production yield, batch quality, taproom revenue, distribution performance, and cost metrics — all from a single file that works offline, requires no onboarding, and updates automatically when you enter new monthly data. Whether you manage a 5-barrel nano-brewery or a 30-barrel regional operation, the Craft Brewery KPI Scorecard in Excel provides the structured framework you need to monitor performance without paying recurring subscription fees.
Key Features of Craft Brewery KPI Scorecard in Excel
The Craft Brewery KPI Scorecard in Excel delivers a complete performance monitoring system with 4 worksheet tabs covering scorecard overview, KPI trend analysis, data input, and KPI definitions. Each KPI displays Actual vs Target values alongside MTD (Month-to-Date) and YTD (Year-to-Date) comparisons, with conditional formatting that instantly flags underperforming metrics in red and strong performers in green.
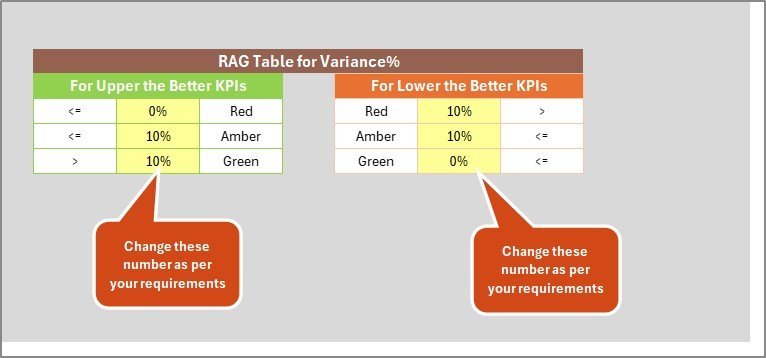
The scorecard supports both “Upper the Better” KPIs (like revenue, production volume, and customer satisfaction) and “Lower the Better” KPIs (like defect rate, waste percentage, and cost per barrel), automatically adjusting the performance logic for each metric type. Every KPI includes its formula, unit of measurement, and definition for complete transparency across your team.
The KPI Trend sheet provides dynamic Actual vs Target vs Prior Year trend charts that update when you select any KPI from the dropdown in cell C3. This gives brewery managers instant visibility into production yield, batch quality, taproom sales, distribution revenue, and cost-per-barrel trends over 12 months. The template uses standard Excel formulas and charts with no macros or VBA, making it compatible with Excel for Windows, Mac, and Excel Online.
Dashboard Pages Explanation
1. Scorecard Sheet
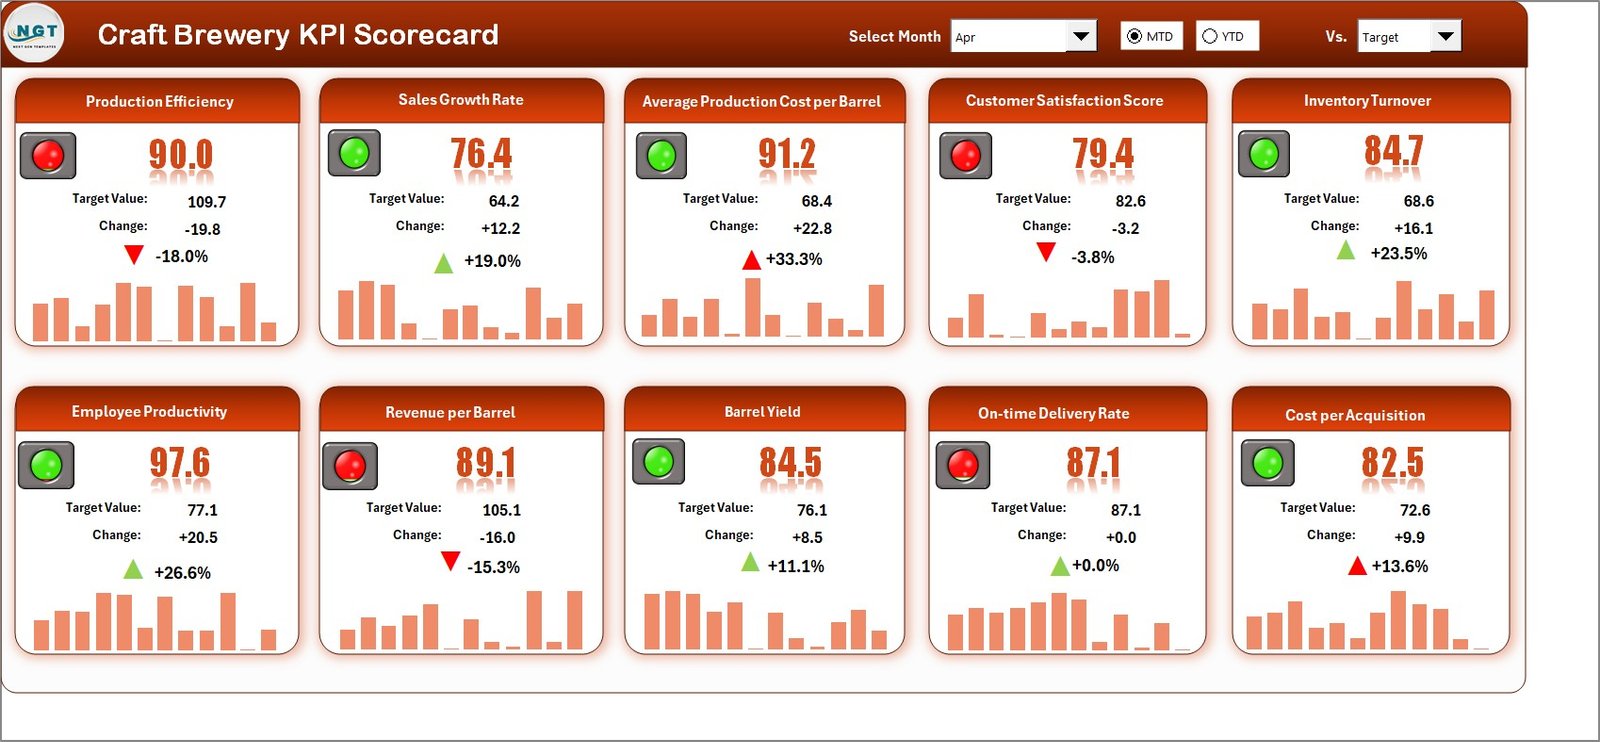
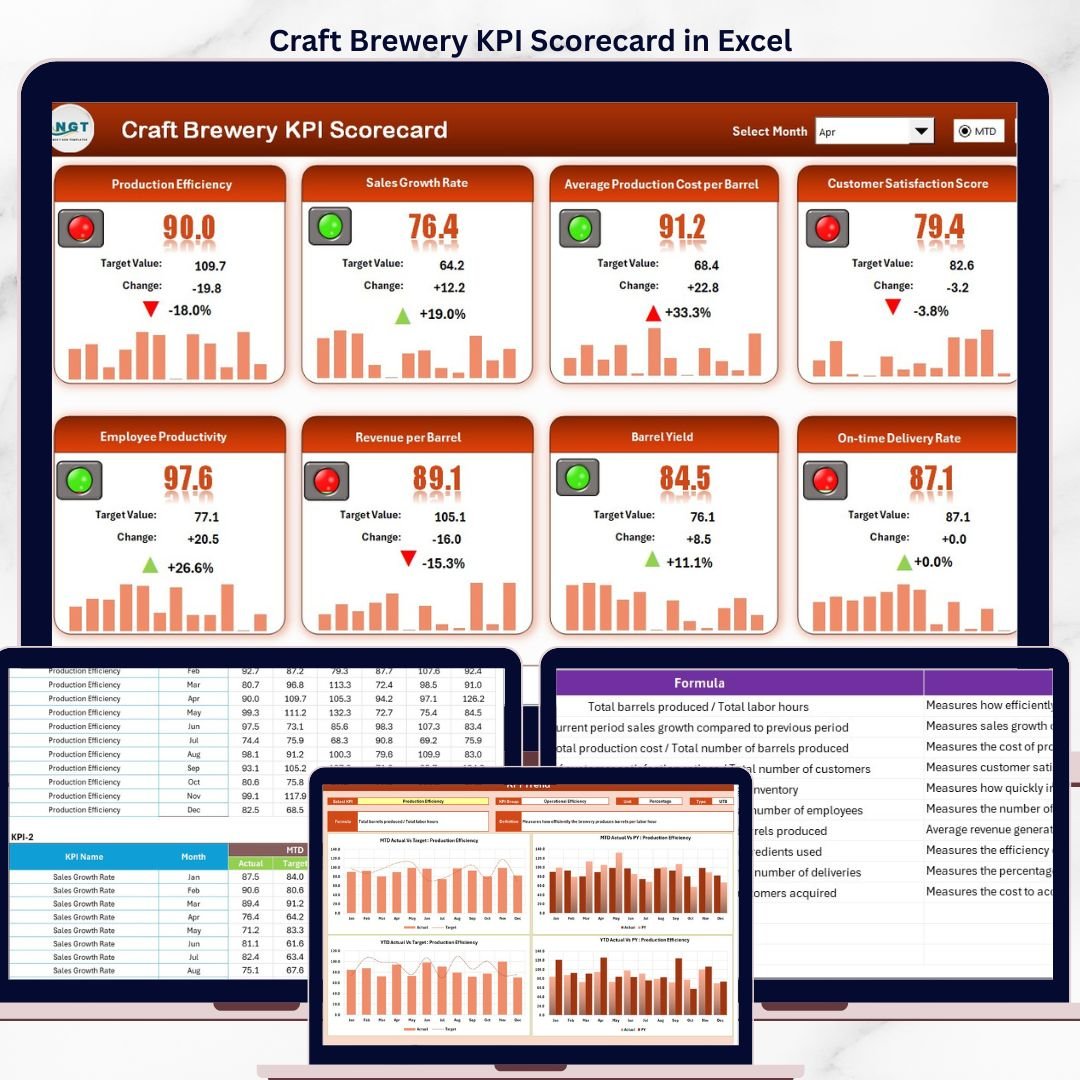
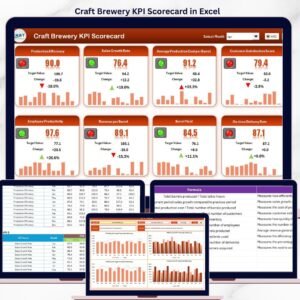
Craft Brewery KPI Scorecard in Excel
The Scorecard sheet is the main interface where you view all KPI performance at a glance. Key features include:
- Dropdown Menus – Select the month, MTD (Month-to-Date), or YTD (Year-to-Date) for performance analysis
- Actual vs Target Values – Compare actual performance against targets for each KPI
- Visual Indicators – Quickly see performance status using color-coded conditional formatting (green for on-target, red for below target)
- KPI Overview – Display all relevant information about each KPI, including MTD and YTD comparisons in a single view
2. KPI Trend Sheet
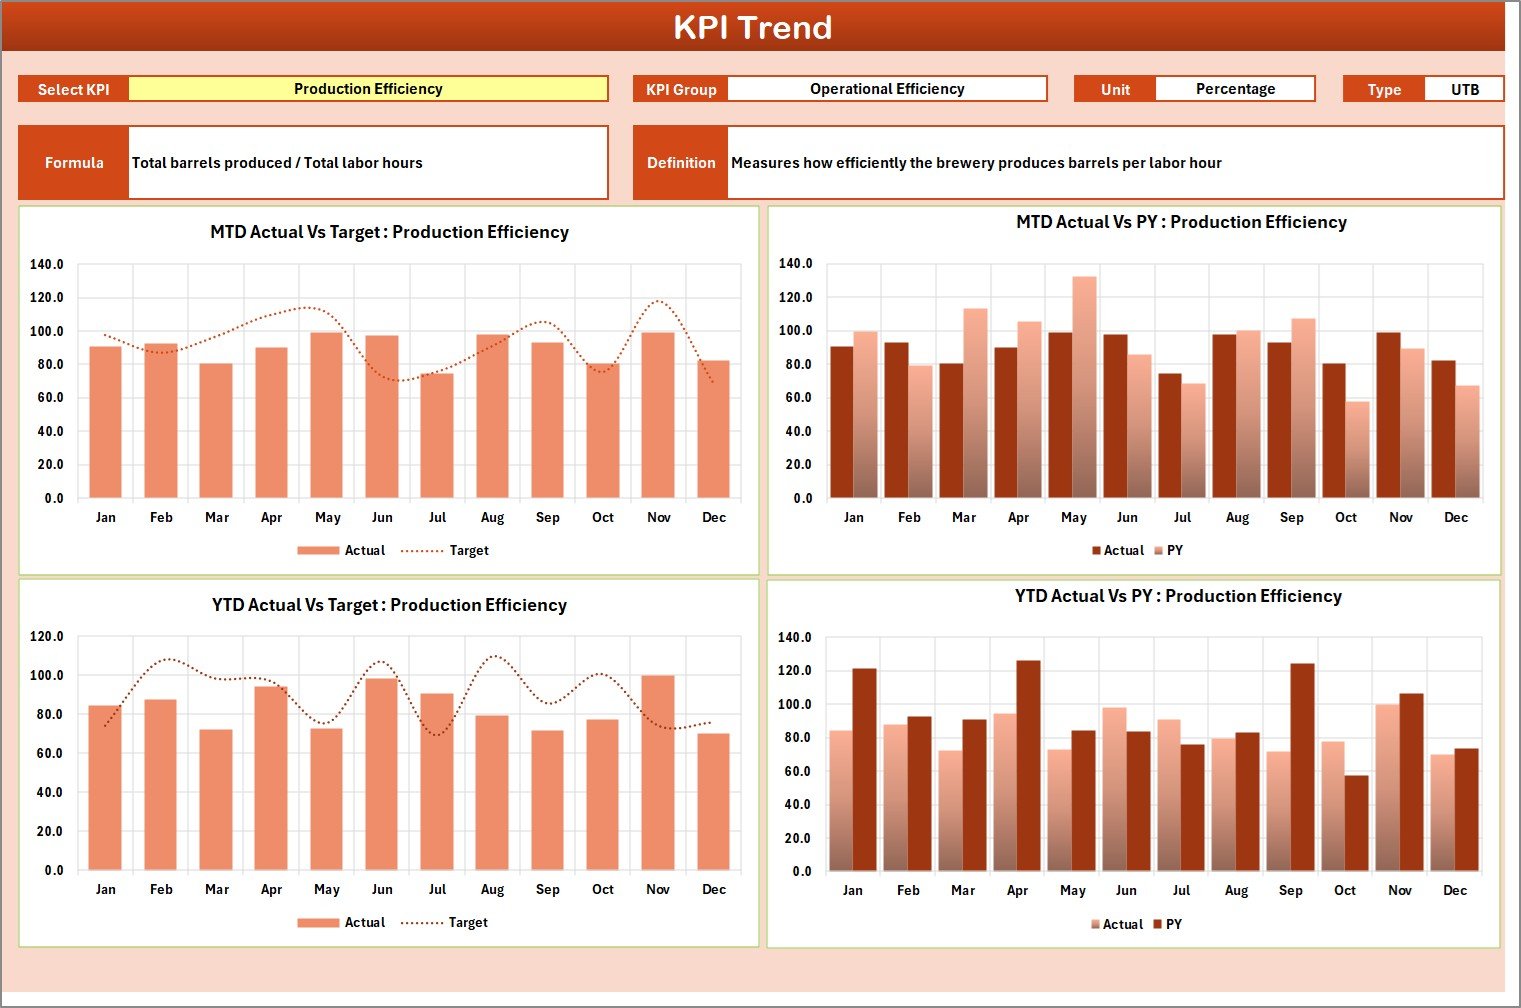
KPI Trend Sheet
Select any KPI from the dropdown on cell C3 to view its detailed trend analysis. The sheet displays the KPI Group, Unit, Type (Lower the Better or Upper the Better), Formula, and Definition. MTD and YTD trend charts show Actual, Target, and Prior Year numbers side by side, helping you identify seasonal patterns and performance gaps across months. This is especially useful for tracking brew cycle efficiency, taproom foot traffic trends, and distribution fill rates over time. If you also track aquaculture KPIs in Excel, the same scorecard structure applies across food production industries.
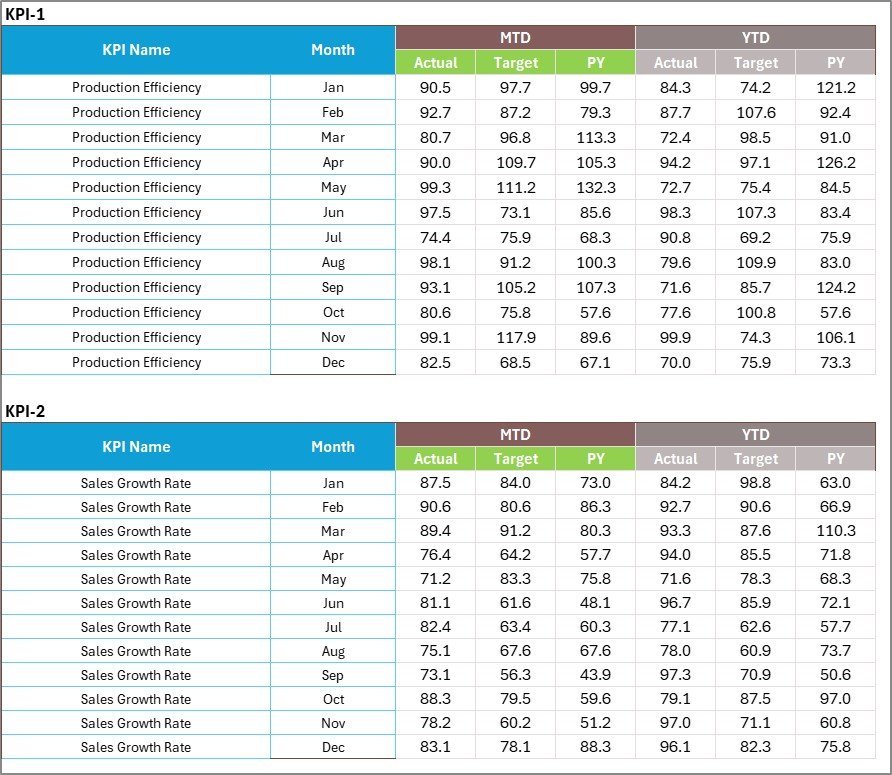
3. Input Data Sheet
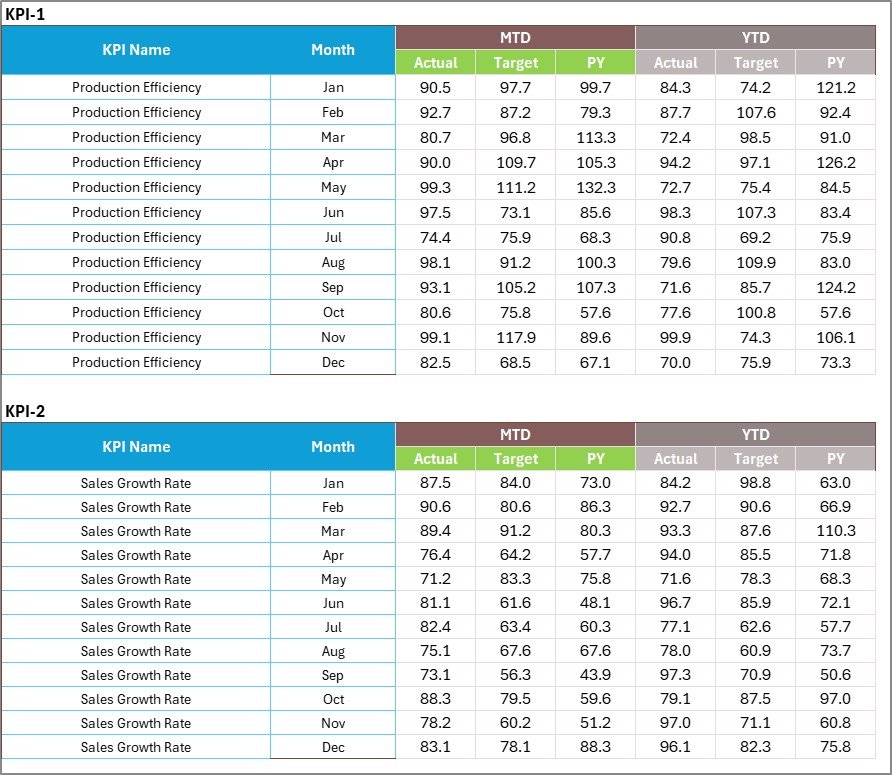
Input Data Sheet
The Input Data sheet is where you enter all KPI data monthly. Record actual values, targets, and prior year metrics for each KPI. The sheet is structured with months as columns and KPIs as rows, making data entry straightforward. As you add new monthly figures, every scorecard view, trend chart, and performance indicator across the entire workbook updates automatically.
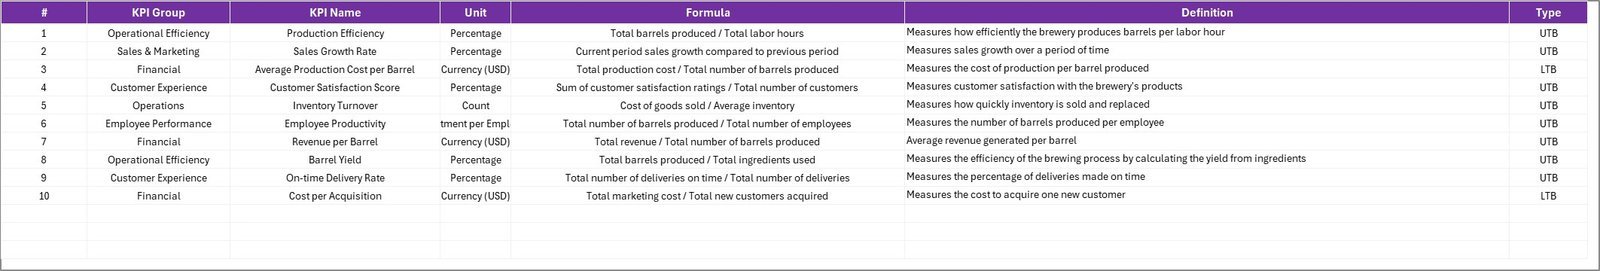
4. KPI Definition Sheet

KPI Definition Sheet
In this sheet, enter each KPI Name, KPI Group, Unit, Formula, and KPI Definition. This serves as the master reference that feeds KPI labels, classifications, and metadata across the Scorecard, Trend, and Input Data sheets. You can add, remove, or modify KPIs at any time — the template adapts dynamically through dropdown menus and formula references.
Craft Brewery KPI Scorecard in Excel vs. Google Sheets Scorecard vs. Ekos/Ollie — Feature Comparison
| Feature | Craft Brewery KPI Scorecard in Excel | Google Sheets Scorecard | Ekos / Ollie Brewery Software |
|---|---|---|---|
| Cost | $12.99 one-time | Free (DIY build) | $150–$500/month |
| Platform | Microsoft Excel (desktop + online) | Google Sheets (browser) | Cloud SaaS |
| Setup Time | Under 10 minutes | 4-8 hours (manual build) | 1-2 weeks onboarding |
| Real-time Collaboration | Yes (Excel Online / SharePoint) | Yes (native) | Yes |
| Mobile Access | Yes (Excel mobile app) | Yes (Sheets app) | Yes |
| Customizable KPIs | Fully editable definitions, formulas, groups | Manual formula edits | Limited to platform fields |
| MTD/YTD Trend Charts | Built-in with Actual vs Target vs PY | Manual chart creation | Pre-built reports only |
| Year-1 Cost (5 users) | $12.99 total | $0 (but 8+ hours labor) | $1,800–$6,000 |
| Offline Access | Full offline support | Limited offline mode | No |
For craft breweries that want structured KPI tracking without paying $150+/month for Ekos or Ollie, the Craft Brewery KPI Scorecard in Excel sits in the sweet spot.
📖 Click here to read the Detailed Blog Post
🎥 Visit our YouTube channel for step-by-step video tutorials
👉 YouTube.com/@NextGenTemplates


Reviews
There are no reviews yet.