

The Fitness Trainer Dashboard in Excel tracks 6 core KPIs, 15 chart breakdowns, and 5 interactive analysis pages in a single Excel file — built for personal trainers, studio owners, and boutique fitness operators who need to see revenue per trainer, session attendance, client ratings, and calories burned at a glance. Pivot-powered, slicer-filtered, and refresh-ready: drop your session data into the Data sheet, click Refresh All, and every card, chart, and filter updates in seconds.
Trusted by 8,400+ teams across 50+ countries who run their business on NextGenTemplates dashboards.
✅ Instant download · One-time payment · No subscription · No per-user fees · Lifetime access
Fitness Trainer Dashboard
🔑 Key Features of Fitness Trainer Dashboard in Excel
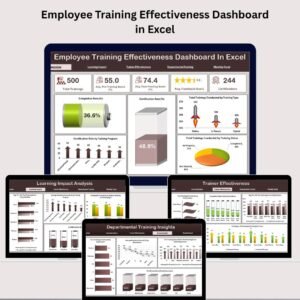
🔹 6 High-Level KPI Cards on the Overview page tracking Total Revenue, Total Records, Average Client Rating, Total Calories Burned, Average Session Duration, and Attendance % — the six numbers every fitness business owner needs weekly.
🔹 5 Dedicated Analysis Pages covering Overview, Session Analysis, Client Insights, Trainer Performance, and Revenue Trends — each with 3-4 pivot-driven charts for deep drill-downs.
🔹 Pivot-Table Powered Architecture on a hidden Support Sheet — update the Data sheet, hit Refresh All on the Data ribbon, and every chart, card, and slicer on all 5 analysis pages updates instantly.
🔹 Interactive Slicers for fast filtering by trainer, session type, location, time slot, and membership type without writing a single formula.
🔹 Trainer-Level Performance Tracking with revenue-per-trainer, average rating-per-trainer, calories-burned-per-trainer, and session-volume-per-trainer analysis baked into the Trainer Performance tab.
🔹 Client Segmentation Built In — analyze revenue and session volume by age group, gender, referral source, and membership type to find your most profitable client segment.
🔹 Year-over-Year Revenue Trend Analysis comparing Total Revenue vs Supplements Revenue on the Revenue Trends page, plus training-goal-level and attendance-status breakdowns.
🔹 Clean, Printable Data Sheet with clearly labeled columns — add rows, refresh, done. No macro knowledge required.
📦 What’s Inside the Fitness Trainer Dashboard in Excel
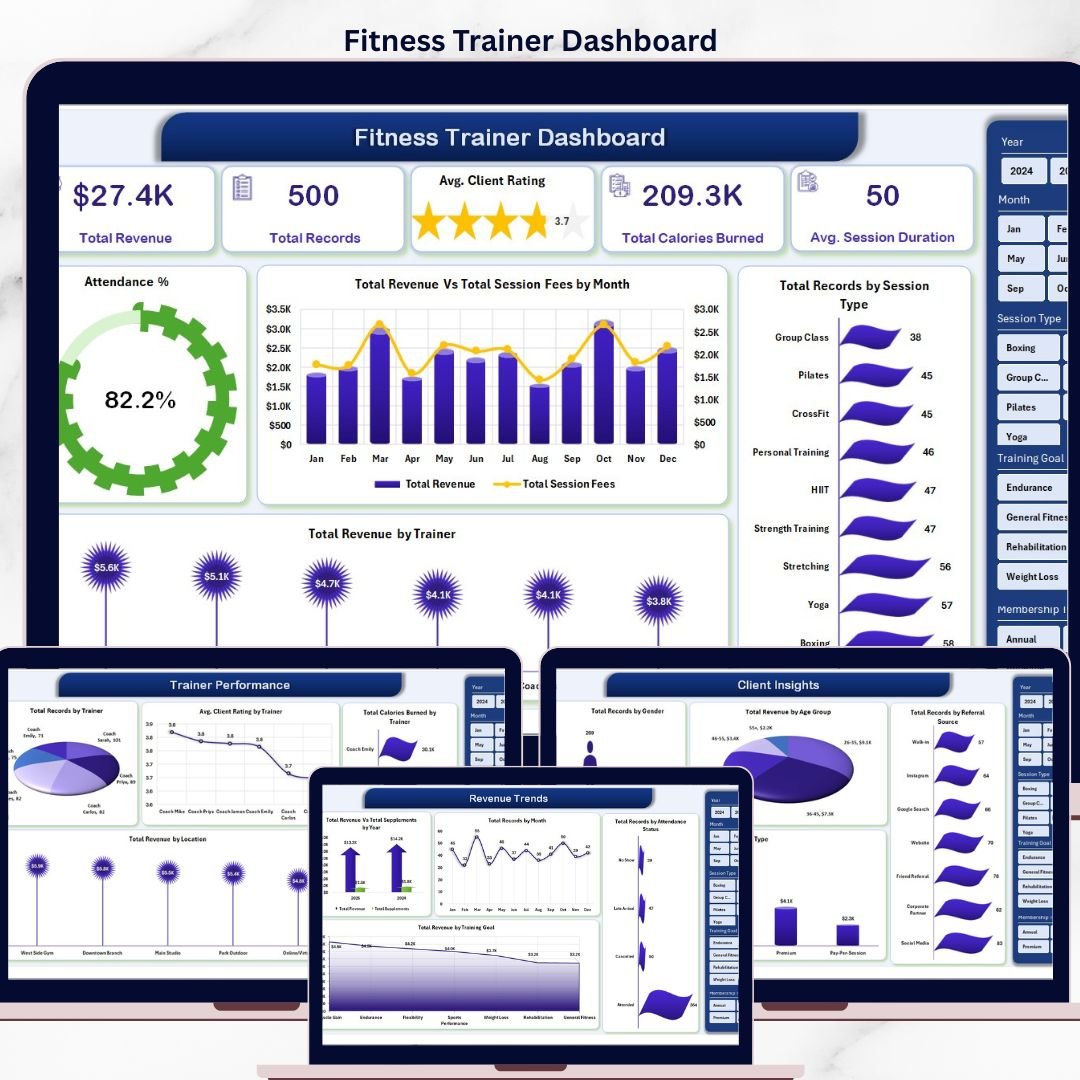
1. Overview Page
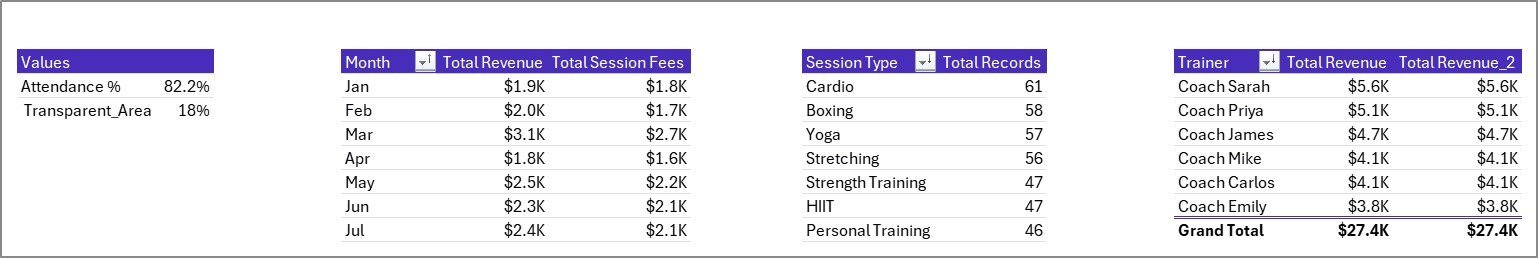
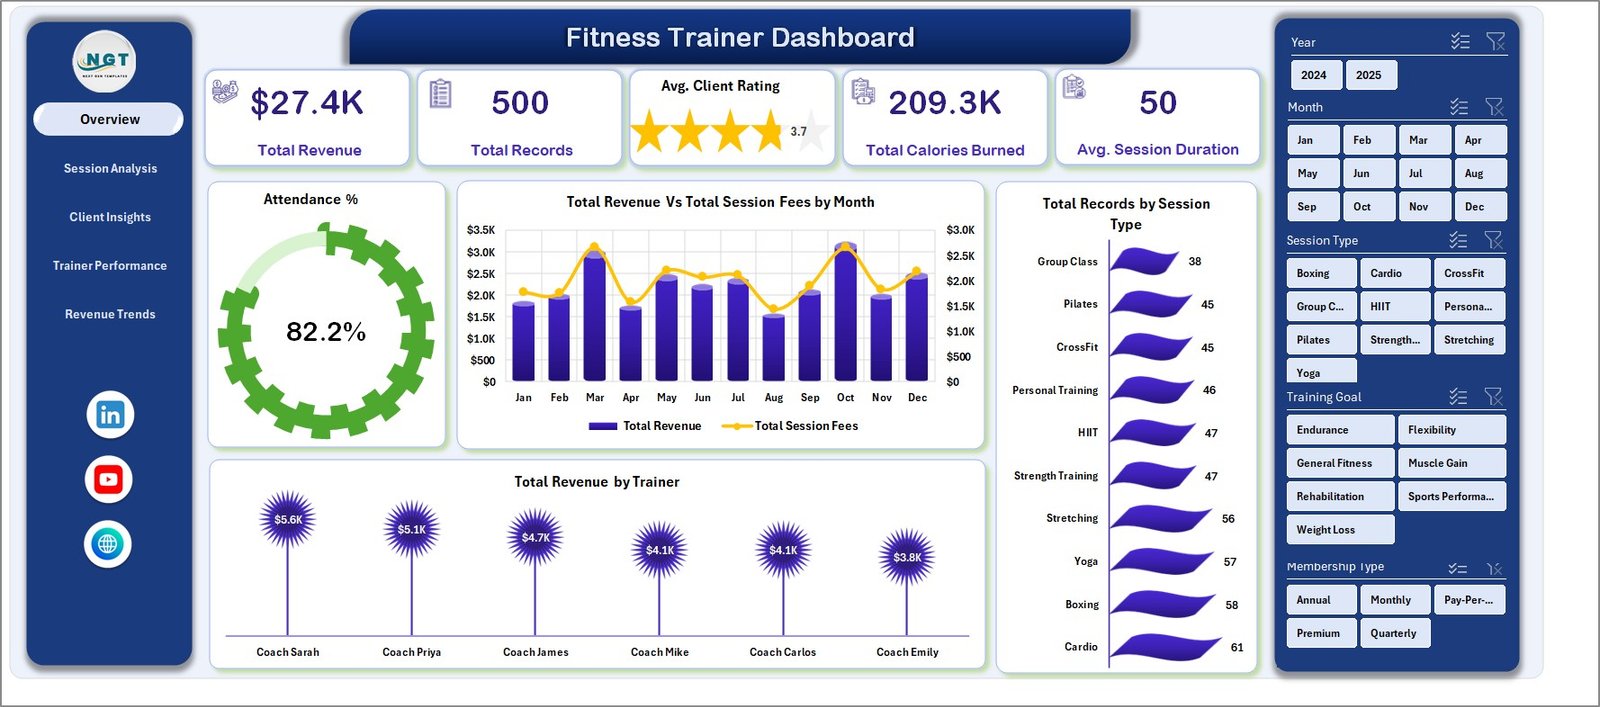
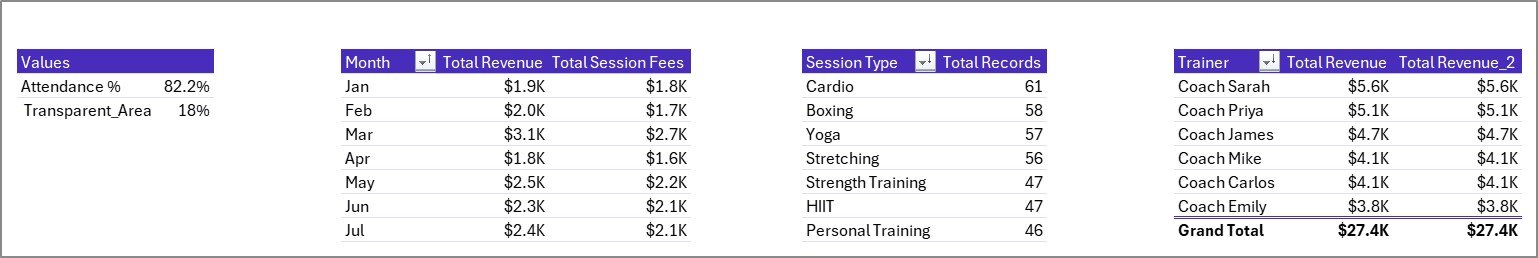
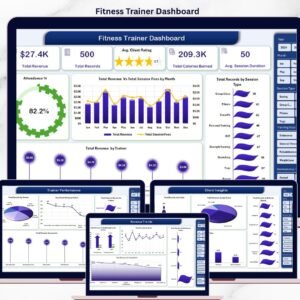
The landing page shows 6 KPI cards at the top: Total Revenue, Total Records, Avg. Client Rating, Total Calories Burned, Avg. Session Duration, and Attendance %. Below the cards, three charts give a high-level view — Total Revenue Vs Total Session Fees by Month (compares monthly revenue against fee collection to spot collection gaps), Total Records by Session Type (shows which session categories dominate your booking volume), and Total Revenue by Trainer (ranks trainers by revenue contribution). Multi-category slicers let you filter the entire page in one click.
Fitness Trainer Dashboard
2. Session Analysis
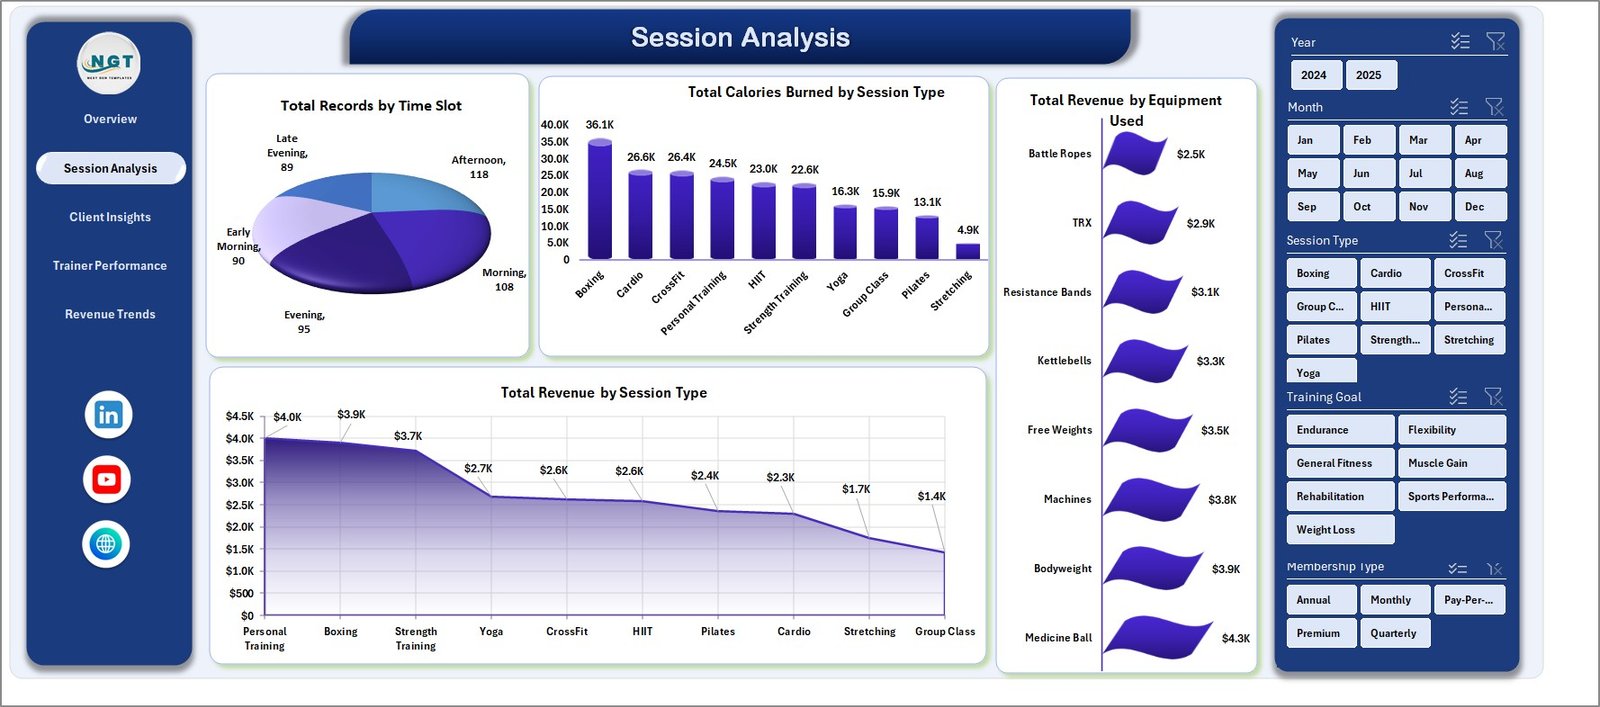
Four charts dedicated to session-level insight — Total Records by Time Slot (identifies peak booking hours), Total Calories Burned by Session Type (shows which session formats drive the most training intensity), Total Revenue by Equipment Used (reveals which equipment categories generate the most billable work), and Total Revenue by Session Type (ranks session categories by revenue share).
Session Analysis
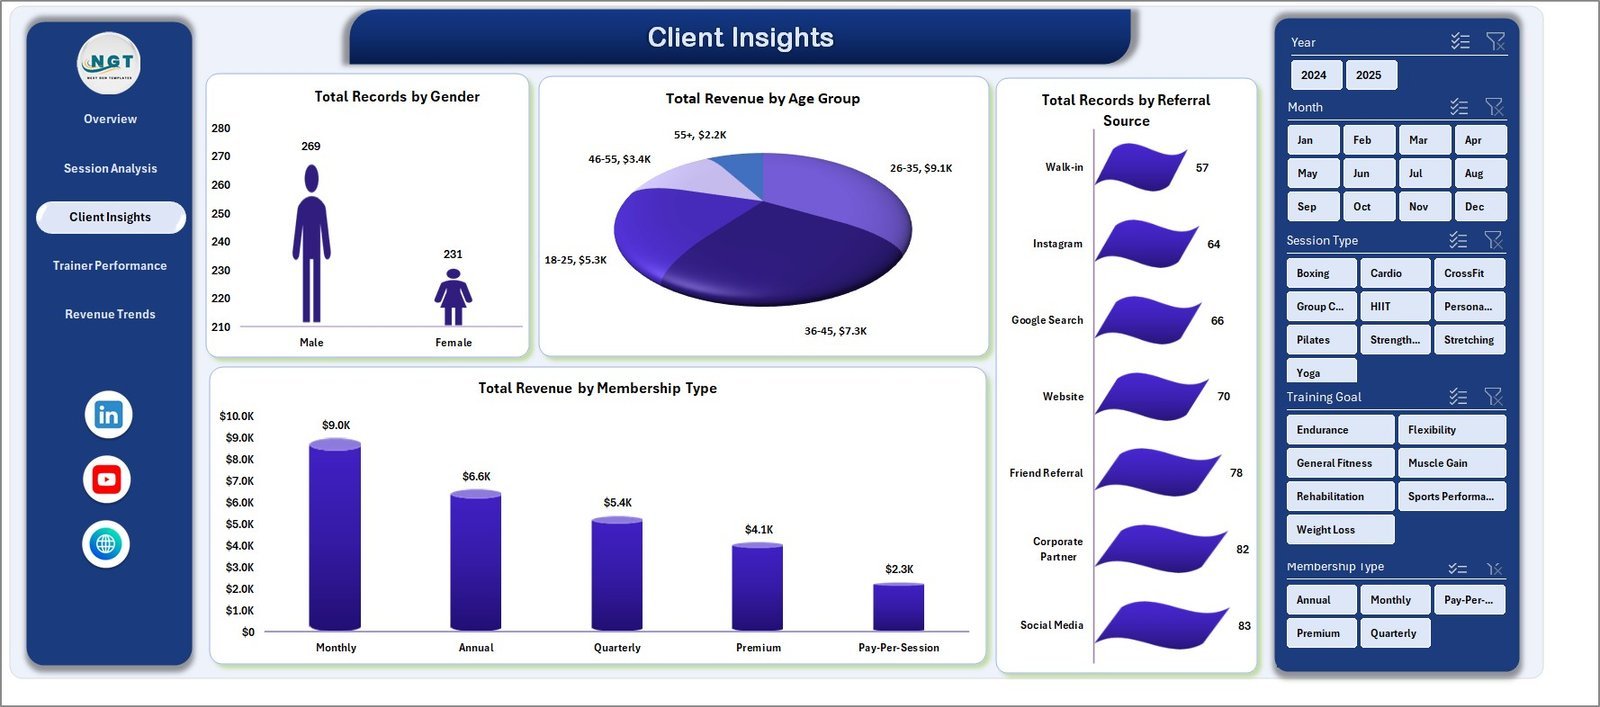
3. Client Insights
Four client-segmentation charts: Total Records by Gender, Total Revenue by Age Group (finds your highest-LTV demographic), Total Records by Referral Source (tells you which marketing channel actually converts), and Total Revenue by Membership Type (compares revenue across monthly, quarterly, and annual plans).

Client Insights
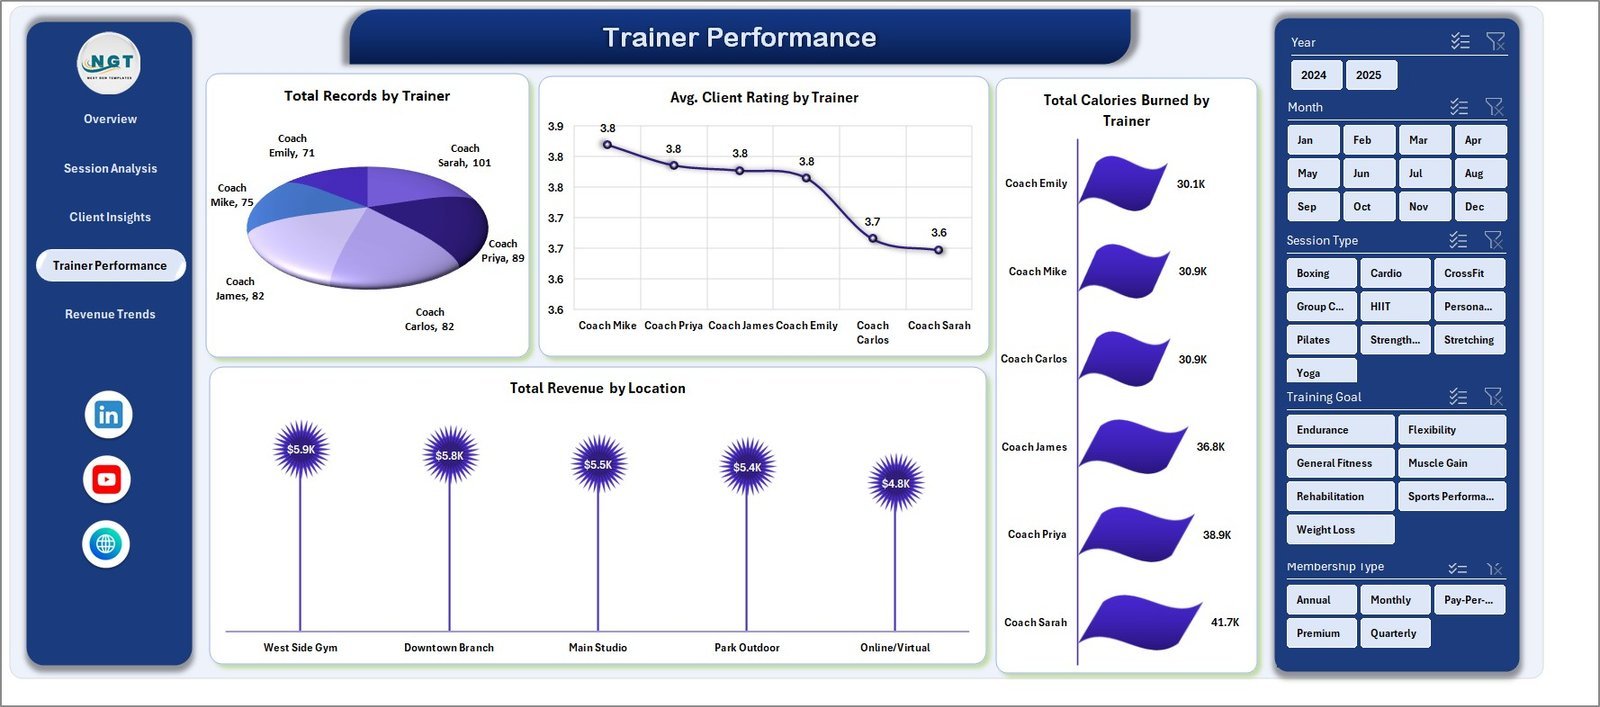
4. Trainer Performance
Everything you need for trainer reviews and commission conversations — Total Records by Trainer, Avg. Client Rating by Trainer, Total Calories Burned by Trainer, and Total Revenue by Location (compares gym-floor, home-visit, and online performance side-by-side).

Trainer Performance
5. Revenue Trends
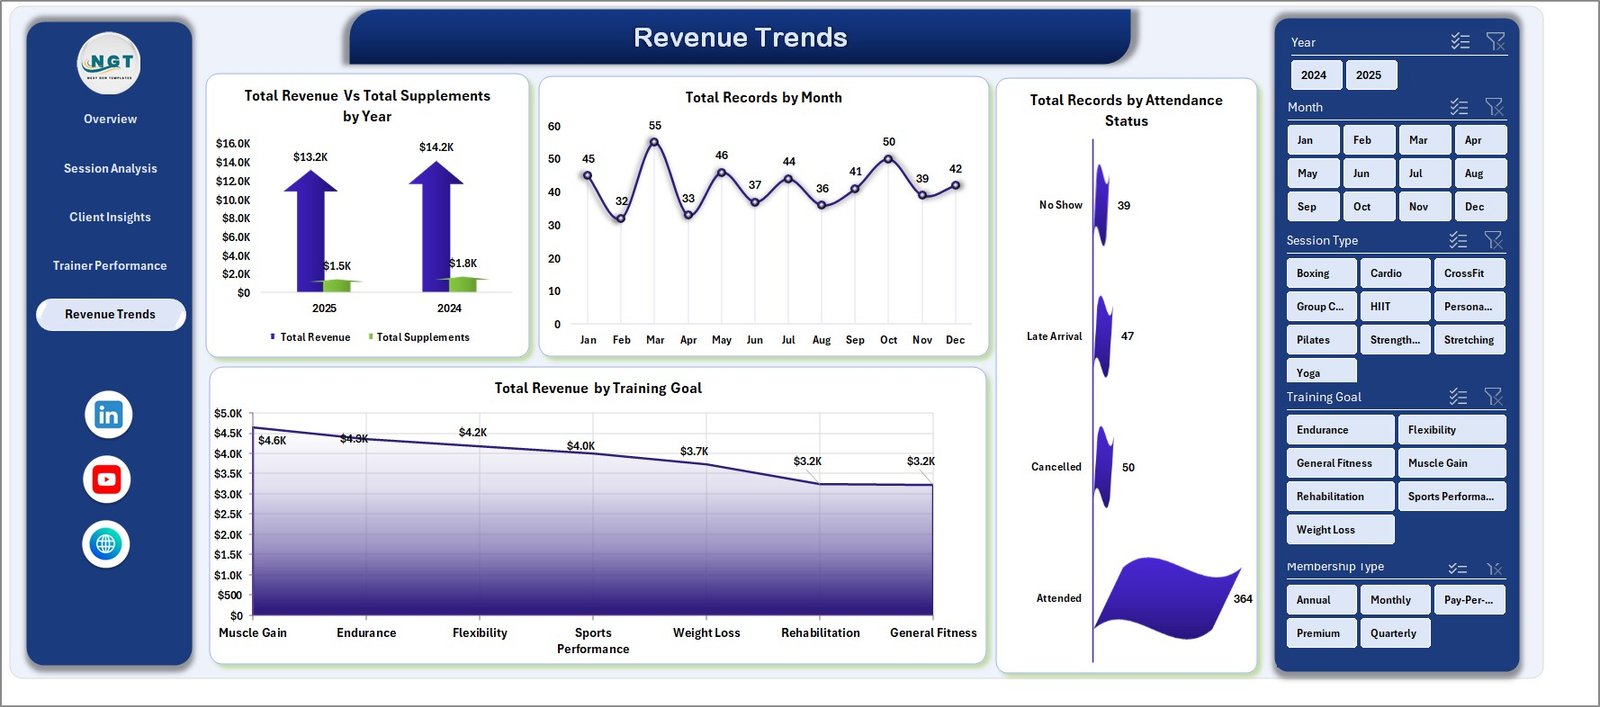
The long-horizon financial view — Total Revenue Vs Total Supplements by Year (tracks how your supplement sales scale alongside training revenue), Total Records by Month (surfaces seasonality), Total Records by Attendance Status (exposes your no-show and cancellation rate), and Total Revenue by Training Goal (compares weight-loss, muscle-gain, endurance, and rehab revenue streams).
Revenue Trends
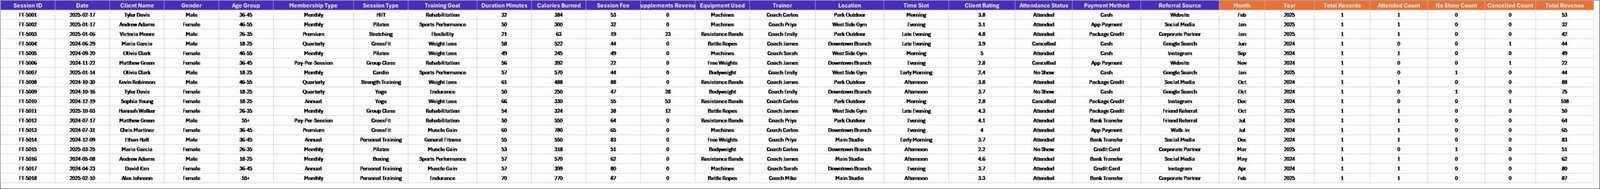
6. Data Sheet
The single source of truth. Add your session records row-by-row in the same format — date, trainer, client, session type, duration, calories, fee, rating, attendance, location, equipment, referral source, training goal, and membership type.

Data Sheet tab
7. Support Sheet
Hidden pivot-table engine that powers every chart and card across all 5 analysis pages. After updating the Data sheet, click Data → Refresh All in the Excel ribbon and every pivot, slicer, and chart updates automatically. You can keep this sheet hidden.
Support sheet tab
📊 Fitness Trainer Dashboard in Excel vs. Google Sheets Equivalent vs. Mindbody / ABC Fitness — Where This Fits
| Feature | Fitness Trainer Dashboard (Excel) | Google Sheets Equivalent | Mindbody / ABC Fitness |
|---|---|---|---|
| Cost | $17.99 one-time | $9-15 one-time | $139-499 / month |
| Platform | Microsoft Excel (offline) | Google Sheets (cloud only) | Web + mobile app |
| Setup time | ✅ Under 10 minutes | ✅ Under 10 minutes | 2-6 weeks onboarding |
| Pivot-powered auto-refresh | ✅ Native Excel pivots | ⚠️ Limited pivot refresh | N/A (proprietary engine) |
| Offline access | ✅ Yes | ❌ Requires internet | ❌ Cloud-dependent |
| Customizable fields | ✅ Full control | ✅ Full control | ❌ Locked schema |
| Per-user fees | ✅ None | ✅ None | ❌ $10-30 per trainer / month |
| Year-1 cost at 3 trainers | $17.99 total | $9-15 total | $1,668-5,988 |
| Ownership | ✅ Yours forever | ✅ Yours forever | ❌ SaaS license |
For fitness trainers and studio owners who want serious reporting without paying enterprise SaaS fees, the Fitness Trainer Dashboard in Excel sits in the sweet spot.
👥 Who This Template Is For — and Who It’s Not For
✅ This template is built for:
- Independent personal trainers tracking 10-500 sessions per month across multiple clients
- Boutique gyms and fitness studios with 2-15 trainers on the floor
- Online fitness coaches running virtual sessions and needing location-split reporting
- Studio managers who run monthly trainer reviews and want rating-and-revenue data in one view
❌ This template is NOT for:
- Large multi-location gym chains needing centralized cloud POS, door access control, and integrated billing
- Teams that need mobile booking for clients or automated payment processing — use Mindbody or ABC Fitness for those
- Users who don’t have Excel 2016 or later (pivot-slicer features require this minimum version)
⚙️ How to Use the Fitness Trainer Dashboard in Excel
- Download and unzip the file, then open it in Microsoft Excel 2016 or later.
- Go to the Data sheet and replace the sample session records with your own data, keeping the same column structure.
- Click Data → Refresh All in the Excel ribbon. Every pivot table in the Support sheet will recalculate automatically.
- Navigate to any of the 5 analysis pages — Overview, Session Analysis, Client Insights, Trainer Performance, or Revenue Trends — and use the slicers to filter the view.
- Right-click the Support sheet tab and Hide if you’d like a cleaner workbook for stakeholders.
💼 Real-World Use Cases
Marco runs a 4-trainer boutique CrossFit studio in Austin. Every Monday morning he opens the Fitness Trainer Dashboard, filters the Overview page by “last week”, and spends exactly 10 minutes reviewing trainer revenue, client ratings, and attendance — the data he used to spend 90 minutes compiling in Mindbody reports.
Priya is a solo personal trainer with 35 active clients across home visits and online sessions. She uses the Revenue Trends page to see how her supplement-referral income is growing vs her session revenue, and the Client Insights page to figure out which referral source (Instagram vs word-of-mouth vs gym partnerships) actually converts to long-term clients.
The Patel family runs a 12-trainer urban fitness chain with 3 locations. They use the Trainer Performance tab during quarterly reviews to compare trainer ratings and revenue side-by-side, and the Location breakdown to decide which studio needs more weekend staffing — without paying $499/month per location for ABC Fitness.
❓ Frequently Asked Questions
What KPIs does the Fitness Trainer Dashboard track?
The Fitness Trainer Dashboard in Excel tracks 6 primary KPIs — Total Revenue, Total Records, Average Client Rating, Total Calories Burned, Average Session Duration, and Attendance % — plus 15 chart-level breakdowns across session type, trainer, location, equipment, age group, gender, referral source, membership type, and training goal.
Does this Excel template require macros or VBA?
No. The Fitness Trainer Dashboard is 100% formula and pivot-table driven. It does not use macros or VBA, so it runs on Excel for Windows, Excel for Mac, and Excel Online with full functionality. Enable editing when you open the file and you’re ready.
How does this compare to Mindbody or ABC Fitness?
Mindbody and ABC Fitness are full booking-and-billing platforms priced at $139-499 per month. The Fitness Trainer Dashboard in Excel is a one-time $17.99 reporting template — it replaces the analytics dashboards inside those tools without replacing the booking layer. Many studios use both.
How long does setup take?
Under 10 minutes. Open the file, paste your session records into the Data sheet, hit Data → Refresh All on the Excel ribbon, and the entire Fitness Trainer Dashboard populates. No onboarding calls, no account creation, no training videos required.
Can I customize the charts and KPI cards?
Yes. Every chart in the Fitness Trainer Dashboard is a standard Excel pivot chart, so you can add or remove fields, change chart types, and adjust colors using the normal Excel ribbon. The Support sheet exposes all pivot sources so you can add new metrics without breaking the existing layout.
Will my data stay private?
Yes. The Fitness Trainer Dashboard runs 100% locally in your copy of Excel. No data is uploaded to any server, no login is required, and no cloud sync happens unless you choose to save the file to OneDrive or SharePoint yourself.
Do I get lifetime updates?
You get the current version of the Fitness Trainer Dashboard forever with no renewals, no subscription, and no expiry. If we release a major version update, you’ll get it free as an existing customer.
👤 About the Author
Built by PK — Microsoft Certified Professional with 15+ years of Excel, Google Sheets, and Power BI experience. Founder of NextGenTemplates, reaching 300K+ subscribers across YouTube channels (@PK-AnExcelExpert, @NextGenTemplates, @NeoTechNavigators). Every template is hand-built and tested before release.
🔗 Explore Related Templates
- Gym Fitness Business Dashboard in Excel — studio-level view with membership, revenue, and class analytics
- CrossFit Gym KPI Scorecard in Excel — scorecard-style monthly performance tracker
- Fitness Industry KPI Scorecard in Google Sheets — cloud-first alternative for collaborative teams
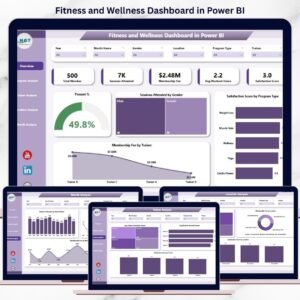
Also available as: Gym Fitness Business Dashboard in Power BI | Gym Fitness Business Dashboard in Google Sheets | Gym Fitness Business Dashboard in HTML
Browse the full Excel Dashboard category for more ready-to-use business templates.
📖 Click here to read the Detailed Blog Post
🎥 Visit our YouTube channel for step-by-step video tutorials
👉 YouTube.com/@NextGenTemplates
Watch the step-by-step video tutorial:


Reviews
There are no reviews yet.