


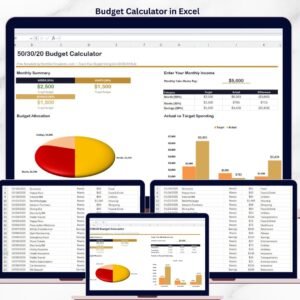
The Budget Calculator in Excel uses the 50/30/20 budgeting rule to split your monthly take-home pay into 3 spending categories — Needs (50%), Wants (30%), and Savings (20%) — with a built-in expense tracker covering 15+ sub-categories. It includes 2 interactive pages, 3 budget allocation cards, a pie chart for budget distribution, and a bar chart comparing target vs actual spending. Setup takes under 5 minutes — enter your monthly income, log expenses, and the calculator auto-updates every chart and summary.
🌍 Join 8,400+ teams in 40+ countries using NextGenTemplates to replace paid SaaS tools with one-time-purchase Excel, Google Sheets, Power BI, and HTML templates.
✅ Instant download · Free template · No subscription · No per-user fees · Lifetime access
🔑 Key Features of Budget Calculator in Excel
📊 50/30/20 Budget Rule Built-In — The calculator automatically divides your monthly take-home pay into Needs (50%), Wants (30%), and Savings (20%) target budgets. Enter your income once and the three allocation cards update instantly with exact dollar amounts for each category.
📈 Target vs Actual Spending Comparison — A grouped bar chart visually compares your target budget against actual spending for Needs, Wants, and Savings. The difference column in the summary table shows exactly how much you are over or under budget in each category — making overspending immediately visible.
🥧 Budget Allocation Pie Chart — A 3-slice pie chart displays your total budget split across Needs, Wants, and Savings with dollar values. This gives you a quick visual snapshot of how your income is distributed before you start spending.
📝 Built-In Expense Tracker with 15+ Sub-Categories — The Data Sheet logs every transaction with Date, Description, Category (Needs/Wants/Savings), Amount, and Sub-Category fields. Sub-categories include Housing, Utilities, Food, Transportation, Insurance, Healthcare, Retirement, Entertainment, Shopping, Fitness, Hobbies, Food & Drink, Debt, and Savings — covering virtually every personal expense type.
💰 Automatic Monthly Summary — Three KPI-style cards at the top of the dashboard page display the target budget for Needs, Wants, and Savings. A separate comparison table shows Category, Target, Actual, and Difference — updating automatically as you log expenses in the Data Sheet.
🔄 Zero Formulas to Edit — All calculations are pre-built with Excel formulas. Change your monthly income and the entire dashboard recalculates. Add an expense row and the summary table and charts refresh automatically. No VBA, no macros, no pivot tables needed.
Explore more Excel Tracker Templates and Excel Dashboard Templates on NextGenTemplates for budgeting, finance, and expense tracking solutions.
📦 What’s Inside the Budget Calculator in Excel
📄 Dashboard Page — The main page displays the Monthly Summary section with 3 budget allocation cards (Needs $2,500 / Wants $1,500 / Savings $1,000 based on $5,000 sample income), a Budget Allocation pie chart, the Enter Your Monthly Income input field, a Category comparison table (Target vs Actual vs Difference for Needs, Wants, and Savings), and an Actual vs Target Spending bar chart.
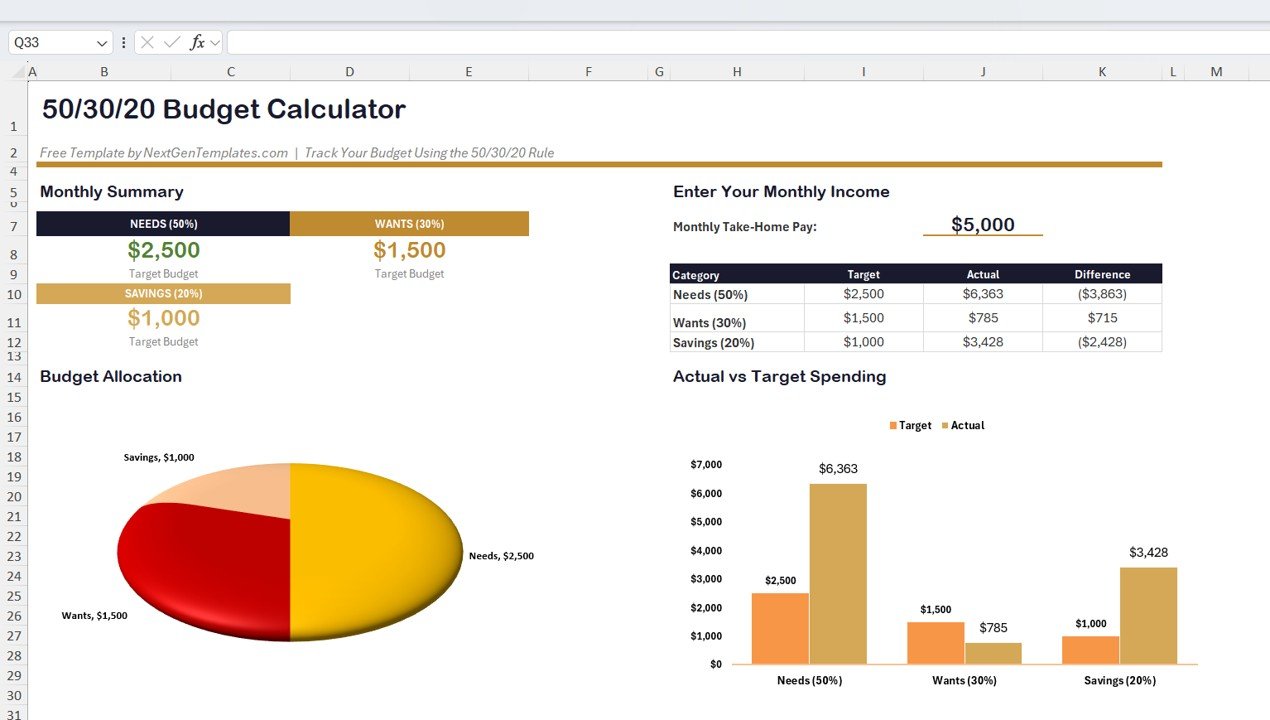 Budget Calculator in Excel – Dashboard Page
📄 Data Sheet — A structured transaction log with 5 columns: Date, Description, Category, Amount, and Sub-Category. Sample data includes 35+ rows covering expenses from January through April 2025 across all three budget categories. Categories map to Needs, Wants, or Savings, while Sub-Categories provide granular detail like Housing, Utilities, Food, Transportation, Entertainment, Retirement, and more.
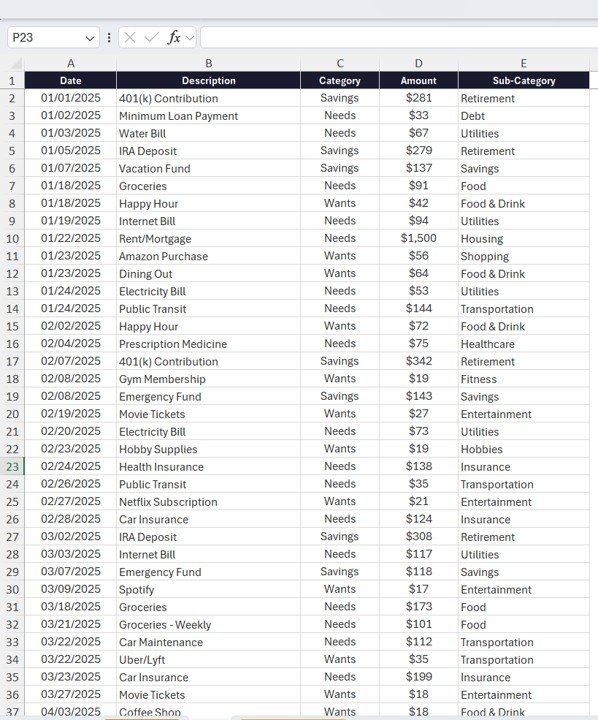 Budget Calculator in Excel – Data Sheet
📊 Budget Calculator in Excel vs. Google Sheets Budget Template vs. YNAB — Where This Fits
| Feature | Budget Calculator in Excel | Google Sheets Budget Template | YNAB (You Need a Budget) |
|---|---|---|---|
| Cost | $0 free download | Free (with Google account) | $14.99/month ($99/year) |
| Platform | Microsoft Excel (desktop) | Google Sheets (browser) | Web + Mobile app |
| Setup Time | Under 5 minutes | 10-15 minutes | 30+ minutes with bank linking |
| 50/30/20 Rule Built-In | ✅ Yes — automatic allocation | ❌ Manual setup needed | ❌ Custom categories only |
| Bank Account Sync | ❌ Manual entry | ❌ Manual entry | ✅ Auto-sync with banks |
| Offline Access | ✅ Full offline use | ❌ Requires internet | ❌ Requires internet |
| Data Privacy | ✅ 100% local — your file, your data | Stored on Google servers | Stored on YNAB servers |
| Customizable Fields | ✅ Fully editable Excel file | ✅ Editable | Limited customization |
| Year-1 Cost (1 user) | $0 | $0 | $99/year |
For individuals who want a structured 50/30/20 budget tracker without paying monthly subscriptions or sharing financial data with third-party servers, the Budget Calculator in Excel sits in the sweet spot.
👥 Who This Template Is For — and Who It’s Not For
✅ This template is built for:
- Individuals and families who want to follow the 50/30/20 budgeting method in Excel
- Working professionals tracking monthly take-home pay against spending categories
- Students and young adults starting their first personal budget
- Anyone who prefers offline, local-file budgeting over cloud-based subscription apps
❌ This template is NOT for:
- Users who need automatic bank account syncing and real-time transaction imports
- Businesses requiring multi-user expense approval workflows
- People looking for investment portfolio tracking or debt payoff calculators (see Debt Payoff Calculator in Excel instead)
⚙️ How to Use the Budget Calculator in Excel
- Download and open the Budget Calculator in Excel file in Microsoft Excel
- Enter your monthly take-home pay in the “Monthly Take-Home Pay” field on the Dashboard page — the 50/30/20 allocation cards update automatically
- Go to the Data Sheet and start logging your expenses with Date, Description, Category (Needs/Wants/Savings), Amount, and Sub-Category
- Return to the Dashboard page to see your Target vs Actual comparison table and charts update in real time
- Review the Difference column to identify categories where you are overspending or underspending
- Adjust your spending habits based on the visual insights from the pie chart and bar chart
💼 Real-World Use Cases
Priya is a 28-year-old software developer in Bangalore earning ₹80,000 per month. She uses the Budget Calculator in Excel to split her salary into Needs (rent, groceries, utilities), Wants (dining out, subscriptions, shopping), and Savings (mutual funds, emergency fund). Each weekend she spends 5 minutes logging expenses in the Data Sheet. The Difference column on the Dashboard helped her realize she was overspending on food delivery by ₹4,000 per month — money she now redirects to her emergency fund.
James is a recent college graduate in Texas with a $3,200 monthly paycheck. He downloaded the free Budget Calculator in Excel to build his first-ever budget. The 50/30/20 rule gave him a clear framework: $1,600 for Needs (rent, car payment, insurance), $960 for Wants (entertainment, dining), and $640 for Savings. After 3 months of tracking, he identified that his “Wants” spending was actually 42% of his income — the bar chart made the overspending impossible to ignore.
Maria runs a household of four in Madrid. She uses the Budget Calculator to track family expenses across 15 sub-categories. The pie chart gives her husband a quick visual of where the family budget goes each month, and the comparison table helps them agree on spending priorities during their monthly financial review.
❓ Frequently Asked Questions
What is the 50/30/20 budget rule in Excel?
The 50/30/20 budget rule allocates 50% of your monthly take-home pay to Needs, 30% to Wants, and 20% to Savings. The Budget Calculator in Excel automates this split — enter your income and the three budget category cards calculate target amounts instantly.
Is the Budget Calculator in Excel really free?
Yes. The Budget Calculator in Excel is a completely free template from NextGenTemplates. Download it instantly, use it offline in Microsoft Excel, and customize it without any subscription or hidden fees.
How many expense categories does this budget tracker support?
The Budget Calculator in Excel tracks 3 main categories (Needs, Wants, Savings) and 15+ sub-categories including Housing, Utilities, Food, Transportation, Insurance, Healthcare, Retirement, Entertainment, Shopping, Fitness, Hobbies, Food and Drink, Debt, and Savings.
Can I use this budget calculator in Google Sheets?
This template is built for Microsoft Excel. If you prefer Google Sheets, explore the Weekly Expense Tracker in Google Sheets for a similar budgeting experience in the browser.
How does this compare to paid budgeting apps like YNAB or Mint?
The Budget Calculator in Excel is free and keeps your financial data 100% local on your computer. YNAB costs $99/year and Mint relies on ad-supported bank syncing. For users who value privacy and simplicity over automatic transaction imports, this Excel template is the better fit.
Does this template work on Mac Excel?
Yes. The Budget Calculator in Excel uses standard Excel formulas and charts with no VBA or macros. It works on Excel for Windows, Excel for Mac, and Excel for Microsoft 365.
How long does it take to set up this budget calculator?
Setup takes under 5 minutes. Enter your monthly income on the Dashboard page, then start logging expenses in the Data Sheet. All charts and summary cards update automatically — no formulas to edit.
👤 About the Author
Built by PK — Microsoft Certified Professional with 15+ years of Excel, Google Sheets, and Power BI experience. Founder of NextGenTemplates, reaching 300K+ subscribers across YouTube channels (@PK-AnExcelExpert, @NextGenTemplates, @NeoTechNavigators). Every template is hand-built and tested before release.
🔗 Explore Related Templates
📌 Personal Finance Dashboard in Excel — Track income, expenses, savings, budgets, and transaction status across 5 interactive dashboard pages with pivot charts and slicers. $17.99
📌 Weekly Expense Tracker in Excel — Log and analyze weekly expenses with automatic category totals and visual spending breakdown. Free
📌 Savings Goal Planner in Excel — Plan and track multiple savings goals with visual progress indicators and monthly tracking. $4.99
📌 Also available: Personal Finance Dashboard in Power BI | Personal Finance Dashboard in HTML
📖 Click here to read the Detailed Blog Post
🎥 Visit our YouTube channel for step-by-step video tutorials
👉 YouTube.com/@NextGenTemplates


Reviews
There are no reviews yet.