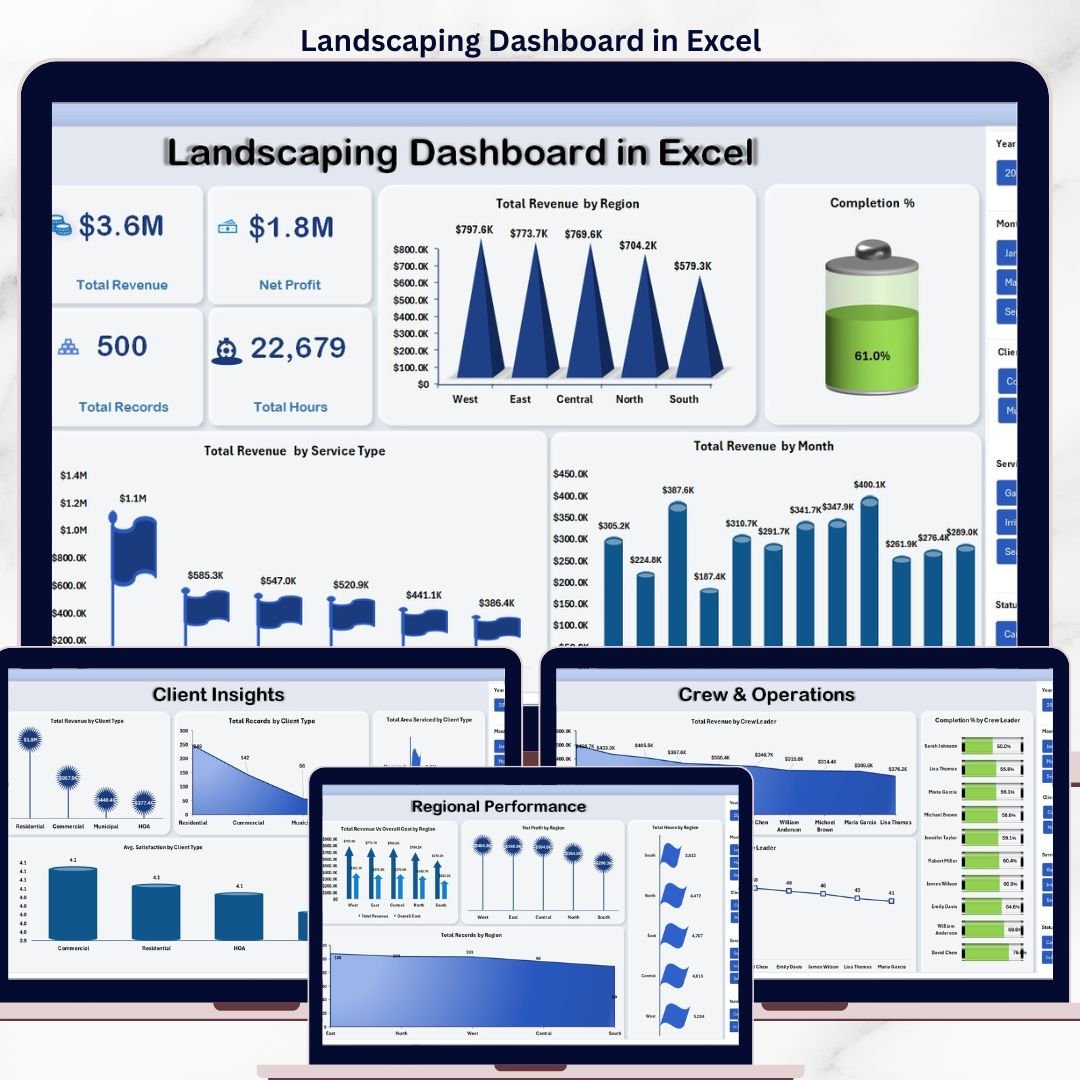


The Landscaping Dashboard in Excel tracks 5 headline KPIs across 5 interactive pages, with 14 pre-built charts, multiple slicers for instant filtering, and a pivot-driven Support Sheet. Setup takes under 10 minutes — paste your job records into the Data Sheet, click Refresh All, and every card, chart, and crew view rebuilds automatically.
🌍 Join 8,400+ teams in 40+ countries using NextGenTemplates to replace paid SaaS tools with one-time-purchase Excel, Google Sheets, Power BI, and HTML templates.
✅ Instant download · One-time payment · No subscription · No per-user fees · Lifetime access

Landscaping Dashboard in Excel
🔑 Key Features of the Landscaping Dashboard in Excel
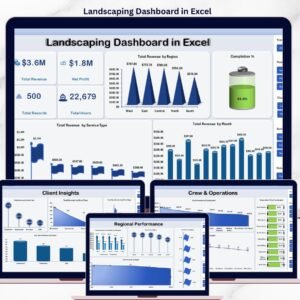
🌱 5 KPI cards on the Overview page — Total Revenue, Net Profit, Total Records, Total Hours, and Completion %. Every card is wired to a pivot measure, so the numbers recalculate the moment you refresh the workbook. These are the same headline metrics landscaping business owners use to brief management on revenue, margin, and crew productivity.
📊 14 pivot-driven charts across 5 analysis pages covering Overview, Service Analysis, Client Insights, Regional Performance, and Crew & Operations. Each chart is anchored to a pivot in the hidden Support Sheet, so you never touch chart settings manually — refresh the workbook and the visuals rebuild in one click.
🧭 Multiple slicers for fast, filtered views let you drill from a company-wide view down to a single service type, client type, region, or crew leader in two clicks. Built for landscaping owners, operations managers, and crew supervisors who need different slices of the same dataset.
🗂️ Structured Data Sheet and hidden Support Sheet — the Data Sheet holds every job record (service type, hours, area serviced, revenue, cost, profit, client type, region, crew leader, satisfaction); the Support Sheet holds every pivot. Keep the Support Sheet hidden and your end users only ever see the polished dashboard.
🖼️ Built entirely in native Excel — no macros, no add-ins, no monthly fees. Opens in Microsoft Excel 2016 and later, Excel for Mac, and Excel on the web.
📦 What’s Inside the Landscaping Dashboard in Excel
📈 Overview Page — 5 KPI cards paired with three trend charts: Total Revenue by Region, Total Revenue by Service Type, and Total Revenue by Month. This is the page you show ownership each month.

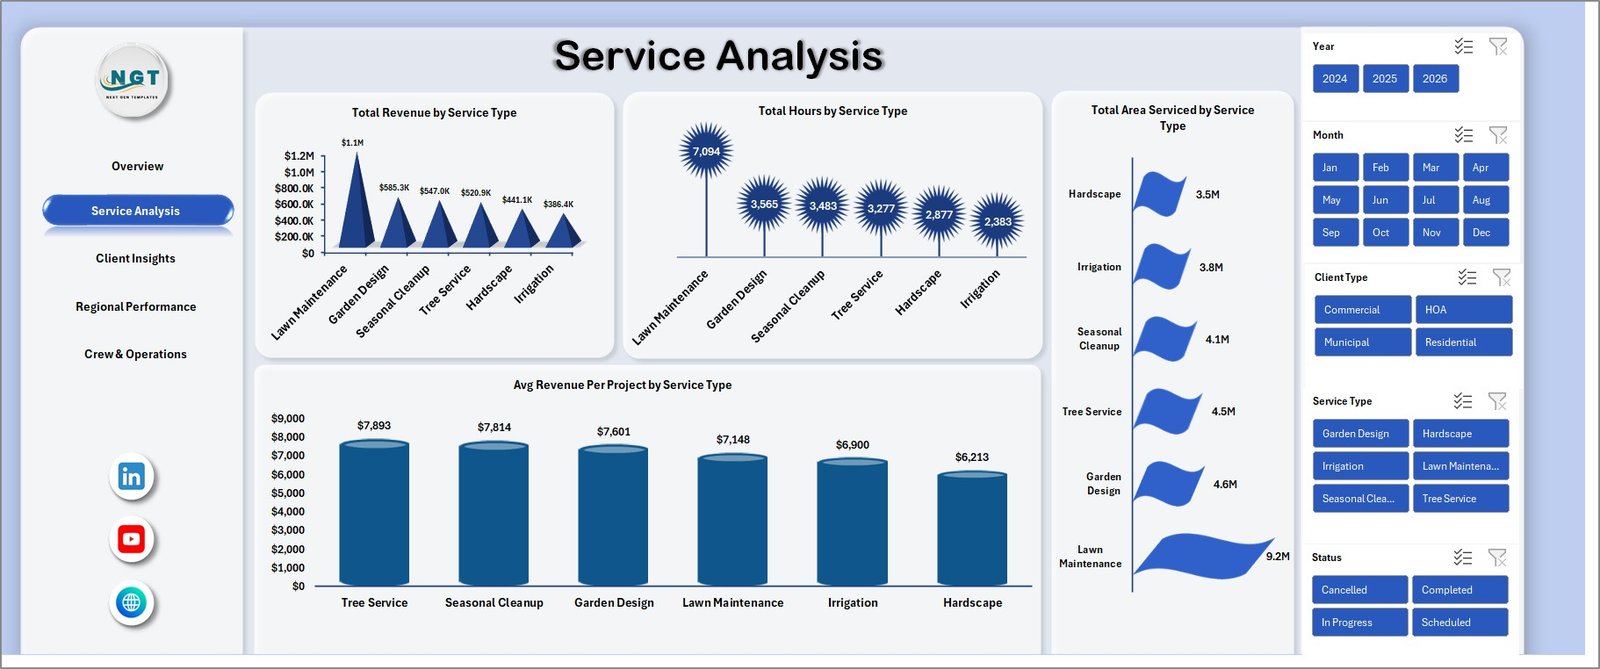
Service Analysis
🔧 Service Analysis Page — compare how different services (lawn care, landscape design, hardscaping, irrigation, snow removal) perform: Total Revenue by Service Type, Total Hours by Service Type, Total Area Serviced by Service Type, and Avg Revenue Per Project by Service Type.

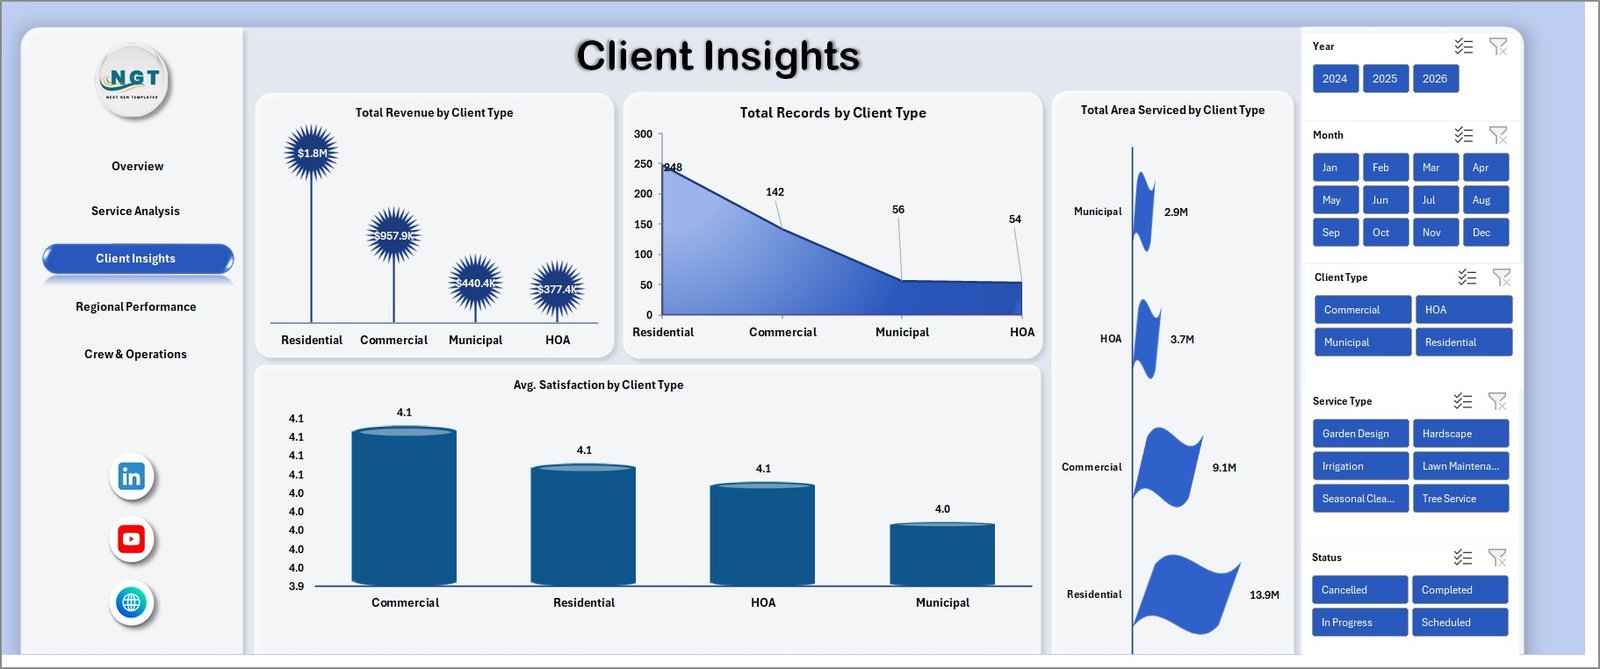
Client Insights
👥 Client Insights Page — split your book across residential, commercial, municipal, and HOA clients with Total Revenue by Client Type, Total Records by Client Type, Total Area Serviced by Client Type, and Avg Satisfaction by Client Type. The satisfaction view is the leading indicator of churn.
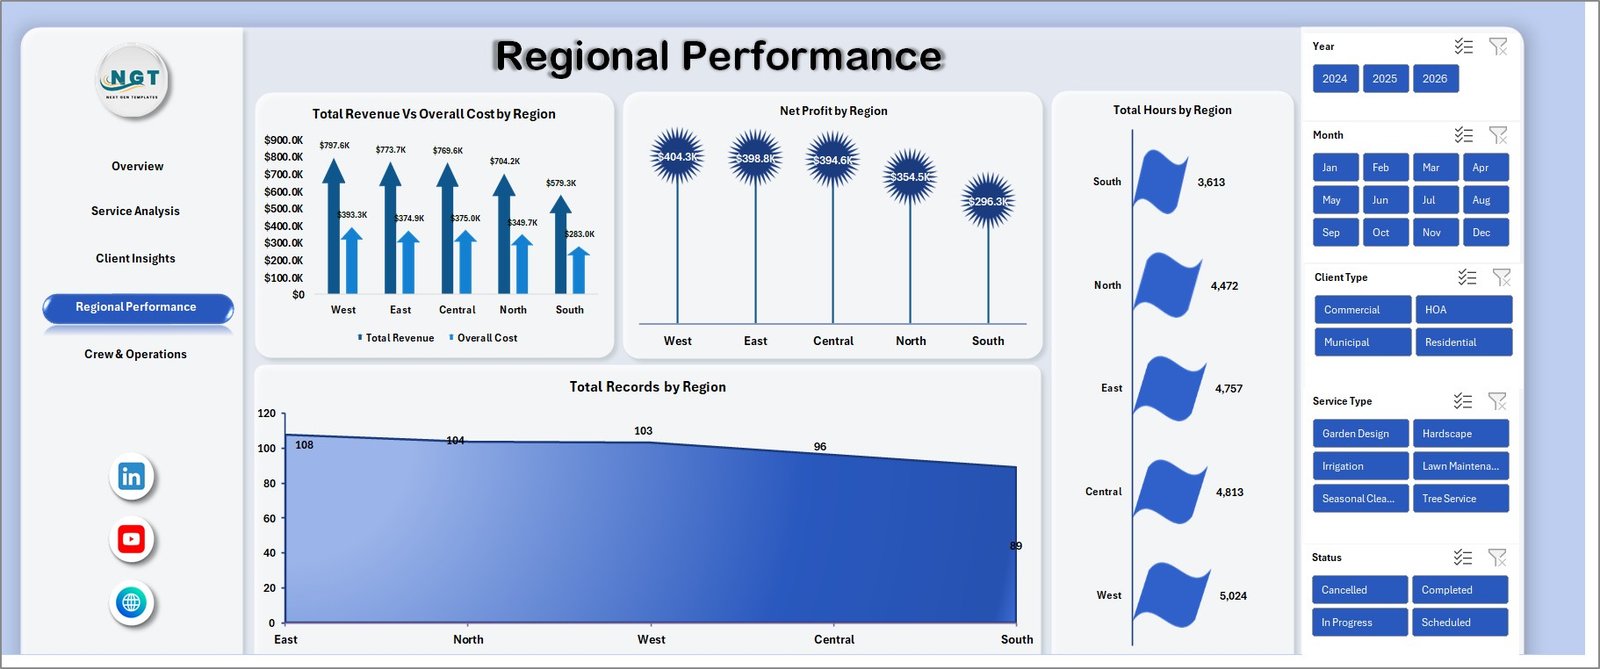
Regional Performance
📍 Regional Performance Page — Total Revenue Vs Overall Cost by Region, Net Profit by Region, Total Hours by Region, and Total Records by Region. Perfect for multi-location landscaping businesses deciding where to invest the next truck or crew.
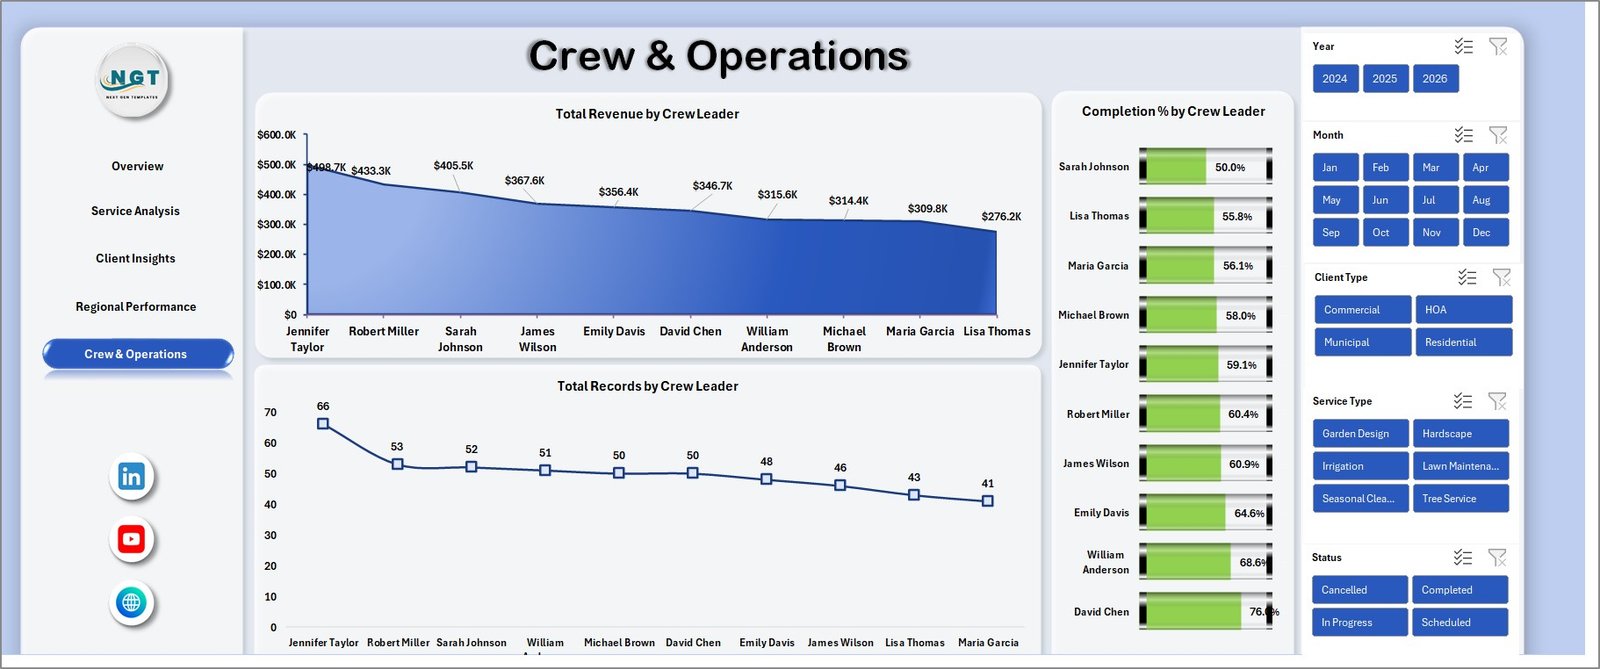
Crew & Operations
👷 Crew & Operations Page — benchmark crew leaders on Total Revenue by Crew Leader, Total Records by Crew Leader, and Completion % by Crew Leader. The completion % view is the most actionable — it surfaces which crews consistently finish jobs on schedule and which need coaching.

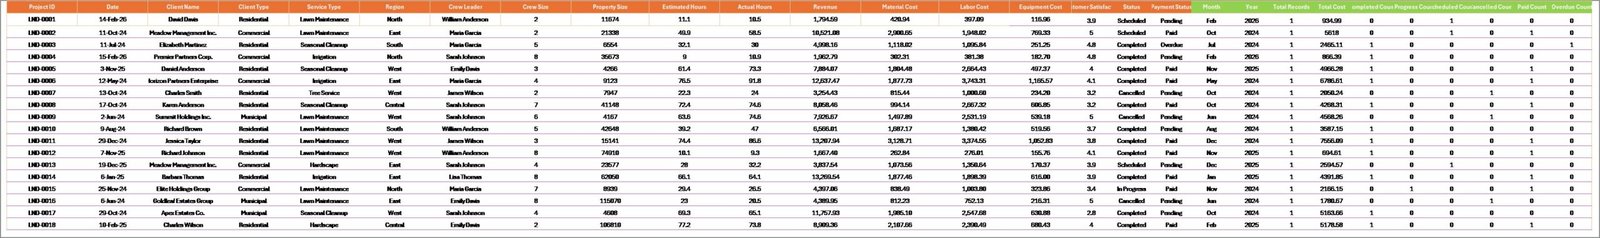
Data Sheet tab
📋 Data Sheet — one flat table where you replace the sample records with your own job data. Keep the column order intact and every pivot, card, and chart updates when you click Refresh All.
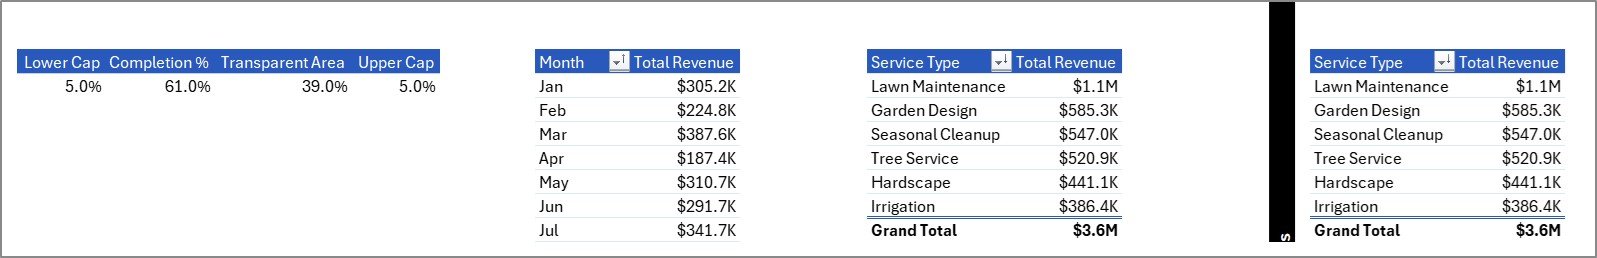
Support sheet tab
🧮 Support Sheet — holds every pivot table that drives the dashboard. Hide this tab in production so stakeholders only see the polished pages.
📊 Landscaping Dashboard in Excel vs. Google Sheets Equivalent vs. Paid Landscaping SaaS
| Feature | Landscaping Dashboard in Excel | Google Sheets equivalent | Paid Landscaping SaaS (Jobber / LMN / Aspire) |
|---|---|---|---|
| Cost | $17.99 one-time | $9.99–$14.99 one-time | $39–$299 / user / month |
| Platform | Microsoft Excel (desktop + web + Mac) | Google Sheets (browser only) | Cloud SaaS only |
| Setup time | Under 10 minutes | Under 15 minutes | 2–8 weeks onboarding |
| Works offline | ✅ | ❌ | ❌ |
| Share with leadership | ✅ Email / OneDrive / SharePoint | ✅ Share link | ✅ Paid seat per viewer |
| Customizable fields | ✅ Fully editable | ✅ Fully editable | ⚠️ Vendor-controlled |
| Crew leader benchmarking | ✅ Out of the box | ✅ | ⚠️ Higher tier only |
| Year-1 cost at 5 users | $17.99 | ~$14.99 | $2,340–$17,940 |
| Vendor lock-in | ❌ None | ❌ None | ✅ Export fees common |
For landscaping business owners who want crew-level, service-level, and regional visibility without paying $2K–$18K a year for a SaaS field service platform, the Landscaping Dashboard in Excel sits in the sweet spot.
👥 Who This Template Is For — and Who It’s Not For
✅ This template is built for:
- Landscaping and lawn care companies with 2–30 crews serving residential, commercial, and HOA clients
- Landscape design and build firms wanting service-mix and regional profitability in one view
- Hardscaping and irrigation contractors tracking job-level revenue, hours, and area serviced
- Multi-location landscaping operations benchmarking regional performance and crew leaders
- Landscaping operations managers presenting monthly performance decks to ownership
❌ This template is NOT for:
- Solo lawn care operators who need field scheduling and invoicing (use Jobber or Housecall Pro)
- Teams needing route optimization, GPS tracking, or real-time crew dispatch (use LMN or Aspire)
- Companies requiring SOC 2-audited, SSO-gated data access in a cloud platform
⚙️ How to Use the Landscaping Dashboard in Excel
- Download the zip file and unzip it to your preferred folder.
- Open the Landscaping Dashboard in Excel file in Microsoft Excel 2016 or later.
- Go to the Data Sheet and replace the sample job records with your own data — keep the same column order.
- Click Data → Refresh All in the Excel ribbon. Every pivot table, card, and chart updates in one pass.
- Use the slicers on each page to filter by region, service type, client type, or crew leader.
- Right-click the Support Sheet tab and hide it before sharing the workbook with ownership.
💼 Real-World Use Cases
Daniel owns a 25-crew commercial landscaping company in North Carolina. He uses the Landscaping Dashboard in Excel to track monthly revenue by service type, benchmark crew leaders on completion %, and spot which regions have the widest revenue-vs-cost gap. His Monday leadership meeting now runs off one file instead of three spreadsheets.
Maria is the operations manager at a lawn care franchise with 8 locations. She drops the week’s job data into the Data Sheet, refreshes the workbook, and walks the franchise owner through Net Profit by Region. The regional view surfaced a location where hours logged were high but completion % was under 80% — a coaching opportunity she would have missed otherwise.
James is an independent landscaping consultant. He uses the same Excel file across three client landscaping companies — each gets a copy with their own data. He’s replaced a $199/user/month field service SaaS with a one-time $17.99 purchase and reports nearly identical insight quality.
❓ Frequently Asked Questions
What KPIs does the Landscaping Dashboard in Excel track?
The Landscaping Dashboard in Excel tracks 5 headline KPIs — Total Revenue, Net Profit, Total Records, Total Hours, and Completion % — plus 14 chart-level metrics spanning service type, client type, region, and crew leader. All metrics update automatically when you replace sample data with your own.
How long does setup take?
Setup takes under 10 minutes. Paste your job records into the Data Sheet, click Data → Refresh All, and every KPI card, chart, and slicer updates in one pass. No macros, no coding.
Which version of Excel do I need?
The Landscaping Dashboard in Excel runs on Microsoft Excel 2016 or later on Windows and Mac, and on Excel for the web with any Microsoft 365 subscription. It uses native pivot tables and slicers — no add-ins, macros, or plugins.
How does this compare to Jobber, LMN, or Aspire?
Jobber, LMN, and Aspire are strong field service platforms for scheduling and invoicing, but they cost $39–$299 per user per month. For a team of 5, that’s $2,340–$17,940 a year. The Landscaping Dashboard in Excel is $17.99 one-time and covers the performance-reporting layer most landscaping firms need.
Can I customize the KPIs, charts, and slicers?
Yes. Every pivot table, chart, and slicer in the Landscaping Dashboard in Excel is fully editable. Add new metrics, change date ranges, rename categories, or extend the Data Sheet with extra columns.
Does it work for multi-location landscaping companies?
Yes. The Landscaping Dashboard in Excel scales from single-location crews to multi-state landscaping operations. The Regional Performance and Crew & Operations pages are specifically designed for multi-crew, multi-region reporting.
Do I get future updates?
Yes. Every NextGenTemplates purchase includes free updates to the same template file.
👤 About the Author
Built by PK — Microsoft Certified Professional with 15+ years of Excel, Google Sheets, and Power BI experience. Founder of NextGenTemplates, reaching 300K+ subscribers across YouTube channels (@PK-AnExcelExpert, @NextGenTemplates, @NeoTechNavigators). Every template is hand-built and tested before release.
🔗 Explore Related Templates
🌳 Landscaping Services Dashboard in Excel — alternative Excel view of landscaping operations with different KPI emphasis.
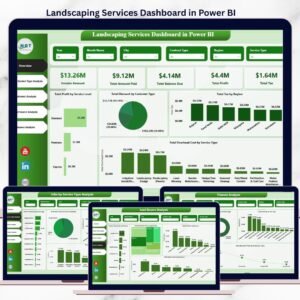
📊 Landscaping Services Dashboard in Power BI — same analytics in Power BI with interactive drill-through.
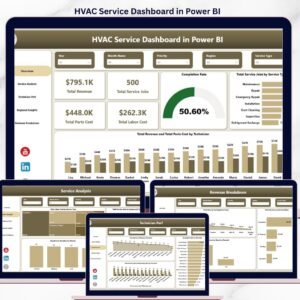
🛠️ HVAC Service Dashboard in Power BI — same layout pattern for HVAC service businesses.
🏗️ Construction Project Cost Dashboard in Google Sheets — project-cost view for adjacent trades.
Also available as: Landscaping Services KPI Dashboard in Power BI for teams on the Power BI stack.
Browse the full Excel Dashboard Templates library for 200+ industry-specific dashboards.
📖 Click here to read the Detailed Blog Post
Watch the step-by-step video tutorial:
🎥 Visit our YouTube channel for step-by-step video tutorials
👉 YouTube.com/@NextGenTemplates
📅 Last updated: April 2026


Reviews
There are no reviews yet.