



Renovating an office is more than just moving furniture—it’s a strategic project that requires precision, oversight, and timely execution. The Office Renovation Project Dashboard in Power BI is a comprehensive, Excel-powered project tracking solution designed to help project managers, facility teams, and contractors streamline every phase of renovation management.
Whether you’re handling a single floor redesign or a full office overhaul across multiple locations, this ready-to-use Power BI dashboard ensures you’re always in control—monitoring budget, tracking task progress, evaluating contractor performance, and identifying cost variances in real time.
🧰 Key Features of the Office Renovation Project Dashboard
This dashboard is structured into five interactive Power BI pages, each offering deep insight into a different aspect of your renovation:
📌 1. Overview Page – Executive Summary
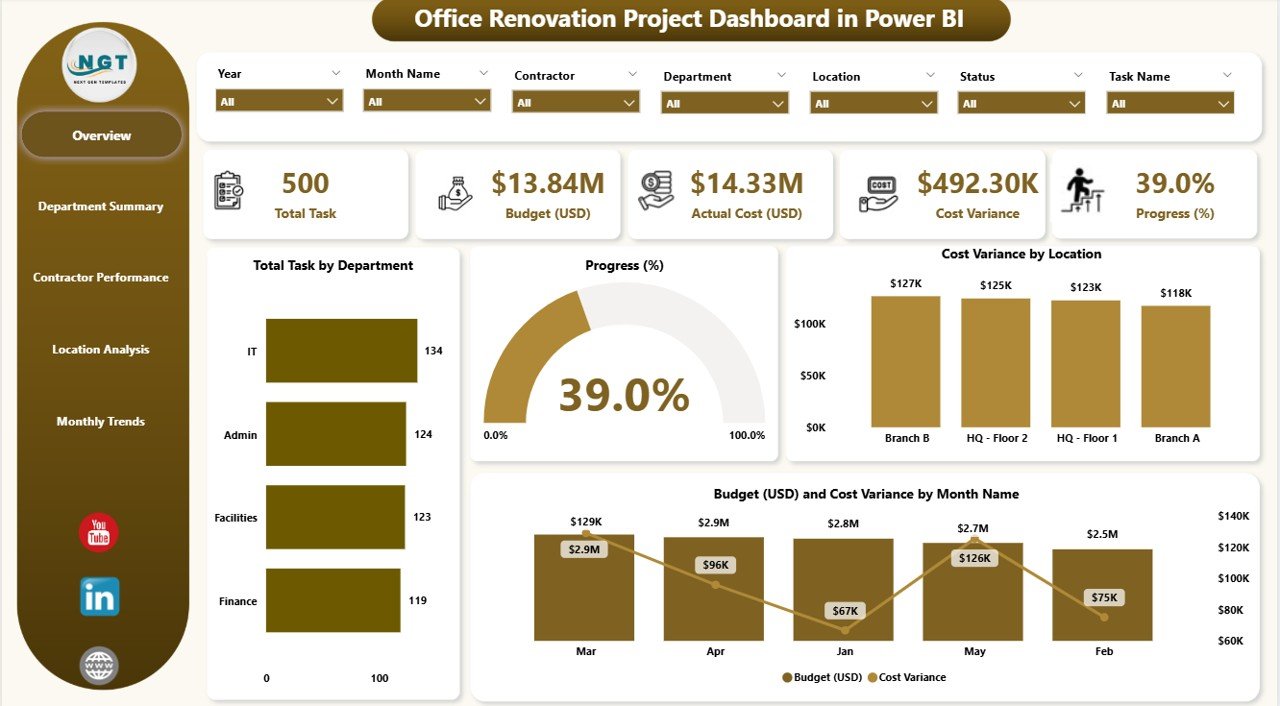
7 Slicers: Filter by department, contractor, task, location, etc.
5 KPI Cards:
Total Tasks by Department
Overall Progress (%)
Cost Variance by Location
Budget (USD)
Cost Variance by Month
📈 Provides a high-level snapshot of budget adherence and project execution status.
🏢 2. Department Summary – Track Department-Wise Execution
7 Slicers for department-specific analysis
4 Charts:
Cost Variance by Department
Progress (%) by Department
Status Breakdown of Department Tasks
Budget vs Cost Variance
🎯 Identify which departments are on schedule and which are lagging behind.
🧱 3. Contractor Performance – Analyze Vendor Outputs
7 Slicers for contractor, department, and location views
3 Charts:
Cost Variance by Contractor
Actual Cost (USD) by Contractor
Progress (%) by Contractor
🛠️ Great for holding vendors accountable and identifying inefficiencies.
📍 4. Location Analysis – Geographic Performance Insights
7 Slicers for filtering by location, contractor, etc.
4 Charts:
Budget vs Actual Cost (USD) by Location
Cost Variance
Progress (%)
🗺️ Ideal for multi-site renovation projects across different zones or cities.
📆 5. Monthly Trends – Time-Based Progress Monitoring
7 Slicers for filtering by month, location, department, and more
2 Charts:
Cost Variance by Month
Progress (%) by Month
📊 Quickly identify bottlenecks or delays on a monthly basis and take corrective action.
📂 What’s Included in the Package?
✅ Power BI (.PBIX) File
✅ Excel File (Data Source) with Sheets for:
Task Data
Budget and Actual Costs
Department & Contractor Info
🧠 Built-in visuals and slicers for real-time filtering
📤 Auto-refreshable with updated Excel files
🧩 Easy to customize and expand with your own project data
👤 Who Should Use This Dashboard?
🏢 Facility Managers
🛠️ Renovation Project Managers
🧑💼 Office Admin & Real Estate Teams
🧾 Financial Controllers
🧰 Contractors and Vendors
🚀 Benefits of Using This Dashboard
✅ Centralized project visibility in one dashboard
💡 Make informed decisions with real-time data
🎯 Identify over-budget departments or locations instantly
📊 Visually track progress month-over-month
🤝 Improve contractor accountability and performance
📌 Best Practices to Maximize Impact
✔ Update Excel source files weekly or bi-weekly
✔ Use slicers to drill down by contractor or department
✔ Regularly monitor cost variance and task progress
✔ Share dashboard with stakeholders for improved transparency
✔ Use the Monthly Trends page to foresee and address delays
🎓 Bonus
Watch our step-by-step tutorials on our YouTube Channel:
👉 youtube.com/@PKAnExcelExpert
🔗 Click here to read the Detailed blog post
Watch the step-by-step video tutorial:
Compatibility and Requirements
- Works in Power BI Desktop, which is free to download. Microsoft explains how to get it in Get Power BI Desktop.
- The data comes from the included Excel file, so you also need Excel to edit your task, budget and contractor data.
Frequently Asked Questions
How many pages does the dashboard have?
Five pages: Overview, Department Summary, Contractor Performance, Location Analysis and Monthly Trends. Each page has its own slicers and charts.
Where does the data come from?
From the included Excel file. It has sheets for task data, budget and actual costs, and department and contractor information. Update the Excel file and refresh the report to see new figures.
Can I compare contractors?
Yes. The Contractor Performance page shows cost variance, actual cost in USD and progress percentage for each contractor.
Does it work for renovations across several locations?
Yes. The Location Analysis page compares budget and actual cost by location, and also shows cost variance and progress for each one.
Is there an Excel or Google Sheets version?
Yes. See the Office Renovation Project Dashboard in Excel and the Office Renovation Project Dashboard in Google Sheets.
Related Renovation and Project Templates
- Office Renovation Project Dashboard in Excel: the same dashboard in Excel
- Office Renovation Project Dashboard in Google Sheets: the Google Sheets edition
- Office Renovation Project Report in Excel: a report view of the same project
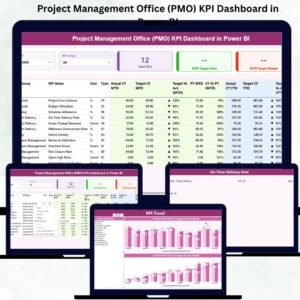
- Project Management Office (PMO) KPI Dashboard in Power BI: portfolio KPIs in Power BI
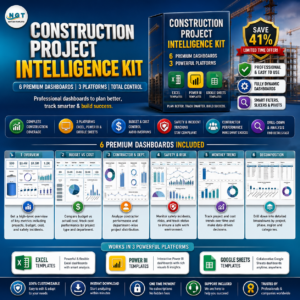
- Construction Project Intelligence Kit: 6 templates for Excel, Power BI and Google Sheets
Browse all Power BI dashboards.
































Reviews
There are no reviews yet.