



The Manufacturing Quality Assurance KPI Dashboard in Excel is an essential tool for manufacturers looking to improve their product quality, streamline processes, and ensure compliance with industry standards. This Excel-based dashboard provides key performance indicators (KPIs) to track essential aspects of quality assurance (QA), such as defect rates, production yields, inspection results, and rework percentages.
By using this dashboard, manufacturers can quickly identify areas for improvement, monitor the effectiveness of quality control processes, and drive continuous improvement efforts. The dashboard is designed to be simple yet powerful, offering real-time data insights to help optimize manufacturing operations and improve product quality.
Key Features of the Manufacturing Quality Assurance KPI Dashboard in Excel
📊 Quality Assurance Metrics Tracking
Track key quality metrics such as defect rates, yield rates, inspection pass rates, and rework rates. These KPIs provide valuable insights into the overall quality of the manufacturing process and product.
📝 Defect Analysis & Root Cause Identification
Analyze defects by category, production line, or machine to identify the root causes of quality issues. This helps manufacturers pinpoint problems in the production process and take corrective actions.
📈 Production Efficiency Monitoring
Measure production efficiency by comparing actual production output to the planned output. Monitor performance over time to ensure the manufacturing process stays on track and within expectations.
⚙️ Customizable Dashboards & Reports
Customize the dashboard to focus on the most relevant KPIs for your manufacturing processes. Modify the layout, adjust metrics, and update data sources to meet your company’s specific needs.
📅 Time-Based Performance Analysis
Track quality metrics over various time periods, including daily, weekly, and monthly. This time-based analysis helps identify trends, monitor improvements, and assess the impact of quality control initiatives.
🔄 Real-Time Data Integration
Integrate data from different sources, such as production systems, quality control software, and inspection reports, to ensure up-to-date and accurate information in real time.
Why You’ll Love the Manufacturing Quality Assurance KPI Dashboard in Excel
✅ Comprehensive Quality Monitoring
Track all key quality metrics, including defects, yields, and inspection results, in one centralized location.
✅ Data-Driven Decision Making
Leverage real-time data and analytics to identify quality issues early and make informed decisions that improve production efficiency and product quality.
✅ Improve Operational Efficiency
Use insights from the dashboard to optimize production processes, reduce defects, and minimize rework, resulting in higher efficiency and cost savings.
✅ Enhanced Compliance & Reporting
Ensure compliance with industry quality standards by tracking the required KPIs and generating reports for audits, reviews, and continuous improvement initiatives.
✅ Customizable & Scalable
Customize the dashboard to meet your specific manufacturing needs. It’s scalable for small, medium, and large-scale manufacturing operations.
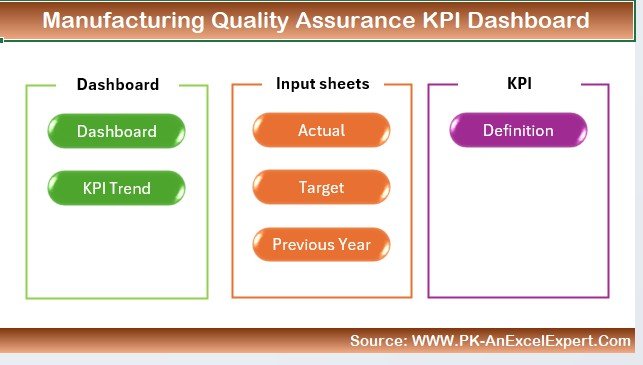
What’s Inside the Manufacturing Quality Assurance KPI Dashboard in Excel?
Quality Metrics Tracking: Track defects, yields, inspection pass rates, and rework rates.
Defect Analysis & Root Cause Identification: Analyze defects and identify their root causes.
Production Efficiency Monitoring: Measure production efficiency and track actual vs. planned output.
Customizable Dashboards: Tailor the dashboard to your specific manufacturing quality needs.
Time-Based Analysis: Monitor KPIs over various time periods to track trends.
Real-Time Data Integration: Ensure real-time updates and accurate tracking from multiple data sources.
How to Use the Manufacturing Quality Assurance KPI Dashboard in Excel
1️⃣ Download the Template: Get the Manufacturing Quality Assurance KPI Dashboard in Excel instantly.
2️⃣ Integrate Your Data Sources: Link your data sources such as production data, quality control reports, and inspection data.
3️⃣ Track Quality Metrics: Use the dashboard to monitor key quality metrics such as defect rates and production yields.
4️⃣ Analyze Performance: Identify trends, root causes of defects, and areas for improvement.
5️⃣ Optimize Manufacturing Processes: Use data insights to optimize processes, reduce defects, and improve operational efficiency.
Who Can Benefit from the Manufacturing Quality Assurance KPI Dashboard in Excel?
🔹 Manufacturing Managers & Supervisors
🔹 Quality Assurance Teams & Inspectors
🔹 Operations & Production Managers
🔹 Process Improvement Teams
🔹 Supply Chain & Logistics Managers
🔹 Compliance & Regulatory Teams
🔹 Small, Medium, and Large Manufacturing Enterprises
Enhance your manufacturing processes and improve product quality with the Manufacturing Quality Assurance KPI Dashboard in Excel. Track quality metrics, optimize production, and ensure compliance with industry standards—all in one easy-to-use tool.
Click here to read the Detailed blog post
Visit our YouTube channel to learn step-by-step video tutorials
Youtube.com/@PKAnExcelExpert
Watch the step-by-step video Demo:
Compatibility and Requirements
- Works in Microsoft Excel desktop (Excel 2016 or later, or Microsoft 365).
- Microsoft’s guide Create a chart from start to finish explains the Excel feature this file is built on.
Frequently Asked Questions
Which quality KPIs does the dashboard track?
It tracks defect rates, yield rates, inspection pass rates and rework rates, along with production efficiency (actual output against planned output).
Can I analyze defects by line or machine?
Yes. Defects can be analyzed by category, production line or machine to help find the root cause of quality issues.
Can I see trends over time?
Yes. Quality metrics can be reviewed daily, weekly and monthly to see trends and the effect of quality control work.
Who uses this dashboard?
Manufacturing managers and supervisors, quality assurance teams and inspectors, production managers, process improvement teams and compliance teams.
Related Quality Assurance Templates
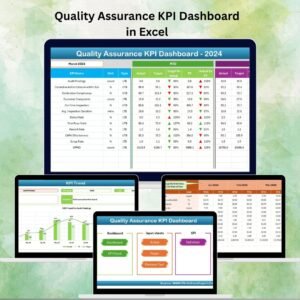
- Quality Assurance Dashboard in Excel: a multi-page quality assurance dashboard in Excel
- Quality Assurance Dashboard in Google Sheets: quality assurance reporting in Google Sheets
- Quality Assurance Dashboard in Power BI: quality assurance reporting in Power BI
- Quality Control Tracker in Excel: log quality checks and issues in Excel
- Quality & Audit Management Bundle: quality and audit templates in one bundle
Browse all Excel KPI dashboards or the Excel quality control templates.
































Reviews
There are no reviews yet.