


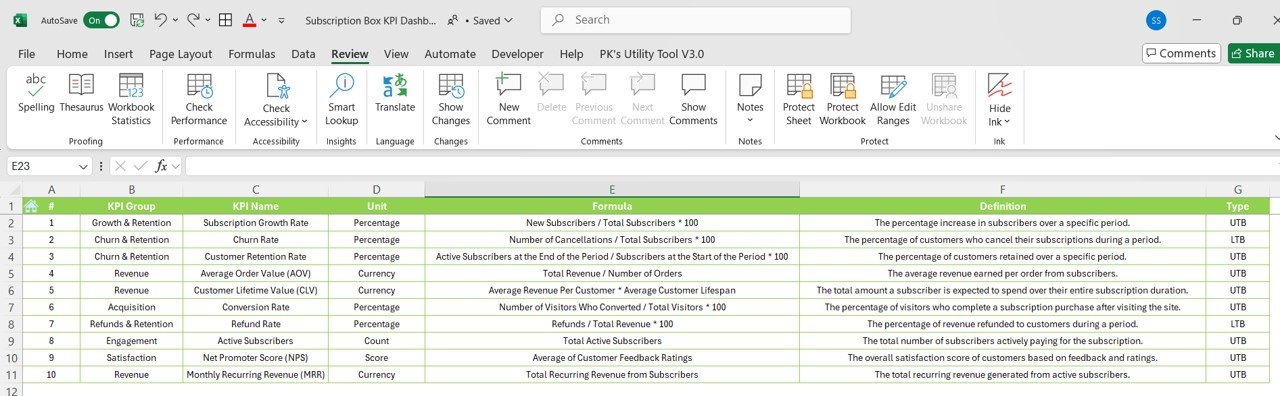
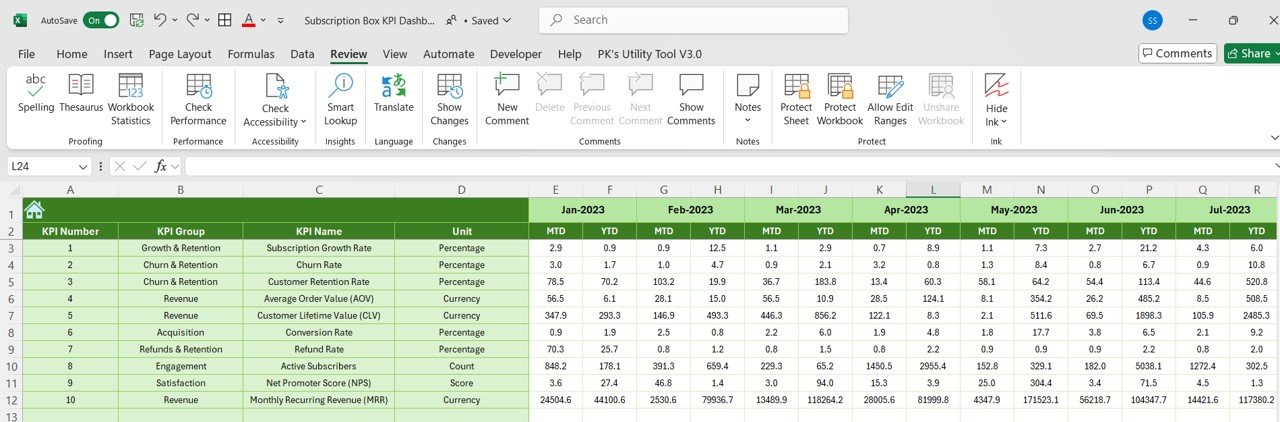
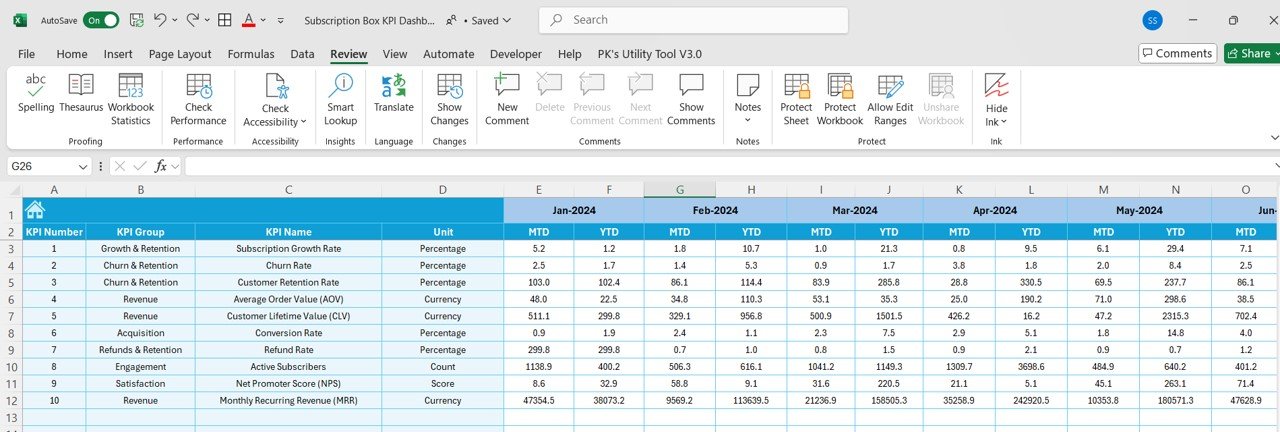
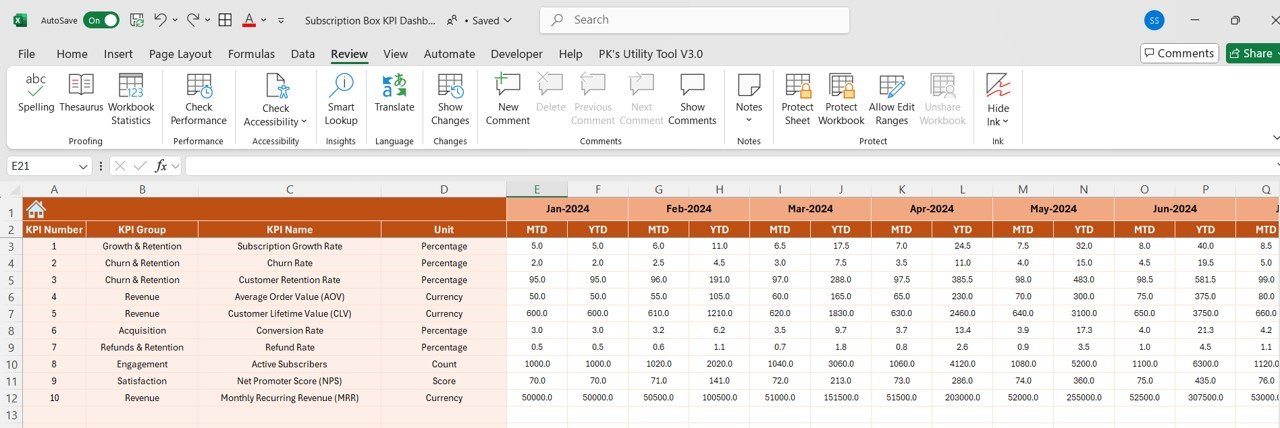
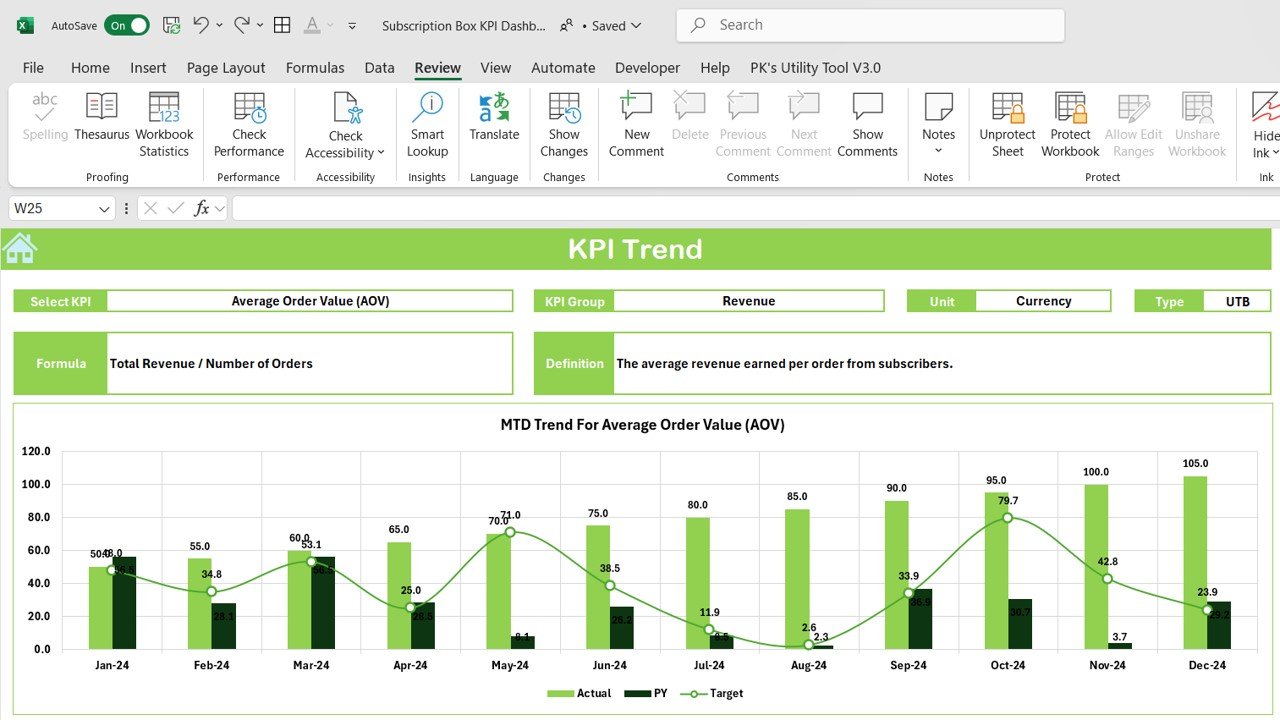
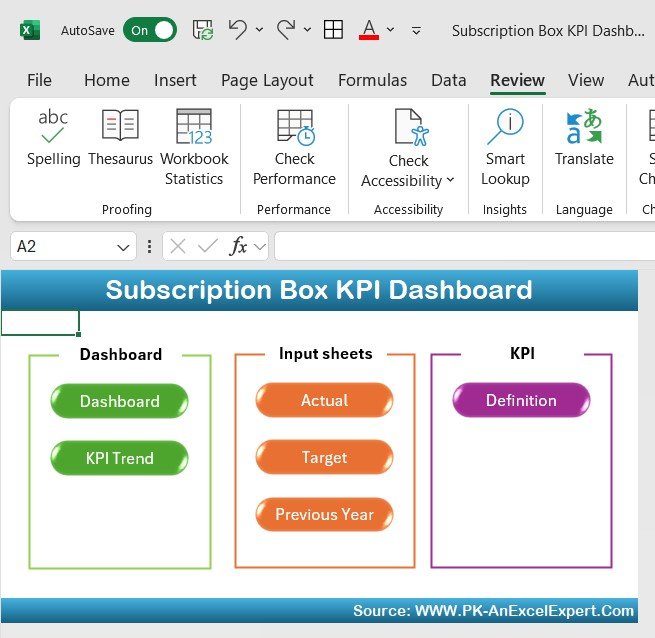

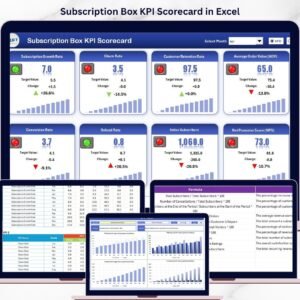
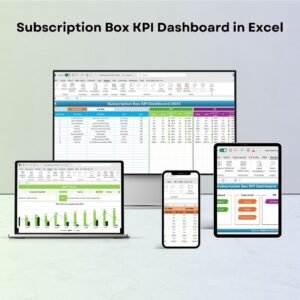
The Subscription Box KPI Dashboard in Excel is a must-have tool for subscription box businesses looking to track and optimize their key performance indicators (KPIs). Whether you’re running a small business or managing a large subscription box service, this Excel-based dashboard allows you to monitor critical metrics such as customer retention, monthly recurring revenue, subscriber growth, and more. With detailed insights into your subscription box performance, this tool helps you identify trends, optimize your offerings, and make data-driven decisions to enhance customer satisfaction and grow your business.
The easy-to-use dashboard enables you to track customer acquisition costs, cancellations, and revenue growth in one central location. By staying on top of these key metrics, you can optimize your marketing, reduce churn, and increase profitability. The customizable layout makes this dashboard suitable for businesses of all sizes, from niche subscription boxes to large-scale subscription services.

Key Features of the Subscription Box KPI Dashboard in Excel
📊 Customer Retention & Churn Tracking
Monitor customer retention rates and track cancellations. Understanding churn is crucial for maintaining a loyal subscriber base and growing your business.
📈 Monthly Recurring Revenue (MRR) Tracking
Track monthly recurring revenue to measure the financial health of your subscription box business. Monitor how much revenue is generated consistently each month from active subscribers.
💰 Customer Acquisition Cost (CAC) Monitoring
Calculate and track the cost of acquiring new customers. By monitoring CAC, you can optimize your marketing and sales efforts to ensure profitability.
📅 Subscriber Growth Analysis
Track the number of subscribers over time, and monitor growth trends. Identify spikes and dips to adjust your strategies accordingly.
⚙️ Revenue & Profitability Metrics
Monitor the financial performance of your subscription box business with revenue tracking, cost analysis, and profit margins.
🔄 Customizable Metrics & KPIs
Customize the dashboard to track any other relevant KPIs for your subscription box service. Add your preferred metrics, adjust layout, and tailor the dashboard to suit your business needs.
Why You’ll Love the Subscription Box KPI Dashboard in Excel
✅ Comprehensive Subscription Management
Track all your key subscription box metrics, including customer retention, subscriber growth, churn rate, and monthly recurring revenue in one place.
✅ Improve Marketing & Customer Retention
Monitor churn and retention rates to identify areas for improvement and implement strategies to retain customers and grow your subscriber base.
✅ Optimize Profitability
Keep an eye on your customer acquisition cost and revenue streams. Make adjustments to marketing strategies, pricing, or service offerings to maximize profitability.
✅ Gain Data-Driven Insights
Use real-time data and visual analytics to identify trends, spot opportunities, and make smarter decisions that lead to growth and increased customer satisfaction.
✅ Customizable & Scalable
The dashboard is fully customizable to meet the needs of your subscription box business. It can scale with your business, whether you have hundreds or thousands of subscribers.
What’s Inside the Subscription Box KPI Dashboard in Excel?
Customer Retention & Churn Tracking: Keep track of cancellations and customer retention.
Monthly Recurring Revenue (MRR): Track the financial health of your business with recurring revenue insights.
Customer Acquisition Cost (CAC): Measure how much you are spending to acquire each customer.
Subscriber Growth: Monitor the growth of your subscriber base over time.
Revenue & Profitability Metrics: Track revenue, costs, and profits to ensure financial sustainability.
Customizable Dashboard: Add or modify KPIs and metrics to suit your subscription box needs.
How to Use the Subscription Box KPI Dashboard in Excel
1️⃣ Download the Template: Access the Subscription Box KPI Dashboard in Excel instantly.
2️⃣ Input Your Data: Add customer, revenue, and subscription data to the dashboard.
3️⃣ Monitor Key Metrics: Track metrics such as churn, MRR, CAC, and subscriber growth.
4️⃣ Analyze & Optimize: Use insights from the dashboard to improve customer retention, reduce churn, and optimize profitability.
5️⃣ Generate Reports: Easily generate reports to analyze the performance of your subscription box business.
Who Can Benefit from the Subscription Box KPI Dashboard in Excel?
🔹 Subscription Box Businesses & E-commerce Platforms
🔹 Marketing & Sales Teams
🔹 Financial Analysts & Business Owners
🔹 Customer Retention Managers
🔹 Subscription Box Startups & Enterprises
🔹 Investors & Stakeholders in Subscription-Based Services
Ensure the growth and success of your subscription box service with the Subscription Box KPI Dashboard in Excel. Track and optimize your key metrics, improve customer retention, and boost profitability with a user-friendly and customizable dashboard.
Click here to read the Detailed blog post
Visit our YouTube channel to learn step-by-step video tutorials
Youtube.com/@PKAnExcelExpert
Compatibility and Requirements
- Works in Microsoft Excel desktop (Excel 2016 or later, or Microsoft 365).
- The KPIs are shown in interactive charts. Microsoft explains Excel charts in Create a chart from start to finish.
Frequently Asked Questions
What does the Subscription Box KPI Dashboard track?
It tracks customer retention and churn, monthly recurring revenue (MRR), customer acquisition cost (CAC), subscriber growth, and revenue, costs and profit.
How do I add my own data?
Add your customer, revenue and subscription data. The dashboard then shows churn, MRR, CAC and subscriber growth.
Can I create reports from it?
Yes. You can generate reports to analyze the performance of your subscription box business.
Can I add my own KPIs?
Yes. You can add or modify KPIs and metrics to suit your subscription box business.
Is there a Google Sheets or Power BI version?
Yes. The Subscription Box KPI Dashboard in Google Sheets and the Subscription Box KPI Dashboard in Power BI cover the same KPIs on those platforms.
Related Subscription Box Templates
- Subscription Box KPI Dashboard in Google Sheets: the same dashboard in Google Sheets
- Subscription Box KPI Dashboard in Power BI: the same KPIs in Power BI
- Subscription Box Services KPI Dashboard in Excel: KPIs for subscription box services
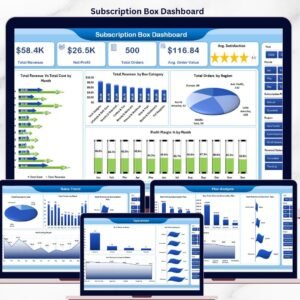
- Subscription Box Dashboard in Excel: a full subscription box dashboard
- Ecommerce Store Business Starter Templates Kit: a starter kit of templates for an online store
Browse all Excel KPI dashboards or the Excel dashboards.


























Reviews
There are no reviews yet.