



Key Features of Subscription Box KPI Scorecard
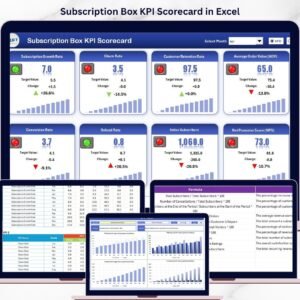
Unlock the full potential of your subscription box business with our Subscription Box KPI Scorecard, a ready-to-use, comprehensive digital template designed to track, analyze, and optimize your key performance indicators (KPIs) effortlessly. This powerful tool enables you to monitor monthly, month-to-date (MTD), and year-to-date (YTD) performance in a visually engaging and easy-to-understand format. Stay ahead of the competition by quickly identifying trends, comparing actual performance against targets, and making data-driven decisions to boost your subscription box growth and profitability.
The scorecard includes four meticulously crafted worksheets that cover every aspect of KPI management:
- 🔽 Dropdown Menus: Easily select month, MTD, or YTD to analyze your subscription box performance on your preferred timeline.
- 📊 Actual vs Target Values: Compare real results with planned goals to identify areas of success and improvement.
- 🎨 Visual Indicators: Color-coded visuals and conditional formatting provide instant insights into KPI status for quick decision-making.
- 📈 Comprehensive KPI Overview: View all relevant KPIs at a glance, including detailed MTD and YTD comparisons for a holistic understanding.

What’s Inside the Subscription Box KPI Scorecard
Our scorecard template houses four intuitive worksheets designed to streamline KPI tracking and analysis:
- 📊 Scorecard Sheet: The main dashboard for KPI monitoring with dropdown filters and visual status indicators.
- 📈 KPI Trend Sheet: Select any KPI via dropdown in cell C3 to view detailed trends. This sheet displays KPI group, unit, KPI type (Lower or Upper is Better), formula, and definition. Includes MTD and YTD trend charts comparing Actual, Target, and Previous Year (PY) data.
- 📝 Input Data Sheet: The data entry hub where you input actual values, targets, and related metrics for each KPI, ensuring your scorecard stays up-to-date and accurate.
- 📚 KPI Definition Sheet: Define your KPIs by entering KPI names, groups, units, formulas, and detailed definitions for clarity and consistency.
How to Use the Subscription Box KPI Scorecard
Getting the most out of your Subscription Box KPI Scorecard is easy and intuitive:
- 📥 Step 1: Input Your Data – Enter your actual KPI results, targets, and other relevant metrics into the Input Data Sheet to keep your data fresh and precise.
- 🔍 Step 2: Define KPIs – Use the KPI Definition sheet to specify the KPI names, groups, measurement units, formulas, and definitions customized to your business.
- 📊 Step 3: Analyze Trends – Navigate to the KPI Trend Sheet to select any KPI and study its performance trends over time with visual charts.
- 📈 Step 4: Monitor Performance – Use the Scorecard Sheet as your command center. Choose the timeframe (month, MTD, YTD) using dropdown menus to instantly see actual vs target comparisons and performance status.
- 🔄 Step 5: Update Regularly – Keep entering fresh data periodically to maintain accurate tracking and actionable insights for continuous improvement.
Who Can Benefit from This Subscription Box KPI Scorecard
This scorecard is perfect for:
- 📦 Subscription Box Entrepreneurs: Track and optimize your key business metrics to maximize subscriber growth and retention.
- 📊 Marketing & Sales Teams: Monitor campaign effectiveness and customer engagement KPIs with easy-to-interpret visuals.
- 📈 Business Analysts: Analyze trends, identify performance gaps, and provide actionable recommendations.
- 👥 Operations Managers: Keep a pulse on fulfillment, churn rates, and customer satisfaction metrics.
- 🧑💼 Consultants & Coaches: Offer clients a professional and easy-to-use KPI tracking solution tailored for subscription businesses.
Whether you are just starting out or scaling your subscription box enterprise, this KPI Scorecard will empower you with the clarity and control needed to drive success.
Click here to read the Detailed blog post.
Visit our YouTube channel to learn step-by-step video tutorials
Compatibility and Requirements
- Works in Microsoft Excel desktop (Excel 2016 or later, or Microsoft 365).
- You pick the month, MTD or YTD from dropdown menus, and the Scorecard sheet uses color-coded status indicators. Microsoft explains the feature in Use conditional formatting to highlight information in Excel.
Frequently Asked Questions
Which sheets are included?
Four sheets: Scorecard, KPI Trend, Input Data and KPI Definition.
How do I update the scorecard?
Enter your actual values, targets and related metrics for each KPI in the Input Data sheet. Then choose the month, MTD or YTD on the Scorecard sheet and it shows actual against target.
How do I see the trend for one KPI?
Open the KPI Trend sheet and select a KPI from the dropdown in cell C3. The sheet shows the KPI group, unit, type (Lower or Upper is Better), formula and definition, plus MTD and YTD trend charts for Actual, Target and Previous Year.
Can I define my own KPIs?
Yes. On the KPI Definition sheet you enter the KPI names, groups, units, formulas and definitions for your business.
Is there a dashboard version of this template?
Yes. See the Subscription Box KPI Dashboard in Excel, the Google Sheets edition and the Power BI edition.
Related Subscription Box Templates
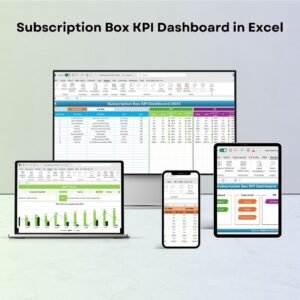
- Subscription Box KPI Dashboard in Excel: the same KPIs in a dashboard layout
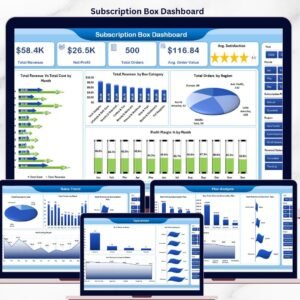
- Subscription Box Dashboard in Excel: a wider dashboard for the business
- Subscription Box KPI Dashboard in Power BI: the Power BI edition
- Subscription Box KPI Dashboard in Google Sheets: the Google Sheets edition
- KPI Dashboard Library (Excel): 15 KPI templates in one download
Browse all Excel KPI dashboards.









Reviews
There are no reviews yet.