

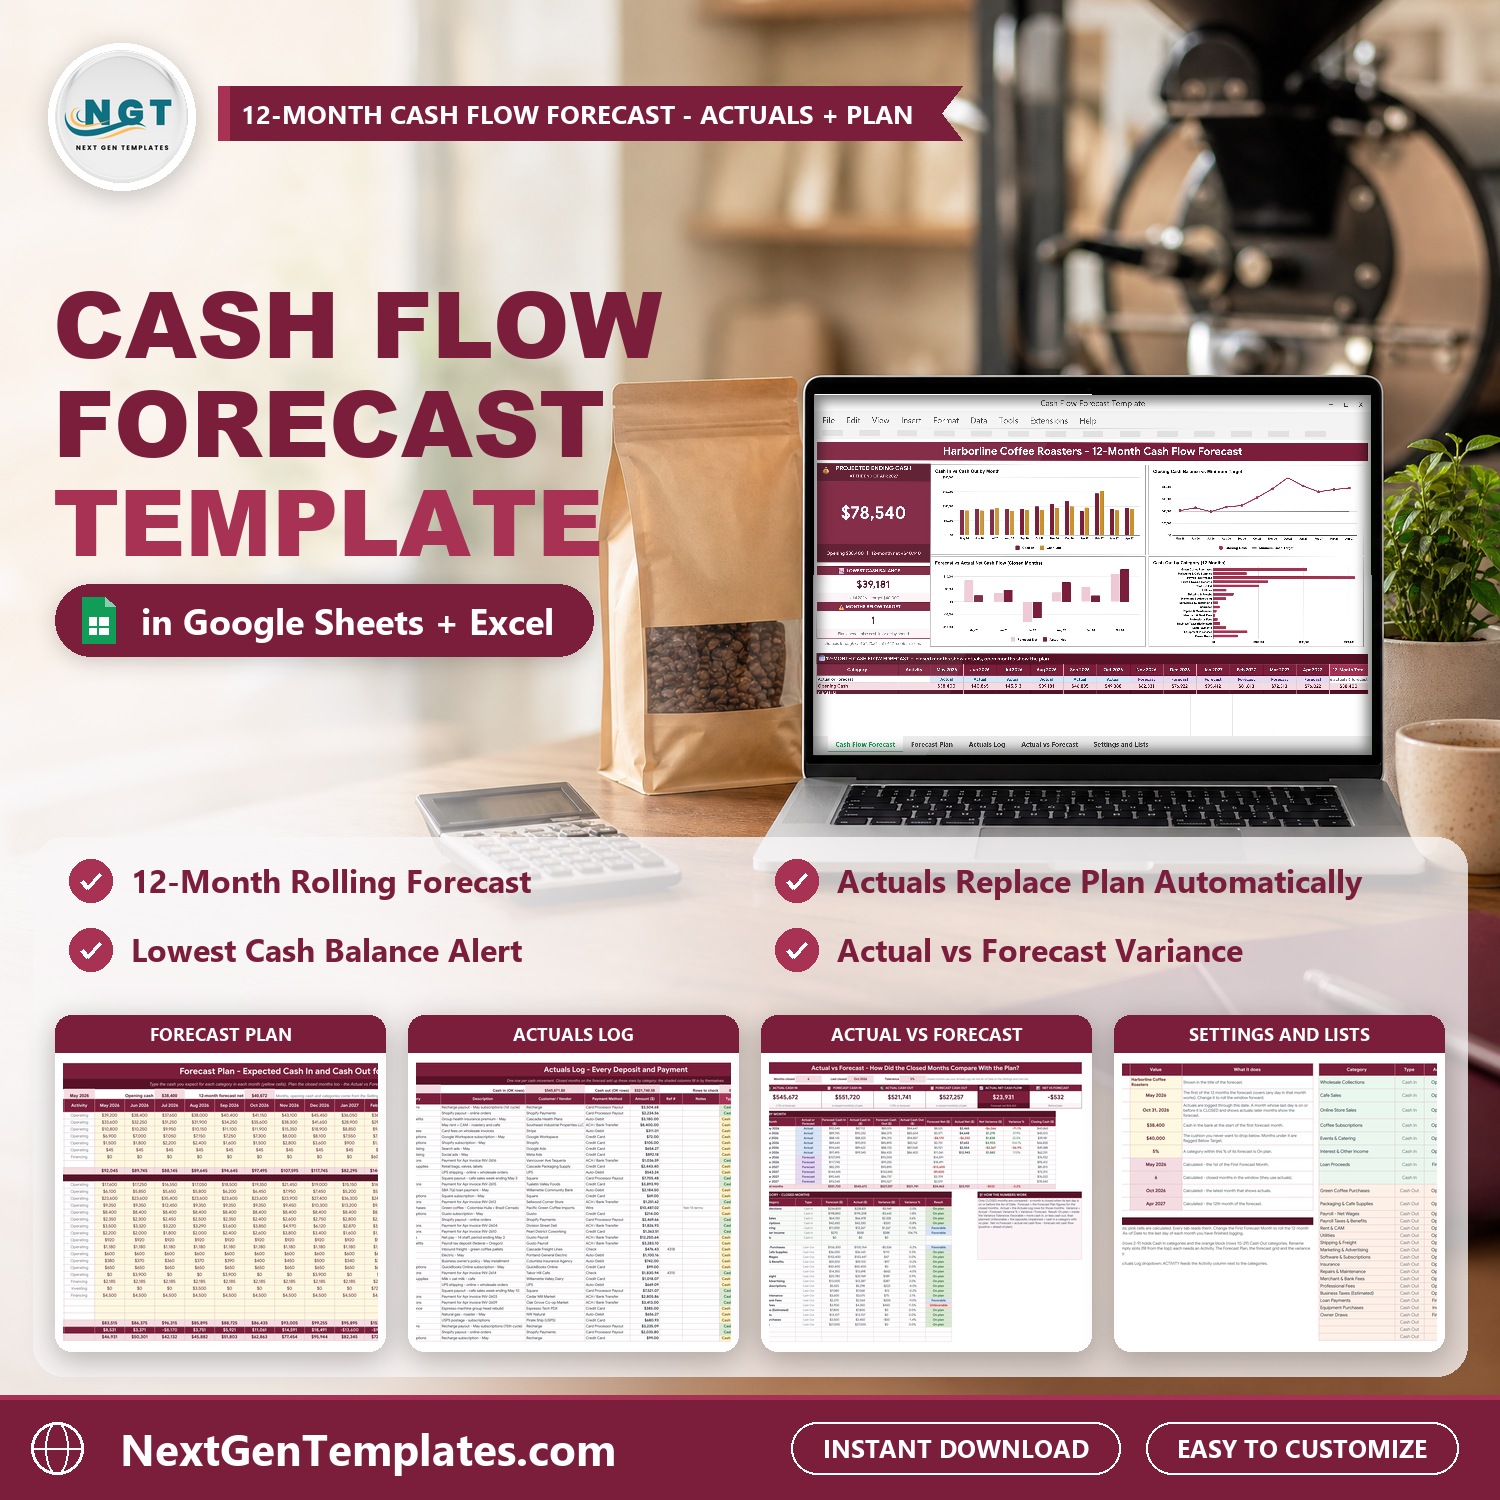
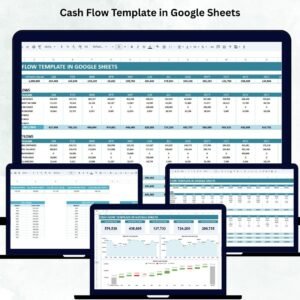
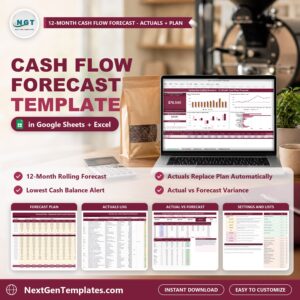
Cash Flow Forecast Template in Excel and Google Sheets shows how much cash your business will have at the end of the year, which month will be the tightest and whether you will drop below your safety cushion. Plan the next 12 months by category, log every deposit and payment, and the forecast switches closed months to your real actuals while open months keep your plan. A Projected Ending Cash card, a Lowest Cash Balance tile, a Months Below Target tile and four charts sit on top, and an Actual vs Forecast tab shows whether the last few months went to plan. It ships in two editions, Google Sheets and Microsoft Excel, with the same seven tabs, the same formulas and sample data for a coffee roaster in Portland.
Watch the Cash Flow Forecast Template in Excel and Google Sheets walkthrough
🌍 Join 10,000+ customers in 180+ countries using NextGenTemplates to replace paid SaaS tools with one-time-purchase Excel, Google Sheets, Power BI and HTML templates.
✅ Instant download · One-time payment · No subscription · No per-user fees · Lifetime access
This is a cash flow forecast template for small business owners, freelancers and finance managers who want to see their cash 12 months ahead. It is a manual forecast with formulas and charts, not a macro tool and not a bank connection: you type your plan and your actuals yourself.
🔑 Key Features of the Cash Flow Forecast Template
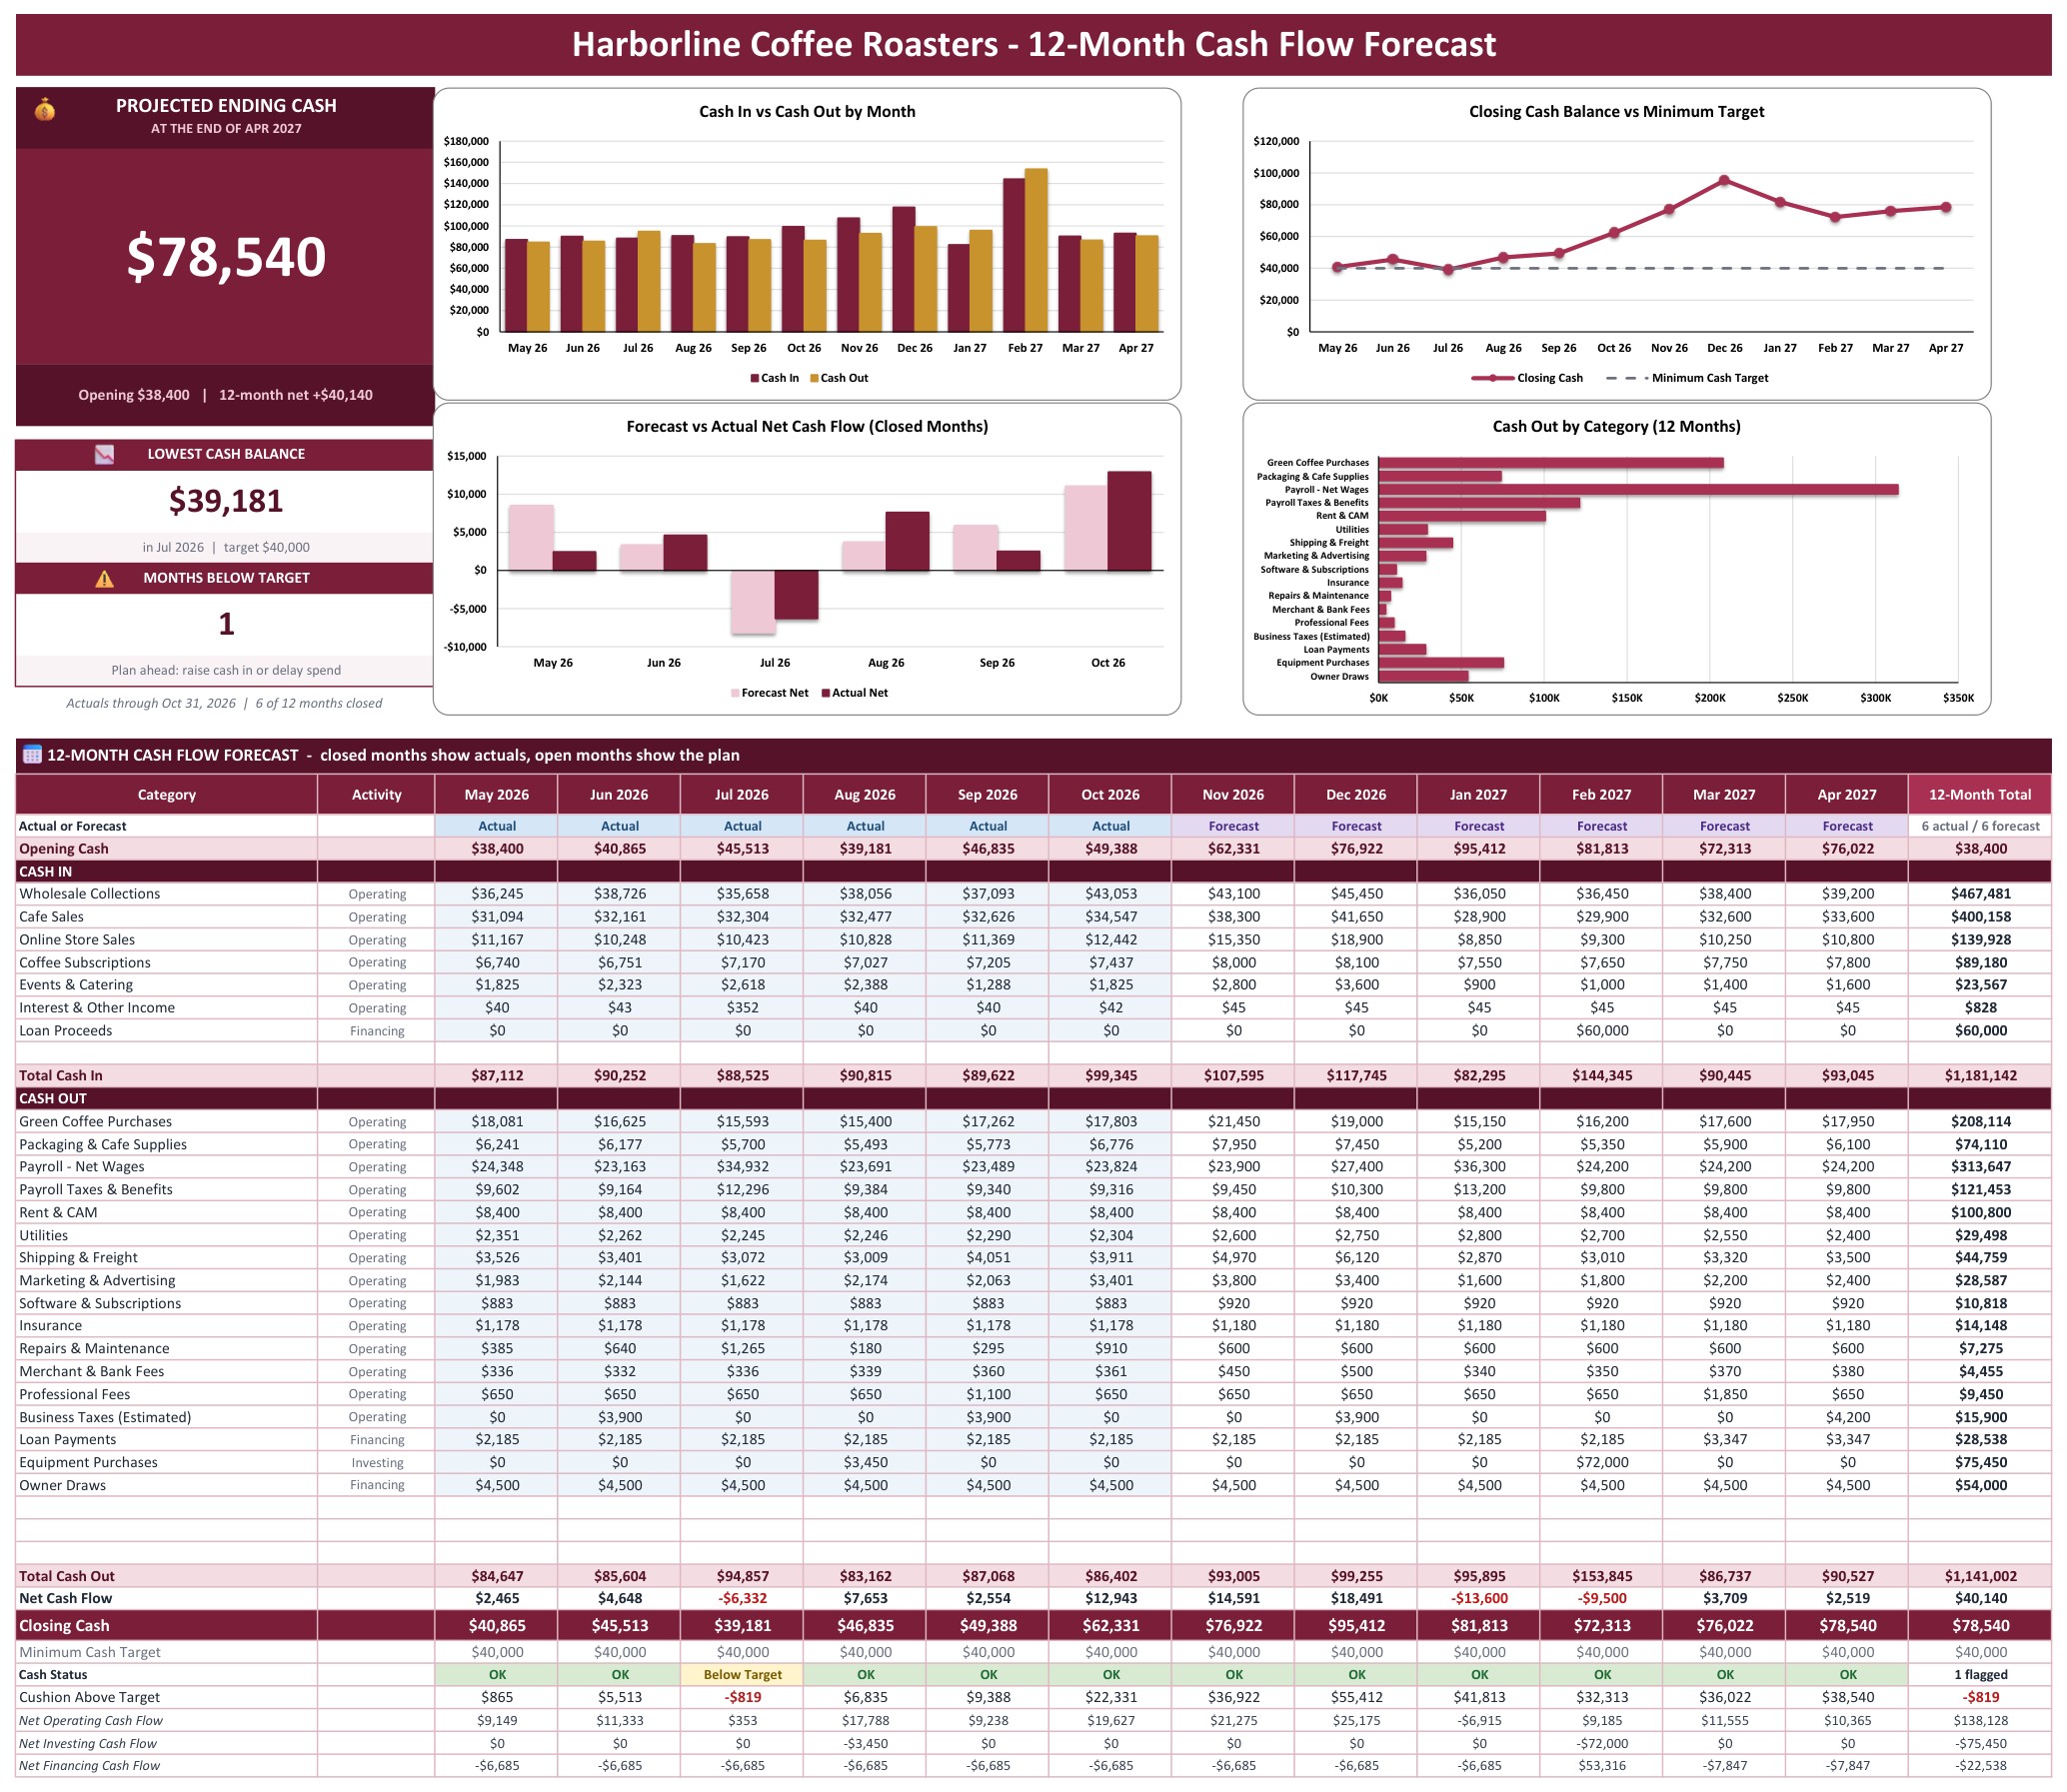
💰 Projected Ending Cash. A large card shows your cash at the end of the 12-month window, with the opening balance and the 12-month net change under it.
🚦 A minimum cash target. Set the cushion you never want to drop under. A Lowest Cash Balance tile shows the tightest month, and a Months Below Target tile counts the months under your target. Each month shows OK, Below Target or Shortfall.
📅 Actuals for closed months, plan for the rest. A month whose last day is on or before your As-of Date is closed and shows the real figures from the Actuals Log. Later months show your Forecast Plan, and labels on top of every month tell you which is which.
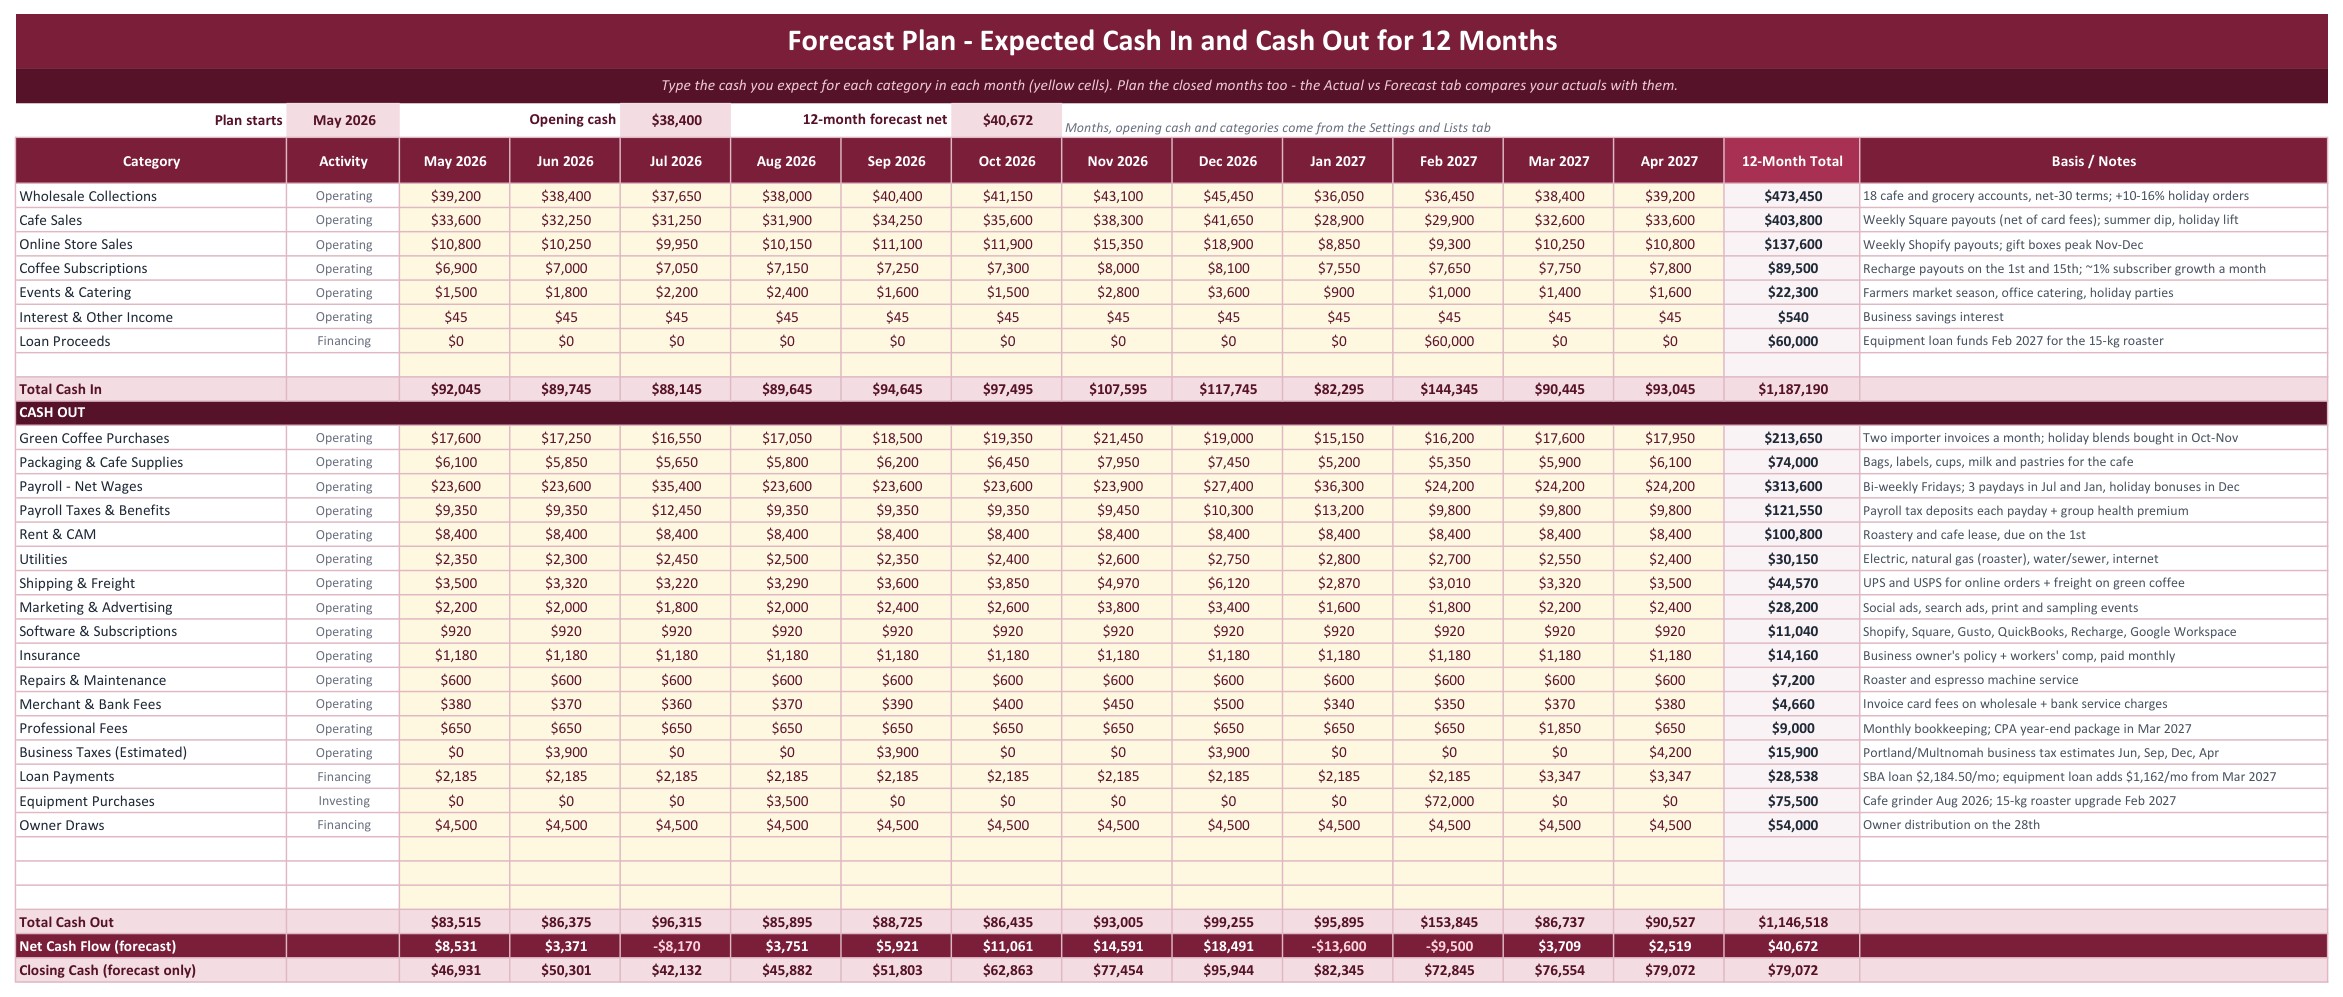
🧾 A Forecast Plan by category. Eight cash in and 20 cash out categories across 12 months in yellow input cells, with a Basis / Notes column to remember how you arrived at each number.
📒 An Actuals Log that fills itself in. Enter the date, category, description, customer or vendor, payment method and amount. The type, activity, month, net effect and a Check column fill in for you. The log holds 2,000 rows.
📈 Four charts. Cash In vs Cash Out by Month, Closing Cash Balance vs Minimum Target, Forecast vs Actual Net Cash Flow for the closed months and Cash Out by Category.
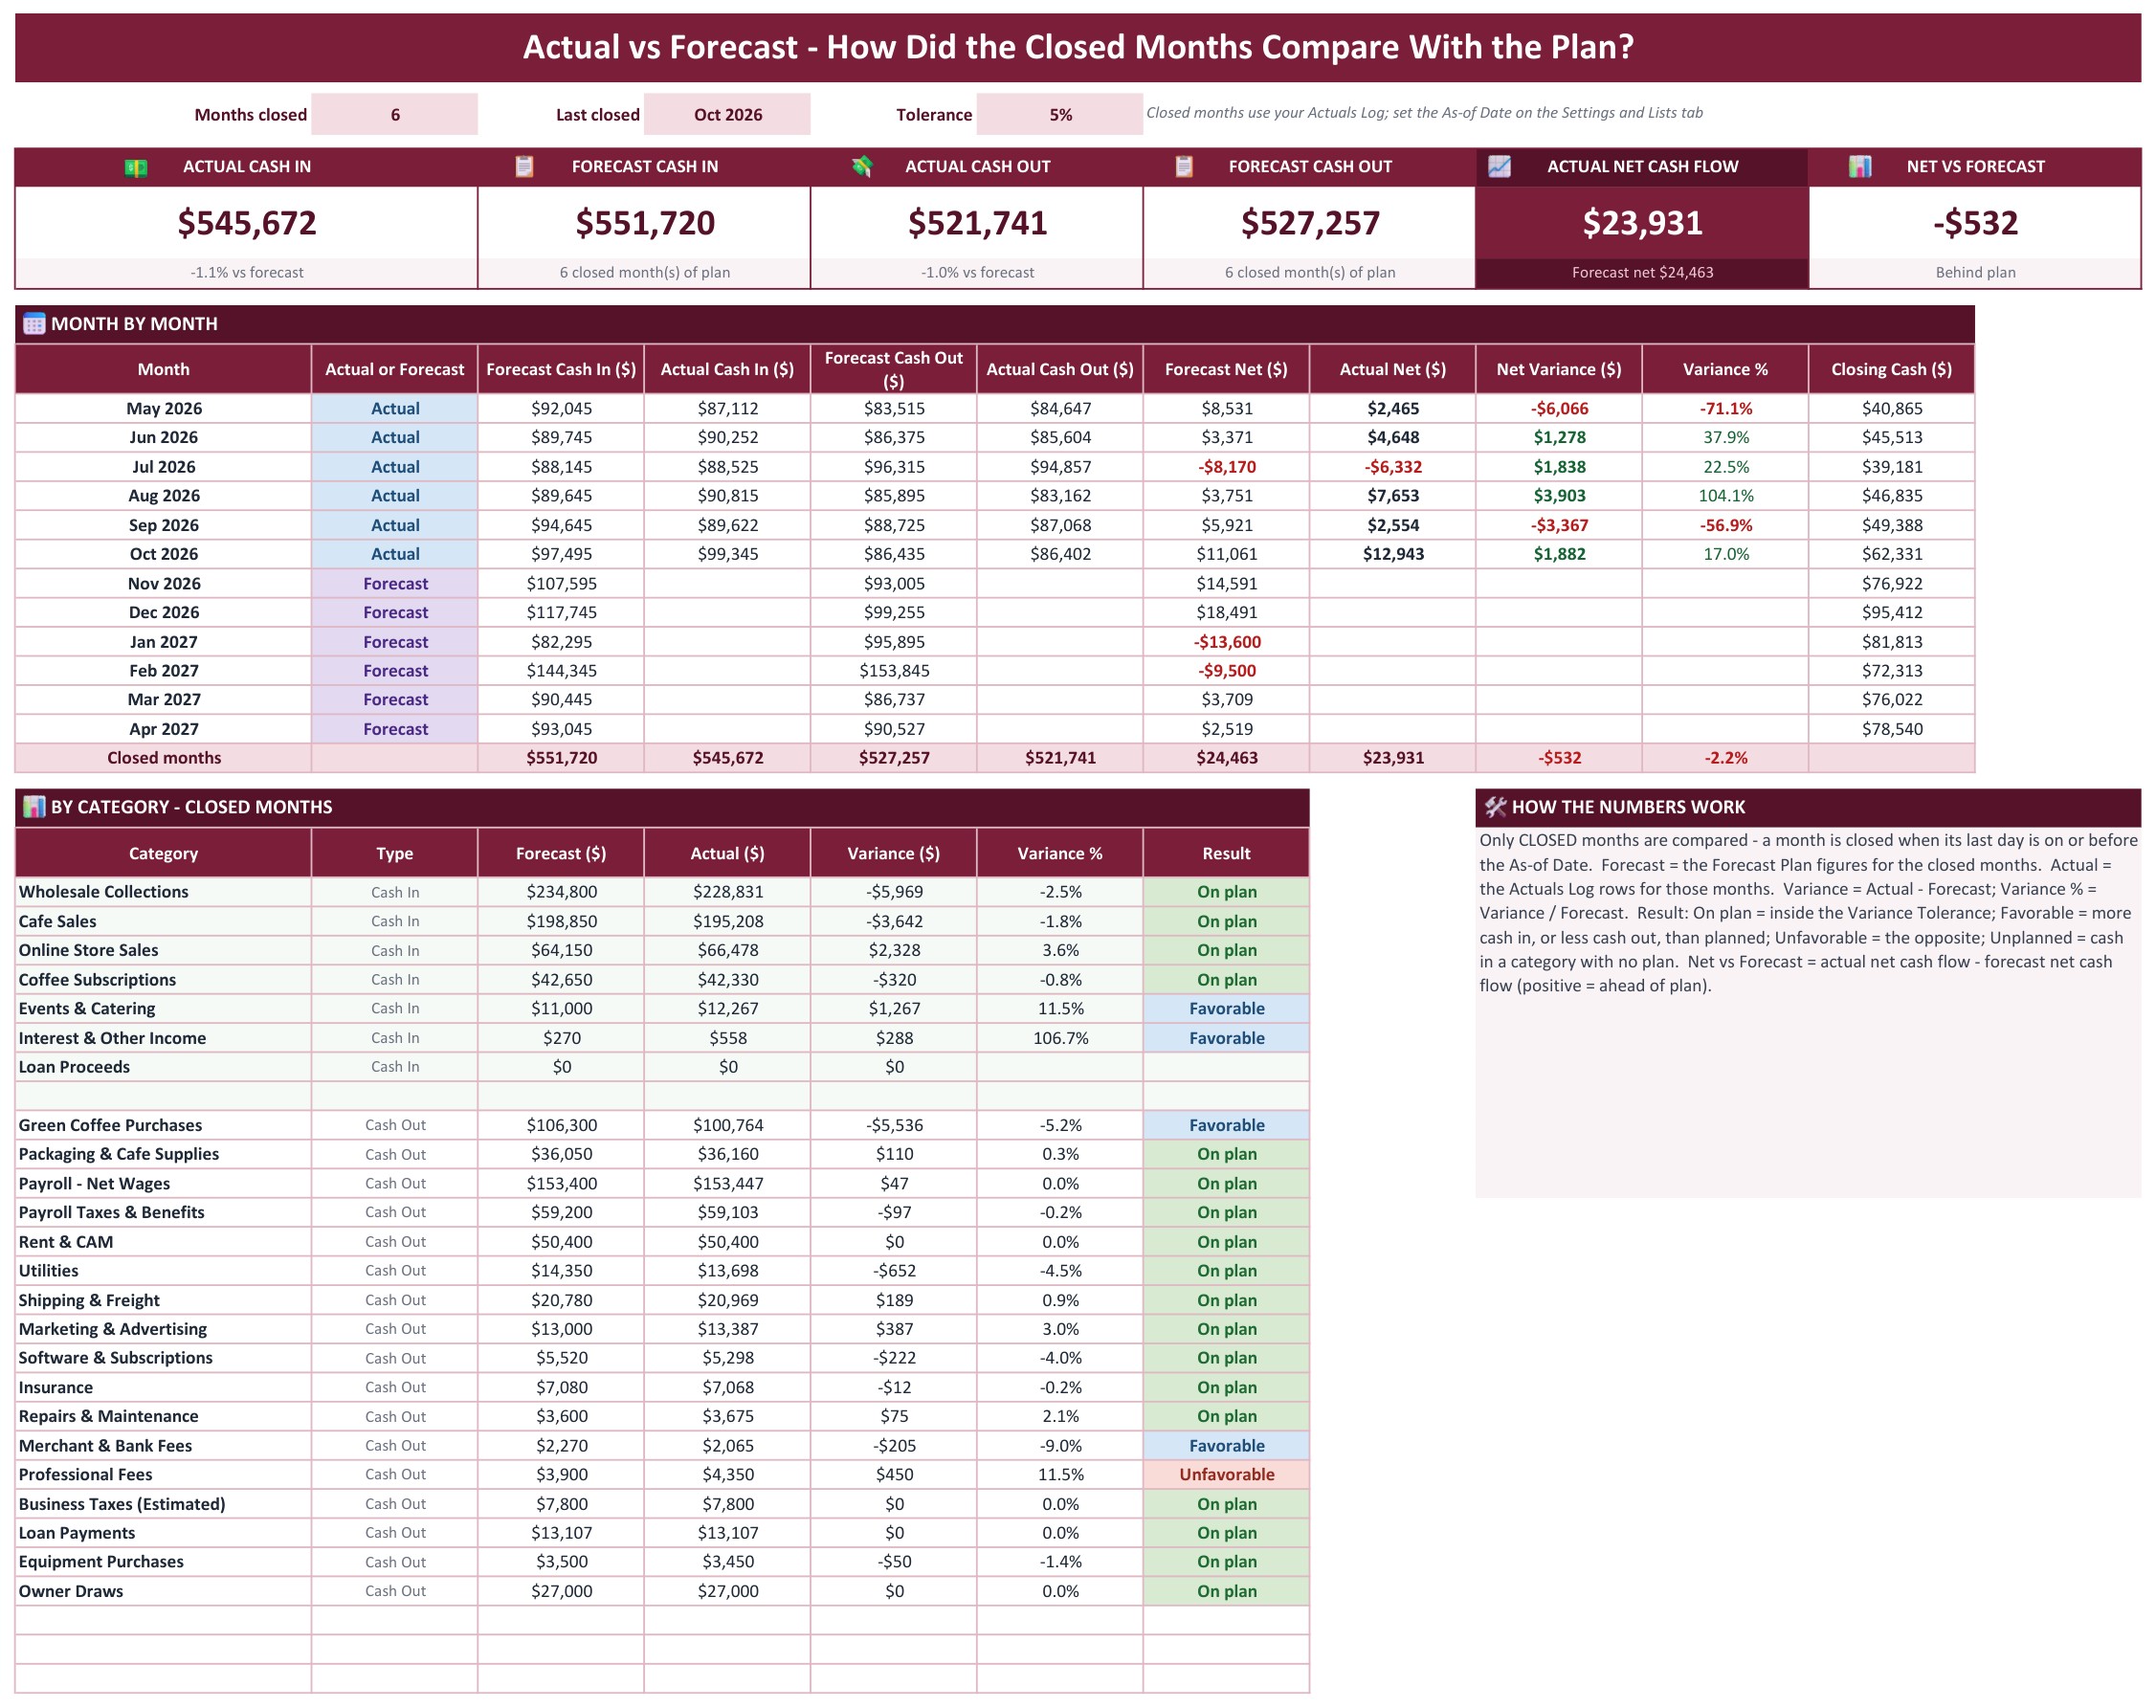
🔍 Actual vs Forecast. Six tiles, a month by month variance table and a result for every category: On plan, Favorable, Unfavorable or Unplanned, based on the tolerance you set.
🏗️ Operating, investing and financing. The net cash flow is split into the three activities at the bottom of the forecast, so a loan or an equipment purchase is easy to see.
🗂️ Everything is renamable. Categories and payment methods live on the Settings and Lists tab, and the dropdowns follow.
📦 What’s Inside the Cash Flow Forecast Template
The download is a ZIP with two files: the Excel edition (.xlsx, no macros) and a PDF guide that holds the “Make a copy” link to your own editable Google Sheet. Both editions have the same seven tabs: Cash Flow Forecast, Forecast Plan, Actuals Log, Actual vs Forecast, Settings and Lists, Instructions and Explore More Templates.
Page 1: Cash Flow Forecast (Google Sheets)
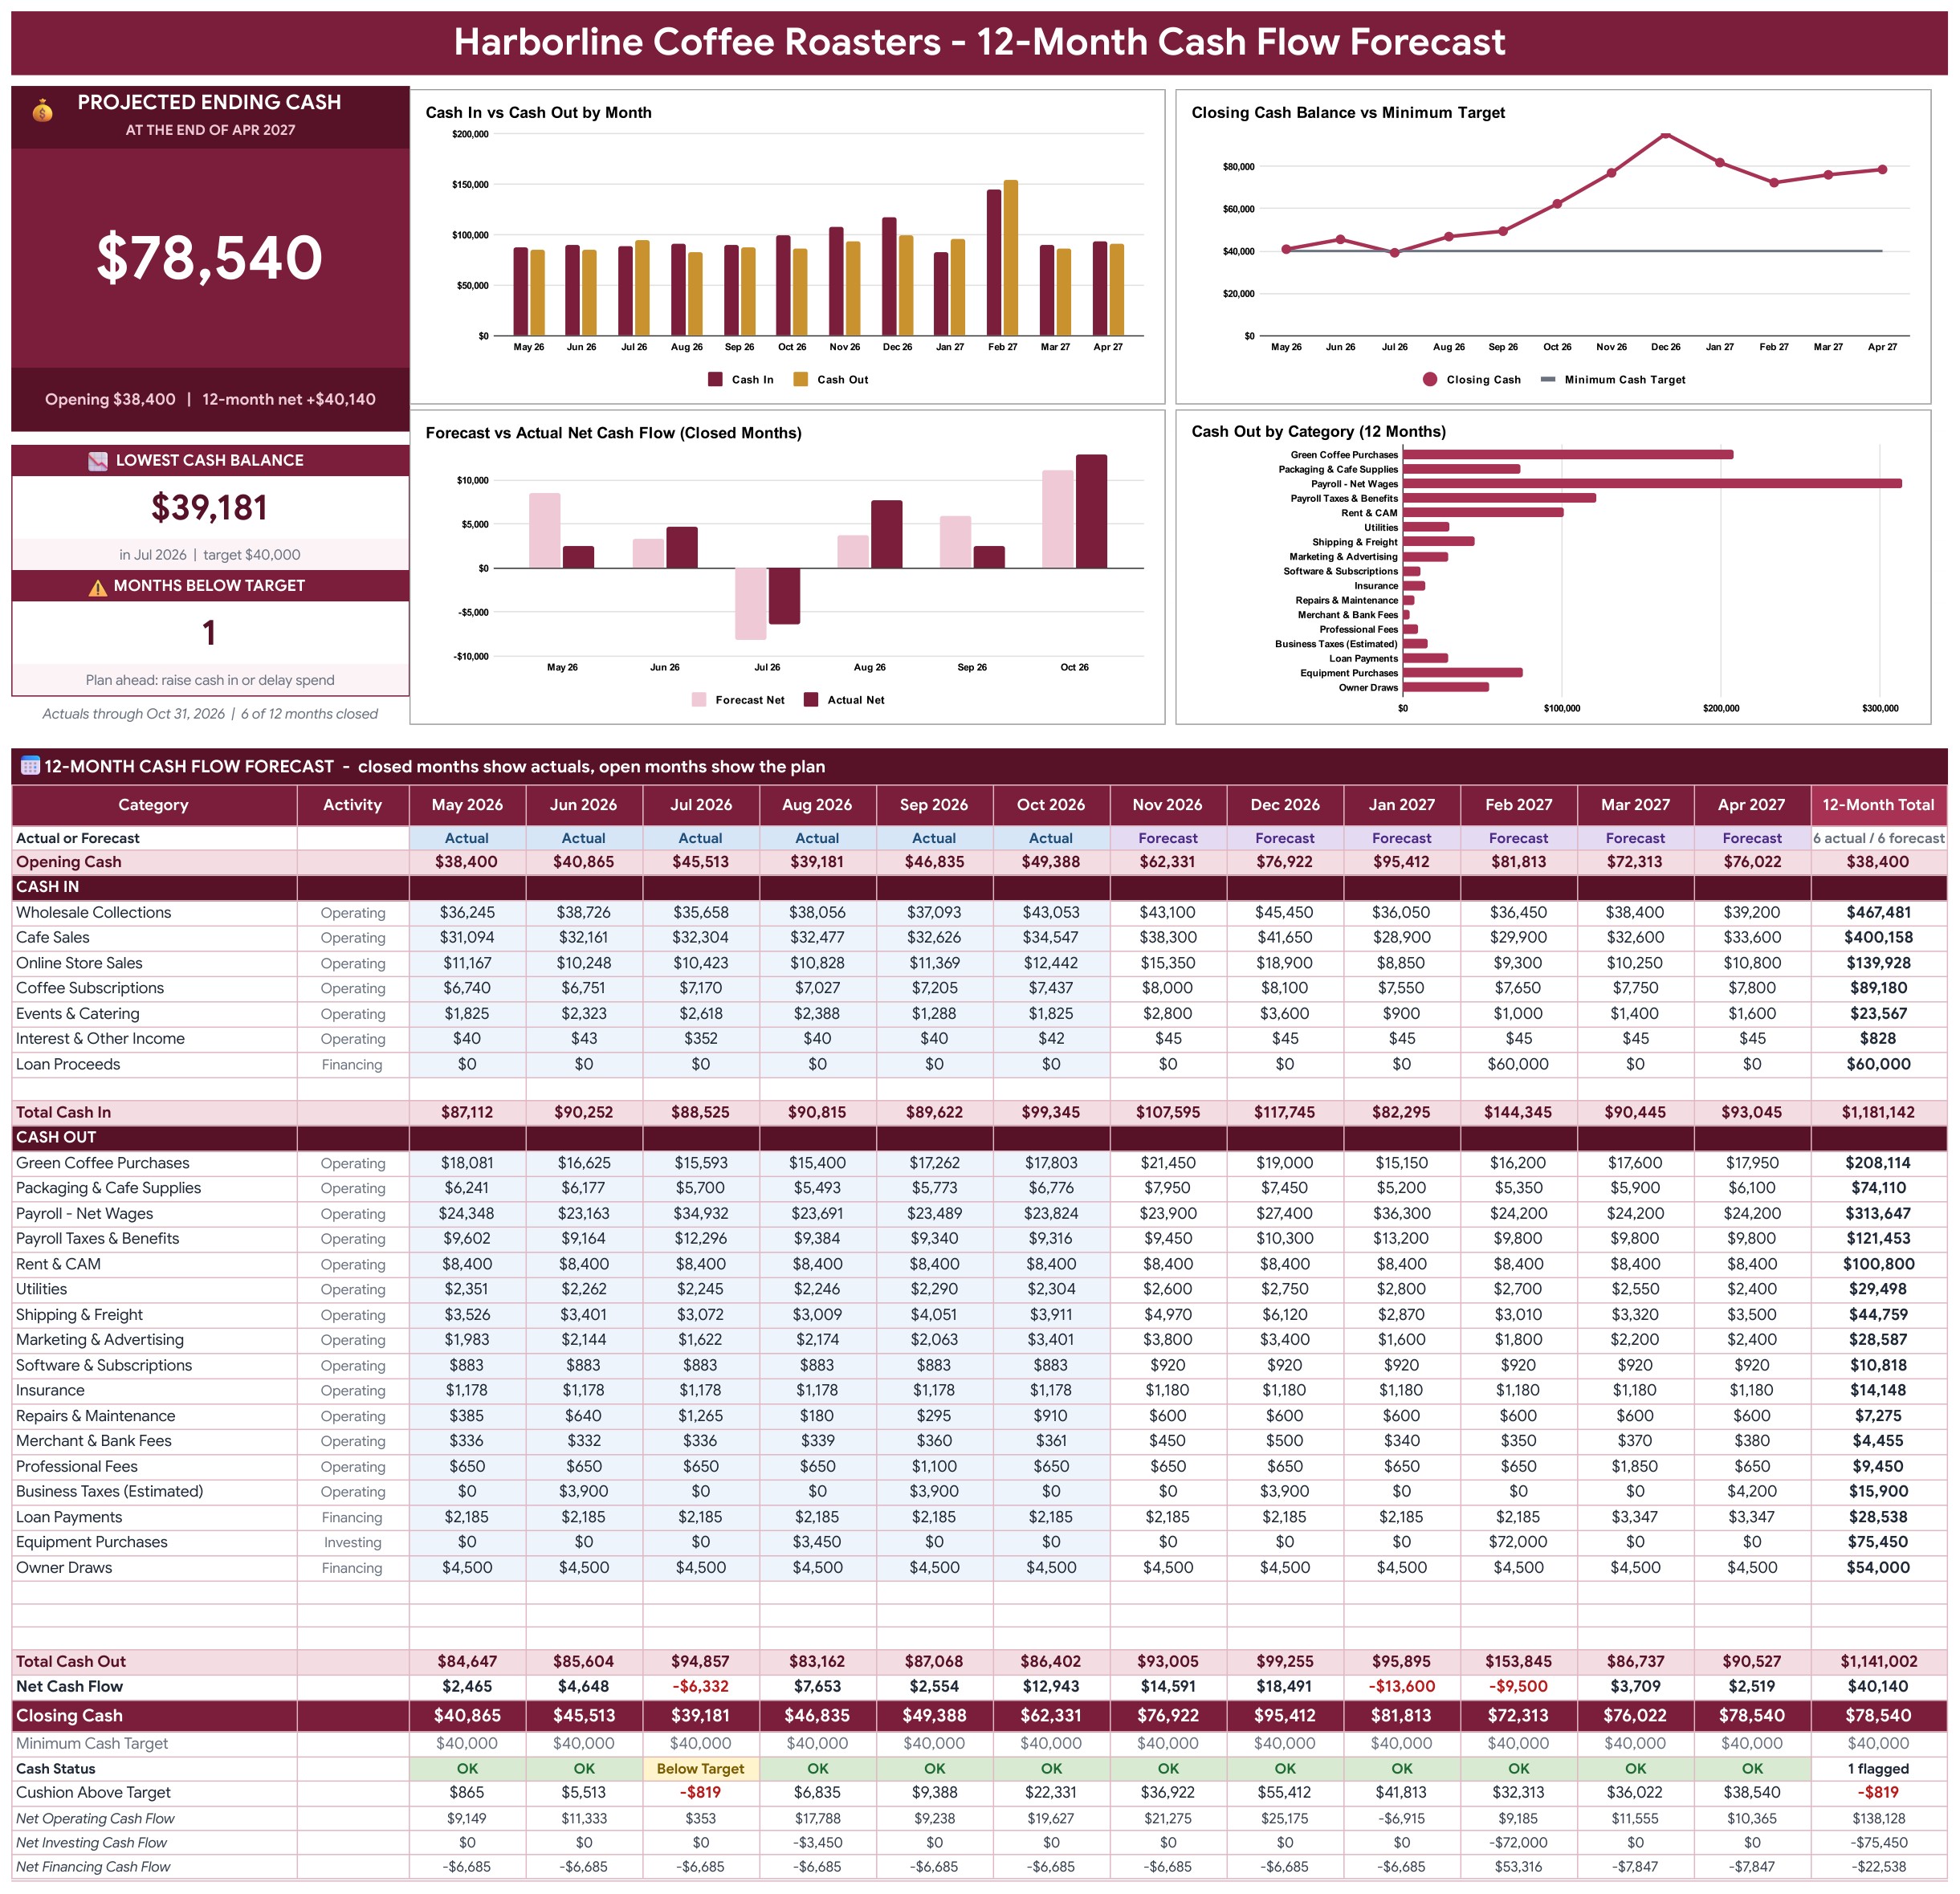
The Cash Flow Forecast tab opens with a Projected Ending Cash card, a Lowest Cash Balance tile and a Months Below Target tile beside four charts: Cash In vs Cash Out by Month, Closing Cash Balance vs Minimum Target, Forecast vs Actual Net Cash Flow for the closed months, and Cash Out by Category. Under them sits the 12-month statement, where closed months show your actuals and open months show your plan.
Page 2: Forecast Plan (Google Sheets)
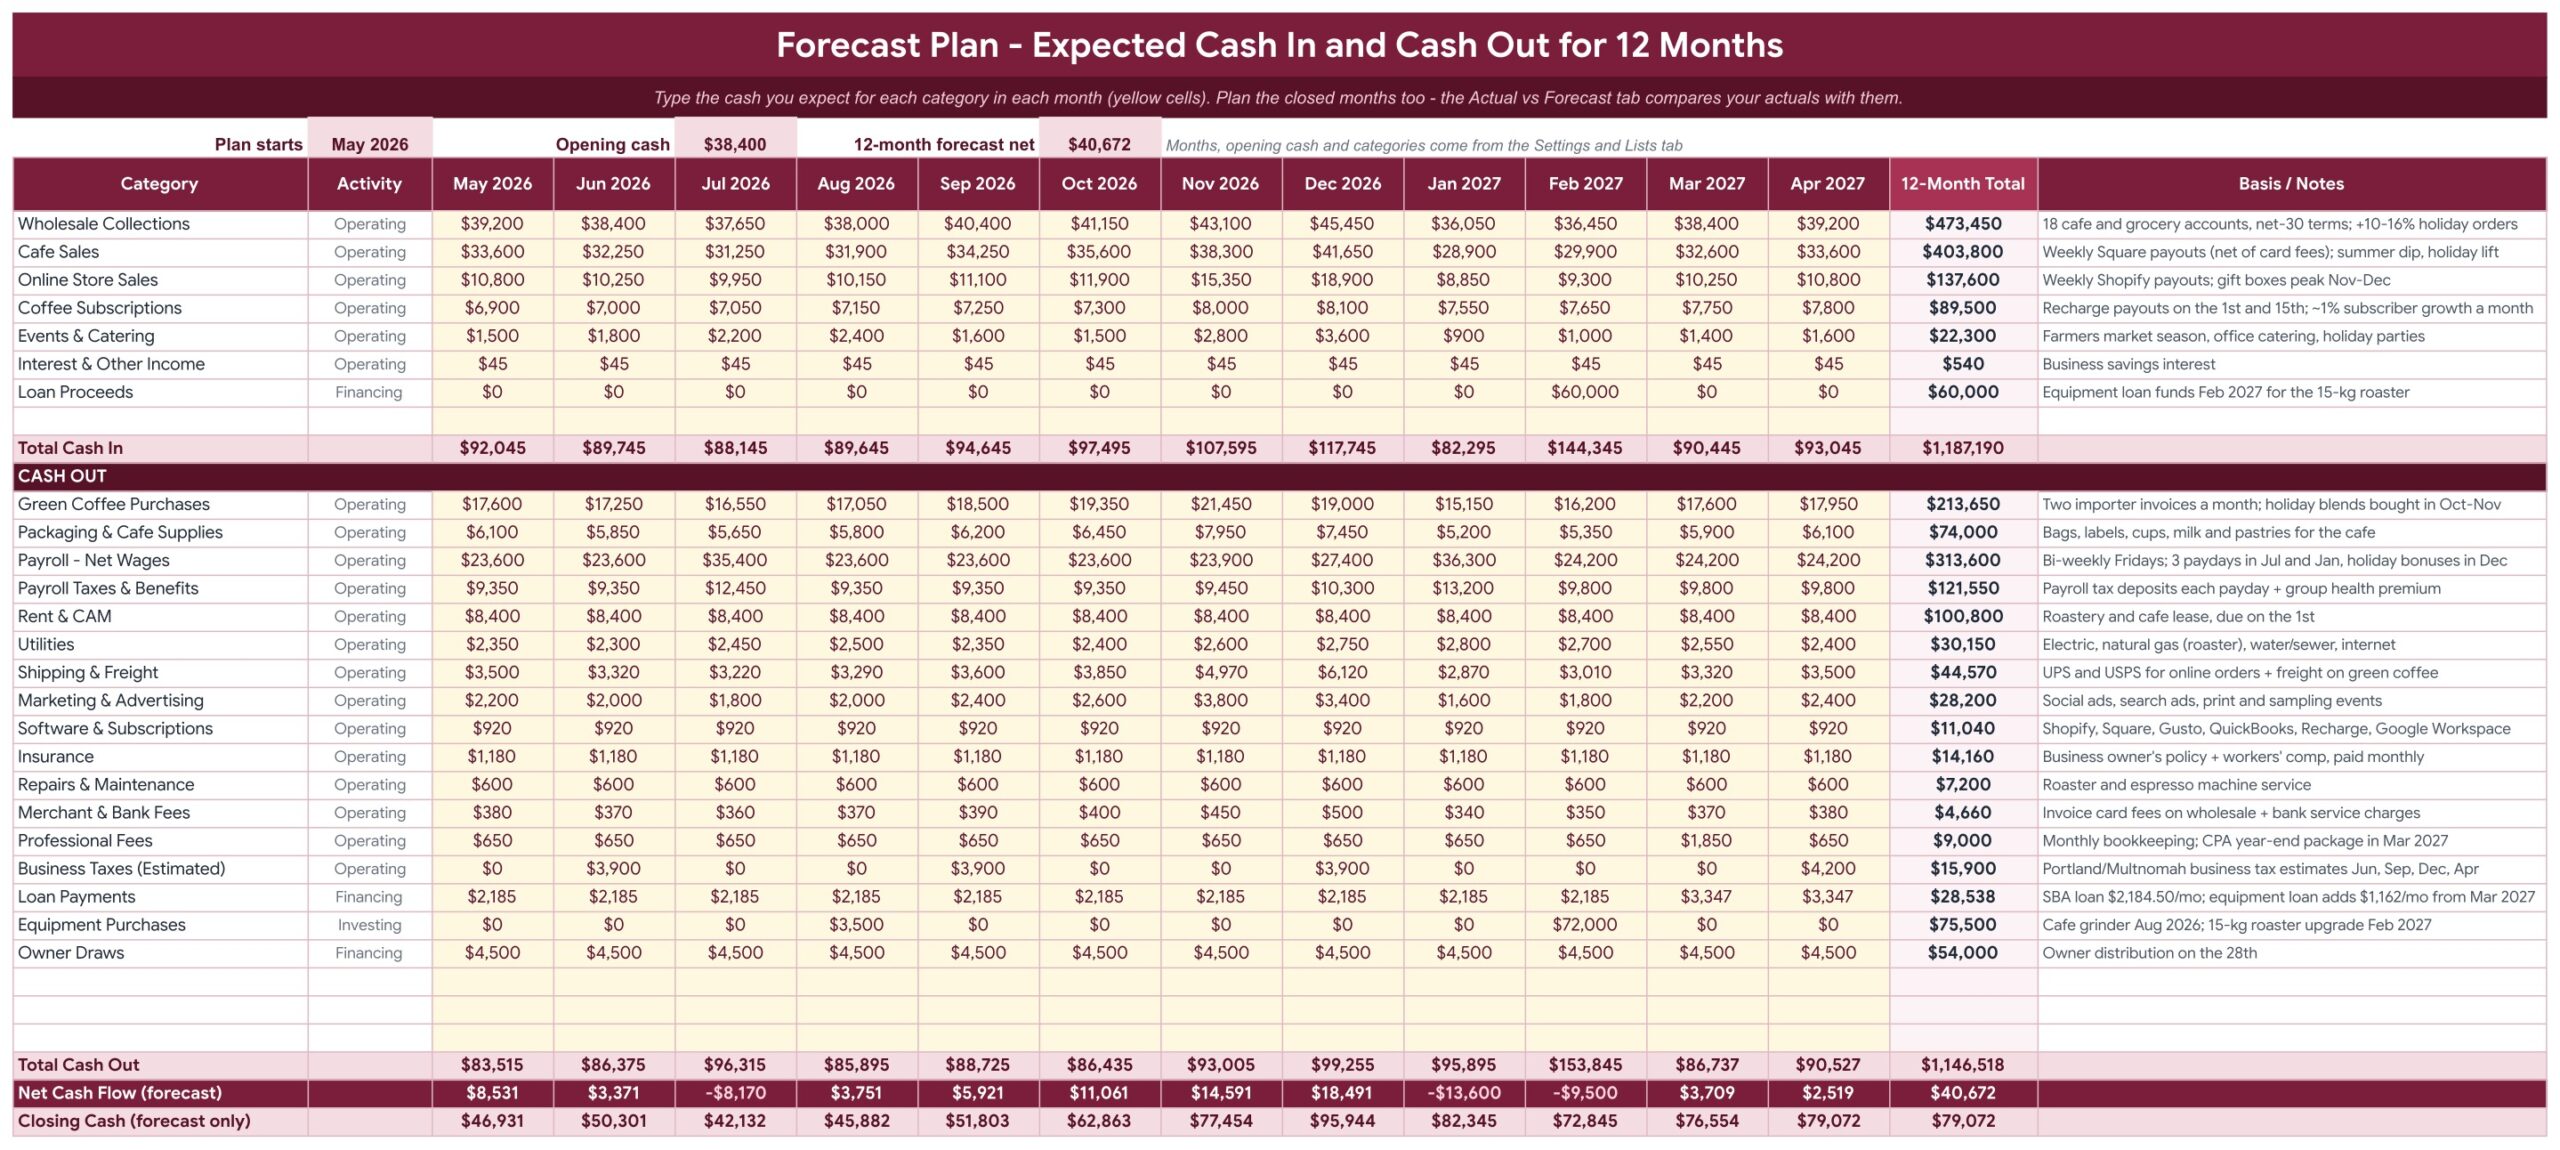
Type the cash you expect to receive and spend for each category in each of the 12 months in the yellow cells, with a Basis / Notes column for your assumptions. Totals, the forecast net cash flow and a forecast-only closing balance sit at the bottom.
Page 3: Actuals Log (Google Sheets)
Log every deposit and payment in one row: date, category, description, customer or vendor, payment method and a positive amount. The type, activity, month, net effect and a Check column fill in for you, and the log holds 2,000 rows.

Page 4: Actual vs Forecast (Google Sheets)
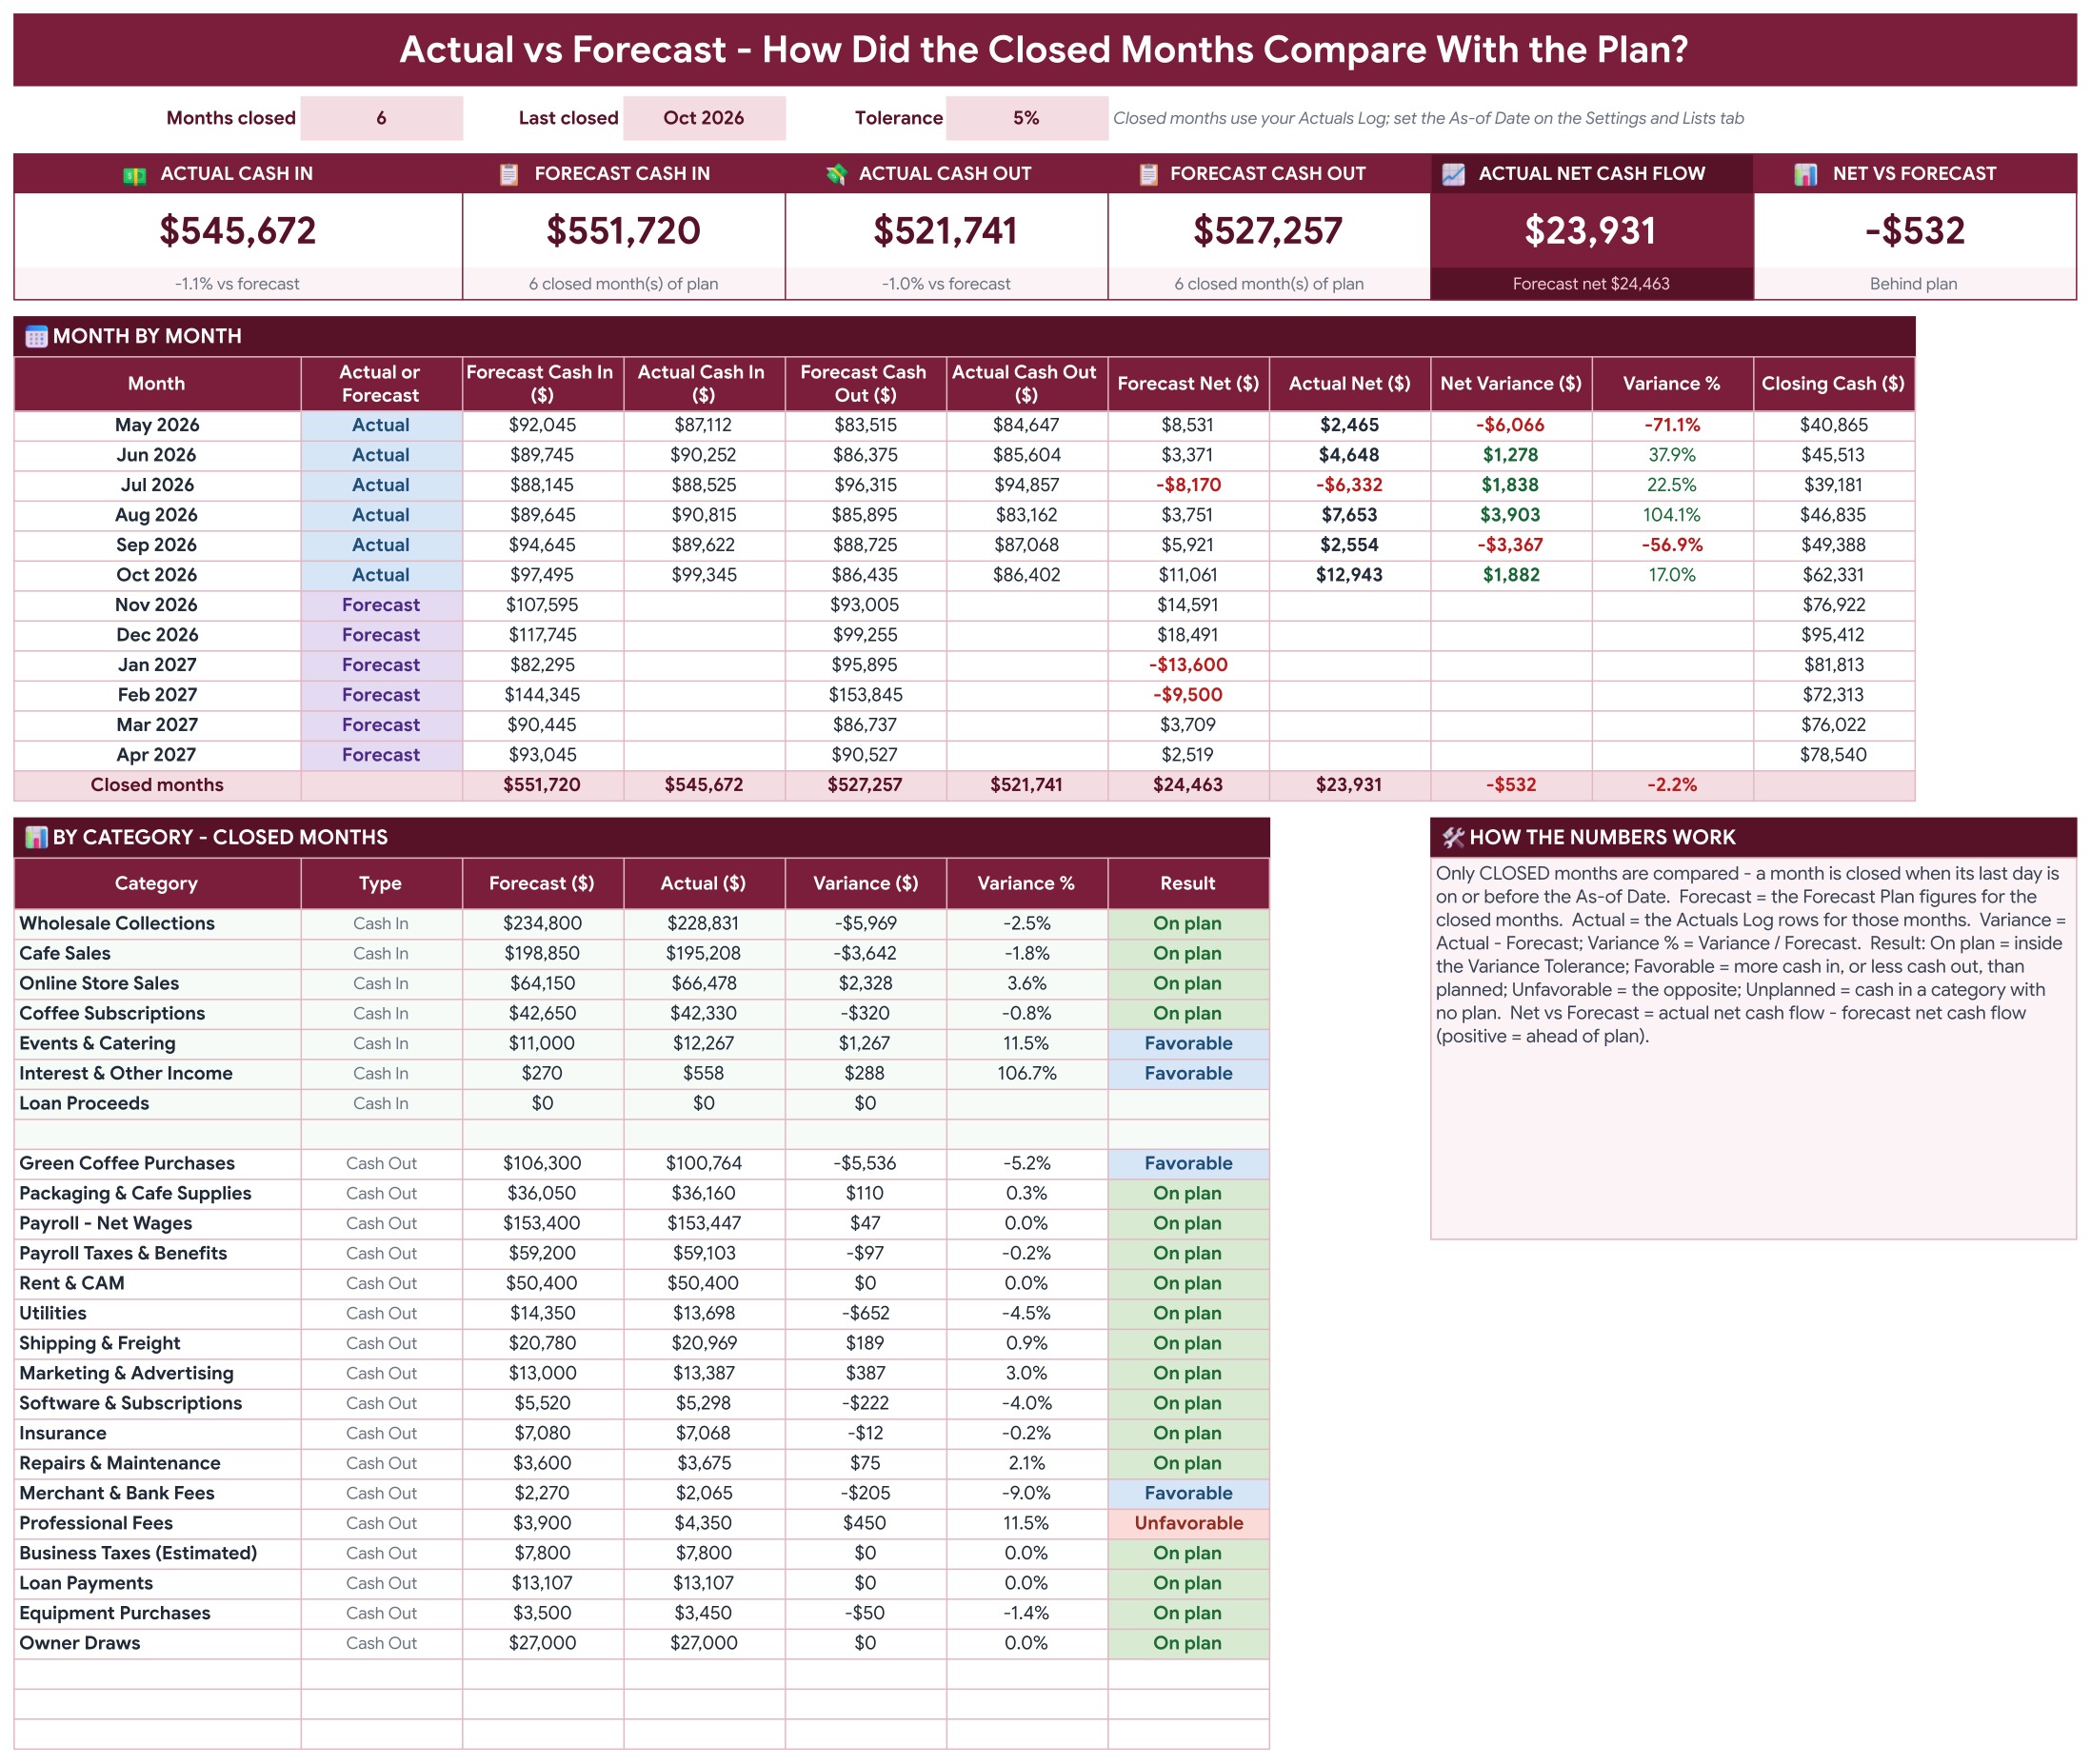
Six tiles compare actual and forecast cash in, cash out and net cash flow for the closed months. A month by month table shows forecast, actual and variance, and a category table marks every line On plan, Favorable, Unfavorable or Unplanned.
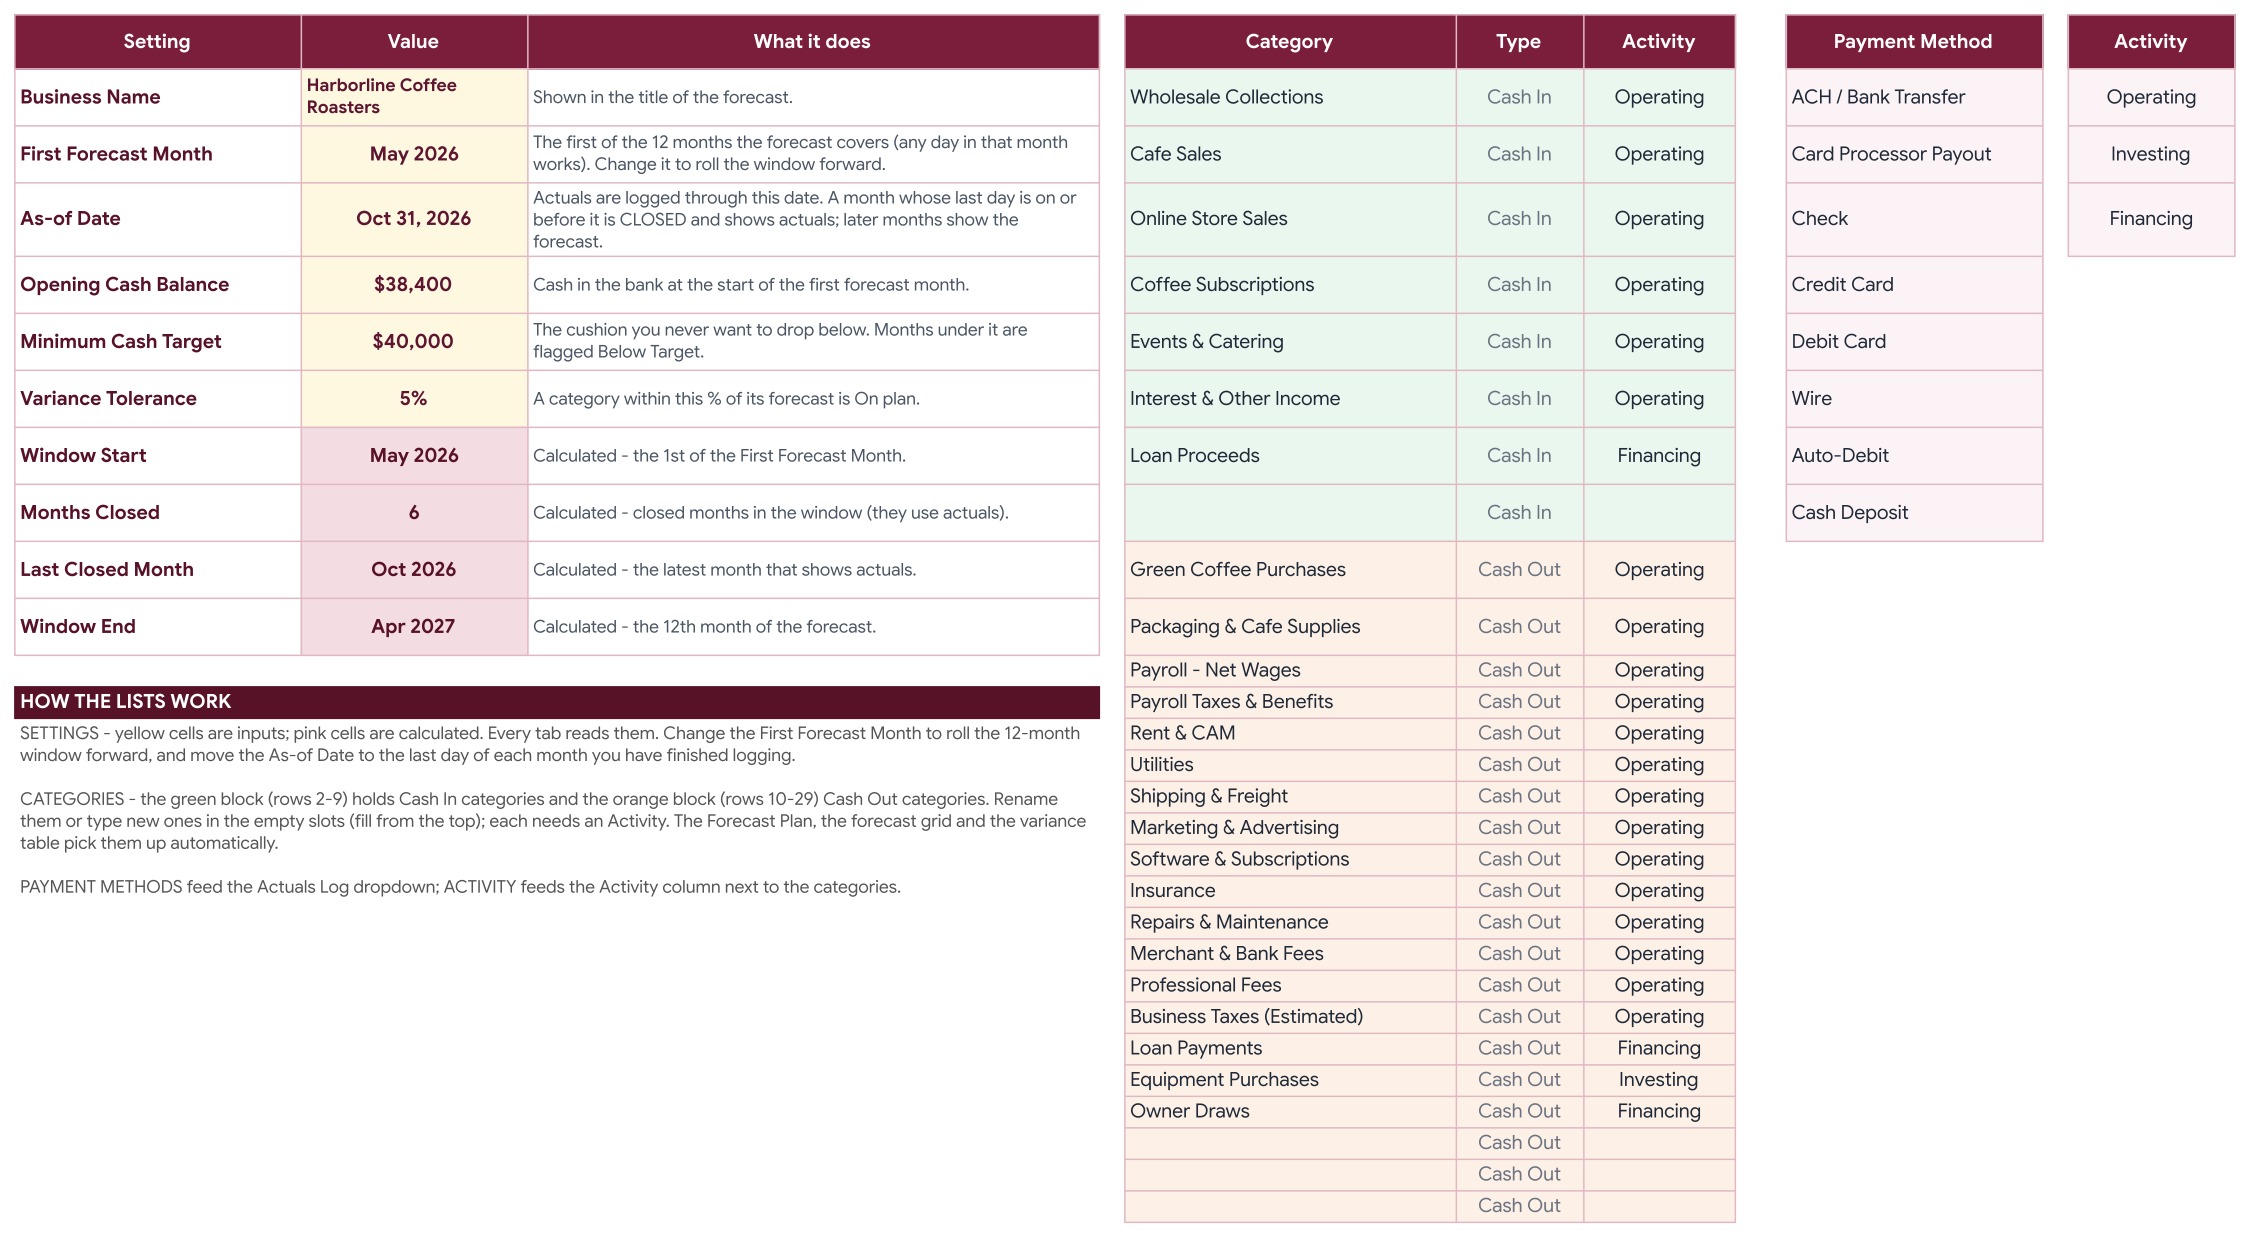
Page 5: Settings and Lists (Google Sheets)
Set the business name, the first forecast month, the As-of Date, the opening cash balance, the minimum cash target and the variance tolerance. Rename the 8 cash in and 20 cash out categories and the payment methods; the whole workbook follows.
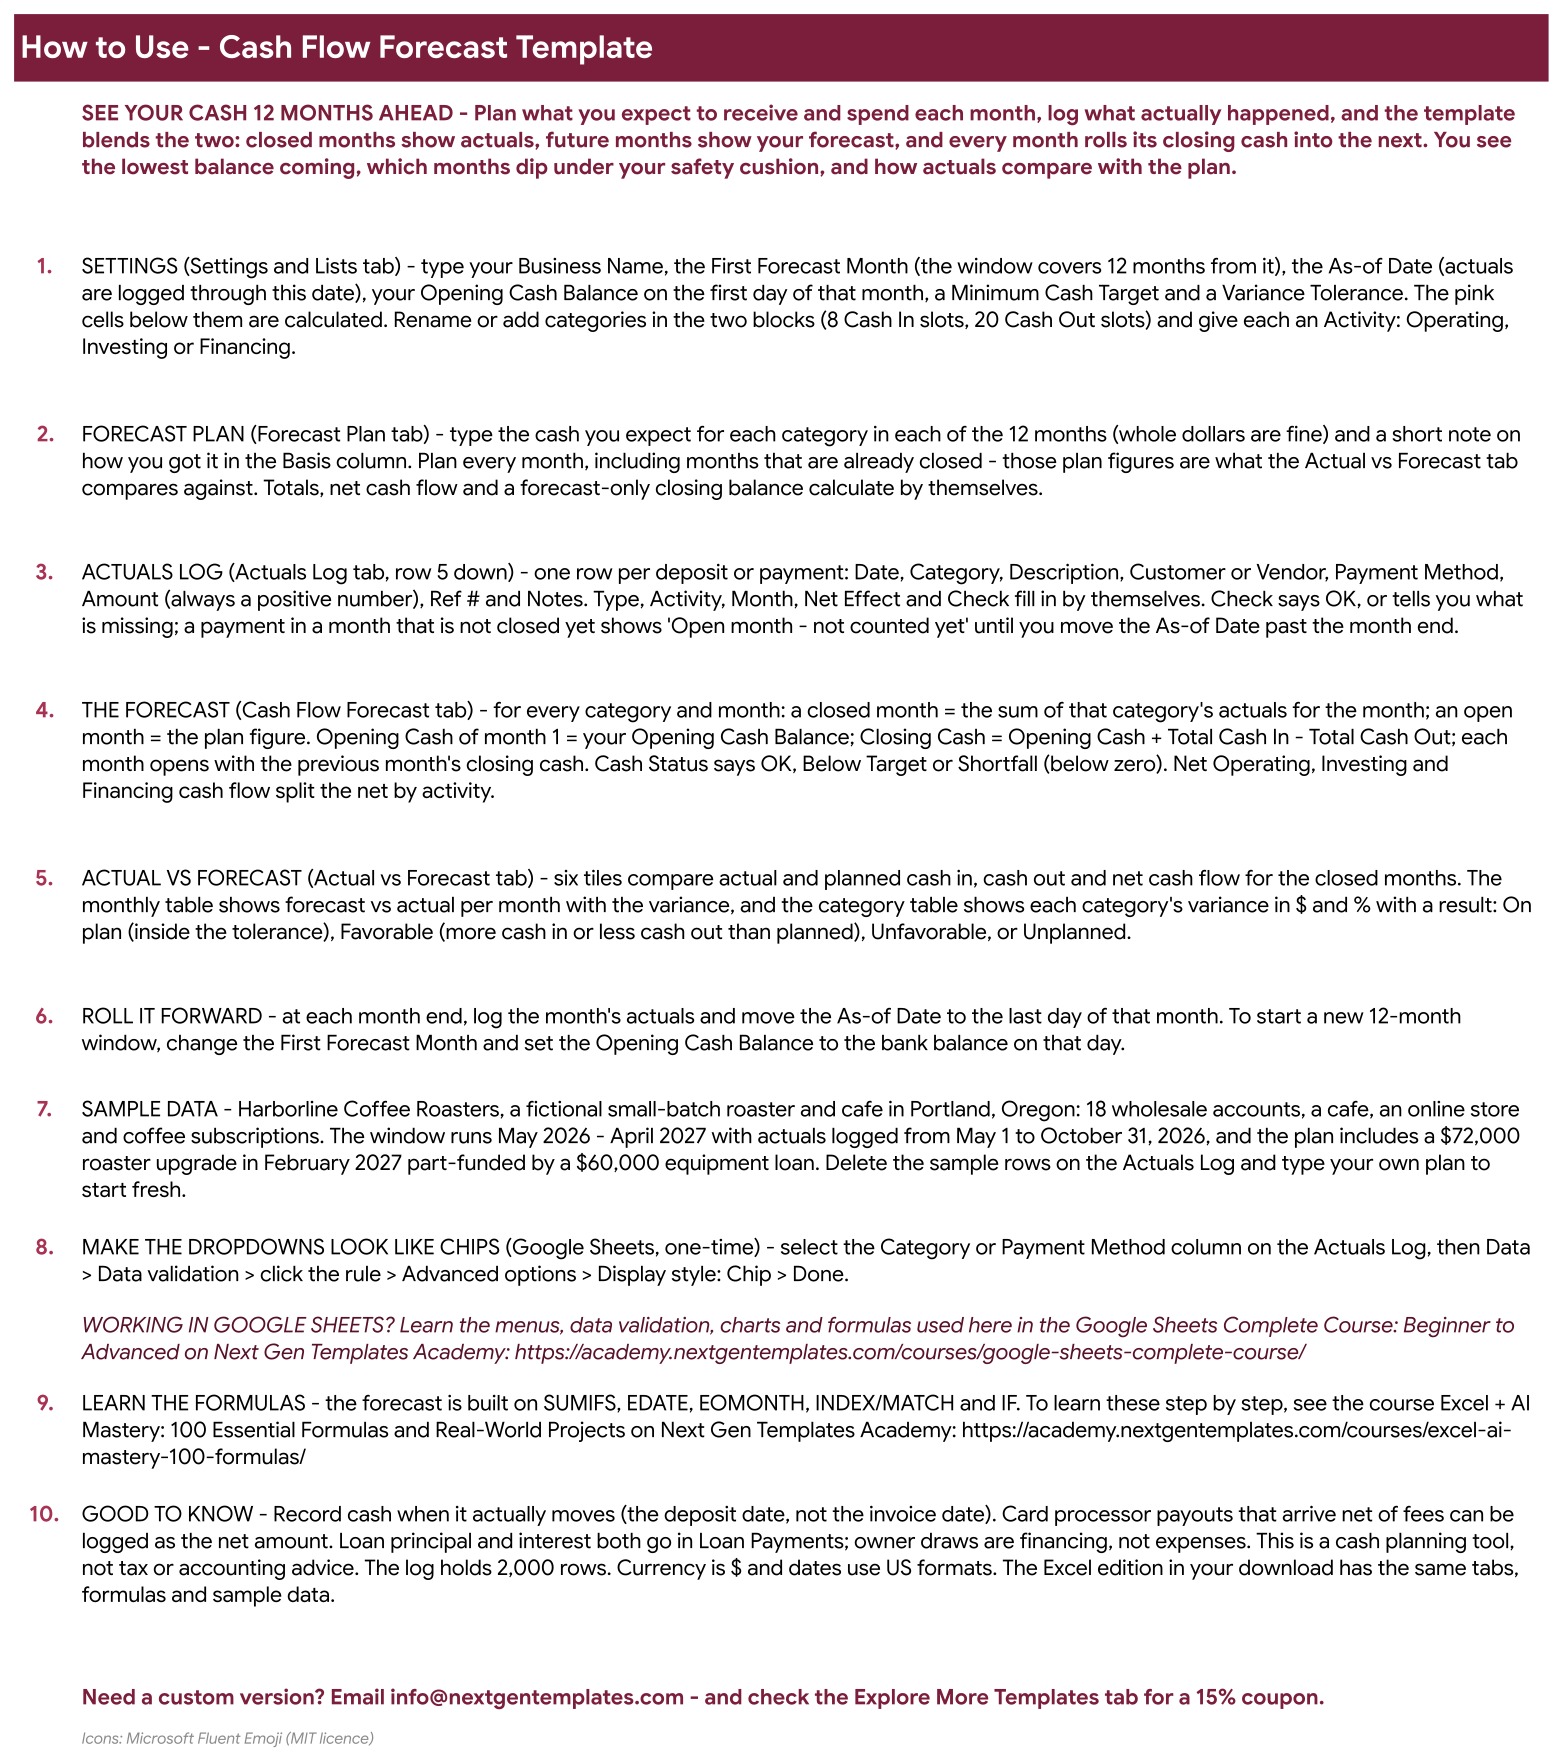
Page 6: Instructions (Google Sheets)
Step by step: set up the settings, plan the 12 months, log actuals, read the forecast and the variance tables, and roll the window forward each month.
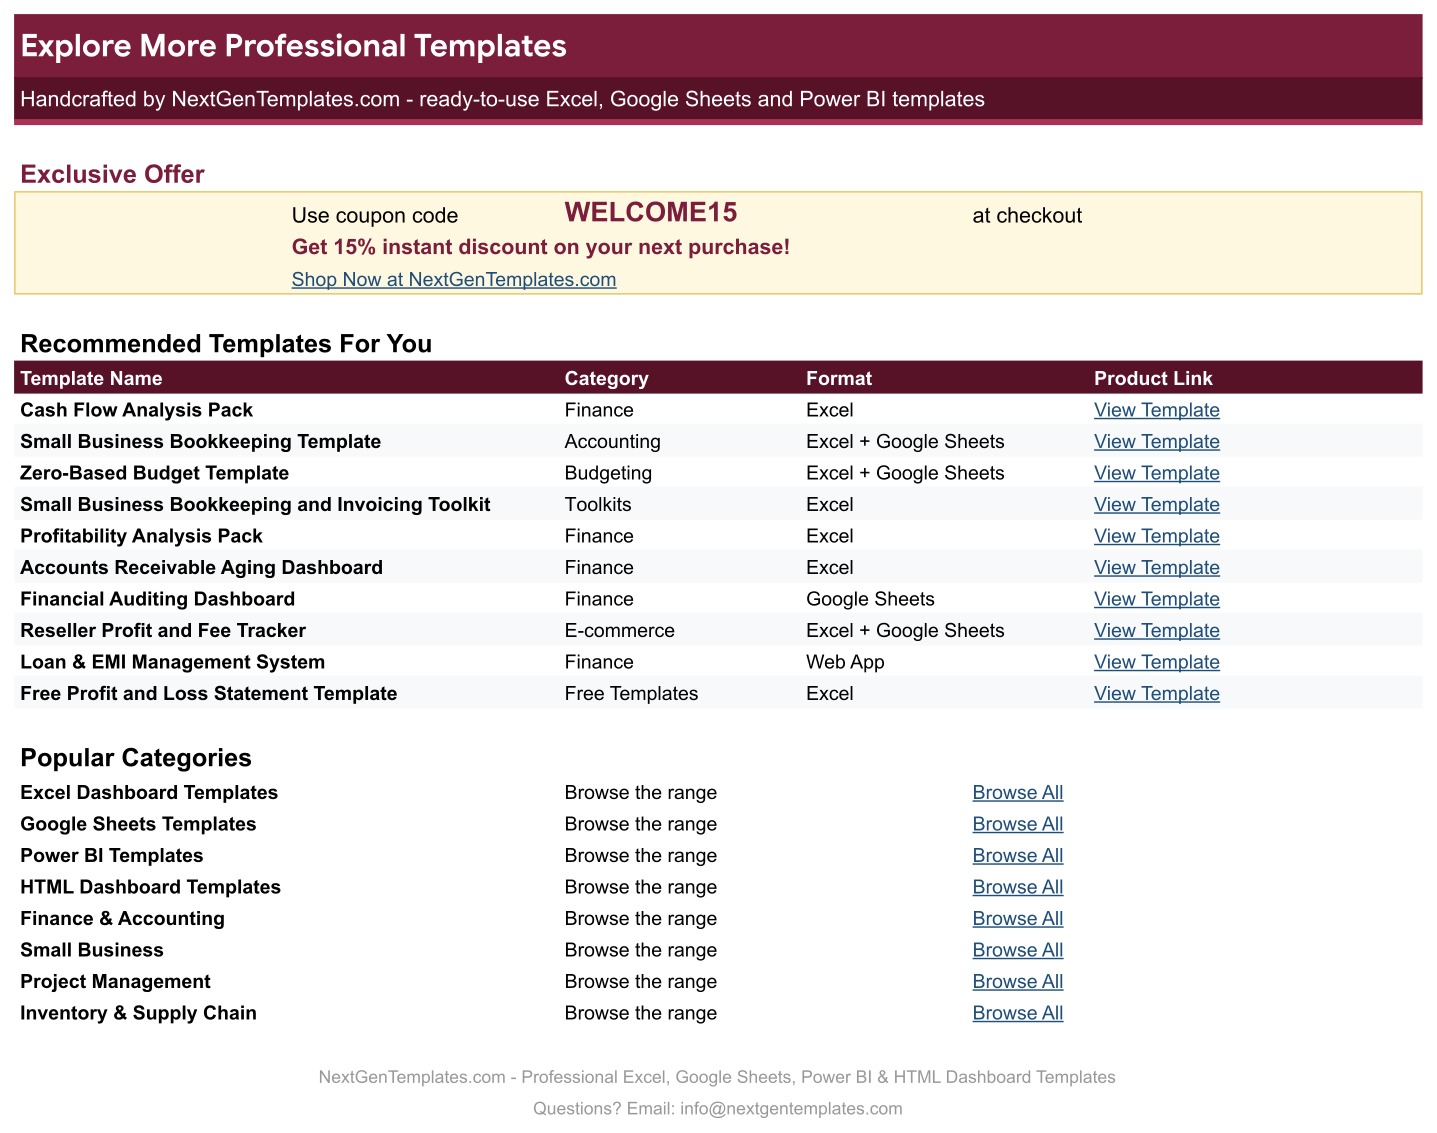
Page 7: Explore More Templates (Google Sheets)
Recommended templates and popular categories, plus a WELCOME15 coupon for 15% off your next purchase.
Page 8: Cash Flow Forecast (Excel edition)
The same cards, four charts and 12-month statement in Microsoft Excel, with the same formulas and sample data.
Page 9: Forecast Plan (Excel edition)
The 12-month plan in Excel: cash in and cash out by category, the Basis / Notes column, totals and the forecast-only closing cash.
Page 10: Actual vs Forecast (Excel edition)
The closed-month comparison in Excel: six tiles, the month by month variance table and the category result table.
📊 Cash Flow Forecast Template vs. Blank Spreadsheet vs. Accounting Software: Where This Fits
| Feature | Cash Flow Forecast Template (Google Sheets + Excel) | Blank spreadsheet | Accounting software |
|---|---|---|---|
| Cost | ✅ $6.99 one-time | Free to build, but your time | Monthly subscription |
| Platform | ✅ Google Sheets and Microsoft Excel, both included | One platform | Web app |
| 12-month forecast with actuals for closed months | ✅ Built in | You write the formulas | Often an add-on |
| Minimum cash target and Below Target flag | ✅ Yes | Build it yourself | Varies |
| Actual vs Forecast by category | ✅ Yes | Add it yourself | Varies |
| Your data stays in your own file | ✅ Yes | ✅ Yes | Stored with the vendor |
| Automatic bank import | No, you type each deposit and payment | No | ✅ Often yes |
For owners who want to see their cash 12 months ahead and compare it with what really happened, without a subscription, this template sits in the sweet spot.
👥 Who This Template Is For, and Who It’s Not For
✅ This template is built for:
- Small business owners who want to know in advance which month will be the tightest
- Freelancers and consultants with uneven income who need a cash cushion
- Finance managers who report cash against a plan every month
- Startups planning a loan, an equipment purchase or a seasonal peak
❌ This template is NOT for:
- Teams that want deposits and payments imported automatically from a bank
- Businesses that need bookkeeping, invoicing or tax filing
- Anyone who needs a daily or weekly 13-week cash view, because this one forecasts by month
⚙️ How to Use the Cash Flow Forecast Template
- Open the PDF guide and click the “Make a copy” link for Google Sheets, or open the Excel file.
- On the Settings and Lists tab, enter your business name, the first forecast month, the As-of Date, your opening cash and your minimum cash target.
- On the Forecast Plan tab, type what you expect to receive and spend in each category for the 12 months.
- Log every deposit and payment on the Actuals Log tab.
- Read the Cash Flow Forecast tab: projected ending cash, lowest month and months below target.
- Open Actual vs Forecast to see which categories ran over or under plan, then move the As-of Date forward each month.
💼 Real-World Use Cases
A coffee roaster plans a $72,000 roasting machine for February, part funded by a $60,000 equipment loan, and sees the closing cash line before it signs.
A consultant with uneven income sets a $40,000 minimum cash target and sees at once that July dips just under it.
A finance manager closes October, logs the actuals and opens Actual vs Forecast to explain why professional fees came in 11.5% over plan.
❓ Frequently Asked Questions
What is a cash flow forecast?
A cash flow forecast estimates the cash coming in and going out of your business month by month, so you can see your expected bank balance and spot a shortfall before it happens.
How does it treat closed and future months?
A month is closed when its last day is on or before the As-of Date on the Settings and Lists tab. Closed months show your real figures from the Actuals Log. Every month after that shows your Forecast Plan.
Does it work in Google Sheets and in Excel?
Yes. The ZIP holds an Excel edition (.xlsx, no macros) and a PDF guide with the Make a copy link for Google Sheets. Both have the same seven tabs, formulas and sample data.
What is the minimum cash target?
It is the cushion you want to keep in the bank. Any month that closes below it is flagged Below Target, and a negative balance is flagged Shortfall.
Can I rename the categories?
Yes. Rename the 8 cash in and 20 cash out categories and the payment methods on the Settings and Lists tab, and the plan, the log and the reports follow.
What does the sample data show?
A fictional coffee roaster and cafe in Portland, planned from May 2026 to April 2027 with actuals logged through October 31, 2026. July dips below the $40,000 target on purpose, so you can see how the Below Target flag looks.
Does it connect to my bank?
No. You type or paste each deposit and payment yourself. It does not import from a bank or accounting software.
Can I change the currency?
Yes. Currency is $ by default. Select the amount columns and change the number format. Dates use the US format.
👤 About the Author
Built by PK, Microsoft Certified Professional with 15+ years of Excel, Google Sheets and Power BI experience. Founder of NextGenTemplates. Every template is hand-built and tested before release. Watch the walkthroughs on @PKAnExcelExpert and @NextGenTemplates.
🔗 Explore Related Templates
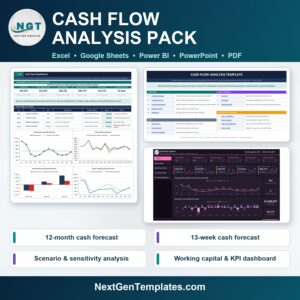
📌 Cash Flow Analysis Pack: a closer look at cash coming in and going out.
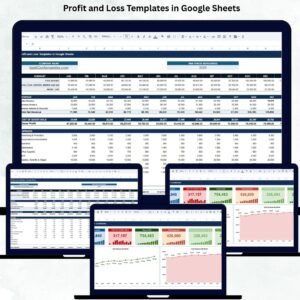
📌 Profit and Loss (P&L) Template in Excel: the profit side of the same business.
📌 Zero-Based Budget Template in Excel and Google Sheets: plan a personal or household budget the same way.
Browse every Google Sheets template in the store.
🎥 Visit our YouTube channel for step-by-step video tutorials
👉 YouTube.com/@NextGenTemplates
📅 Last updated: November 2026
Reviews
There are no reviews yet.