

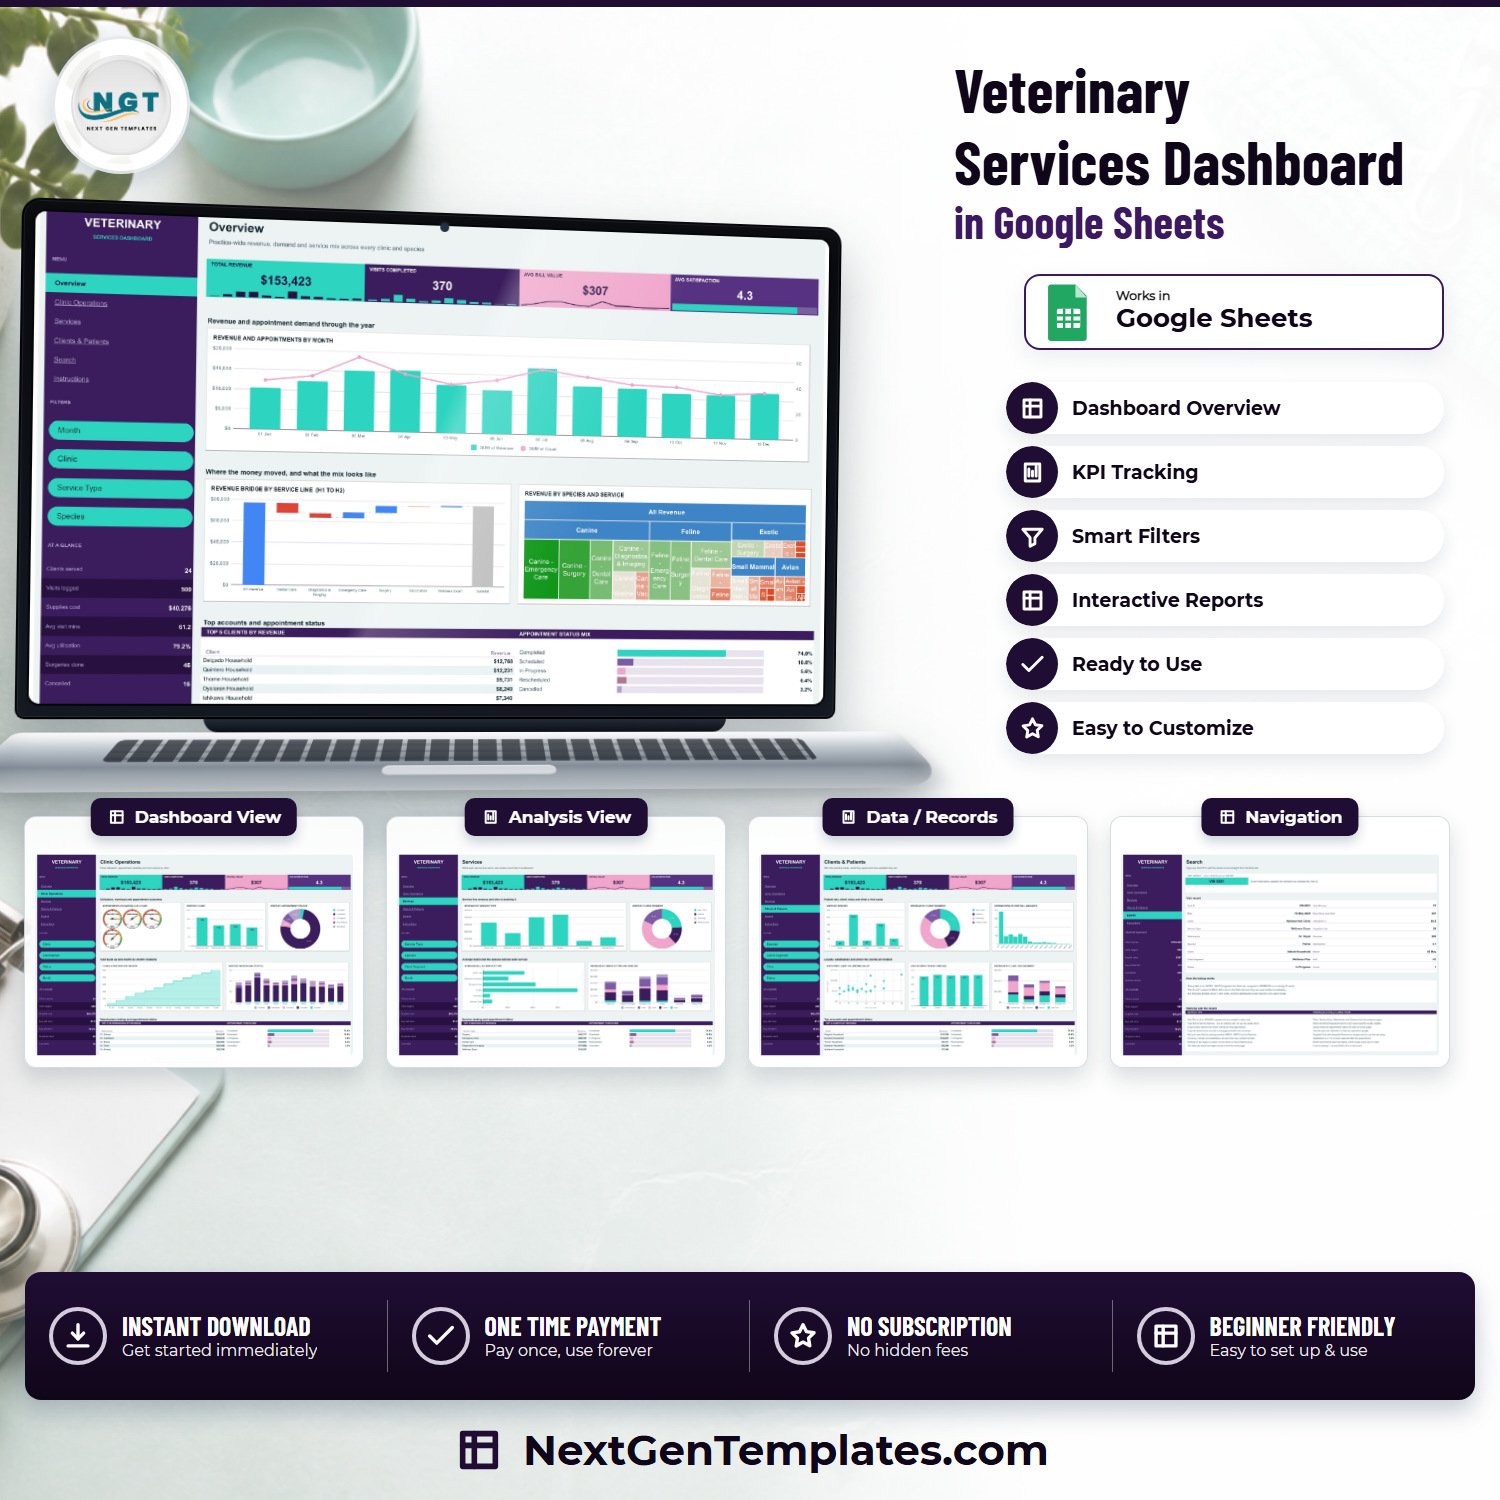
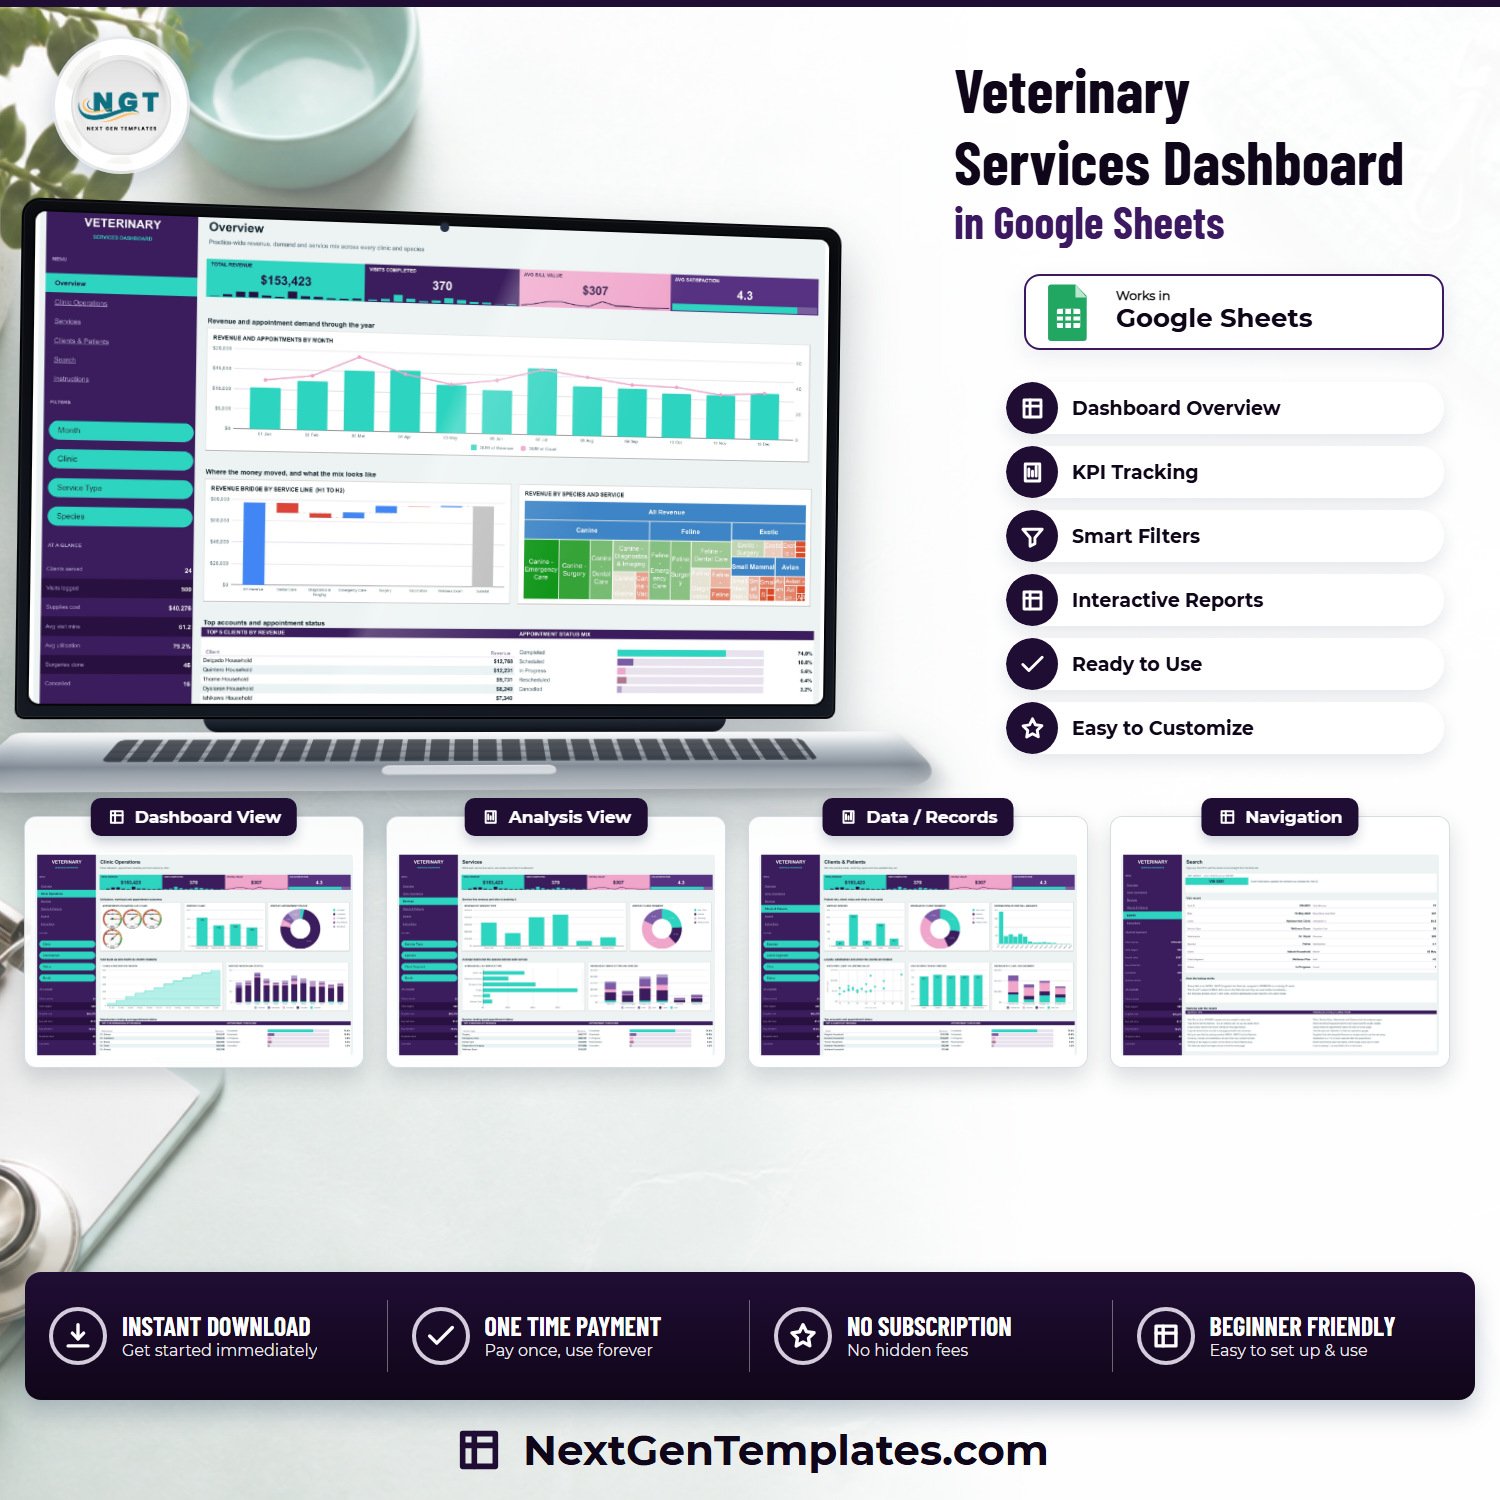

The Veterinary Services Dashboard in Google Sheets turns a flat list of appointments into a reporting pack a practice group can actually read. It ships with 500 sample visits across 18 columns, seven tabs, 18 charts and 16 slicers, all driven by native Google Sheets pivot tables. Built by a Microsoft Certified Professional with 15+ years of spreadsheet work, sold as a one-time purchase with no subscription, and delivered as a view-only master you copy into your own Google Drive in about two minutes. Replace the sample rows with your own visit exports and every card, chart and lookup redraws itself.Veterinary Services Dashboard in Google Sheets
Key Features of the Veterinary Services Dashboard in Google Sheets
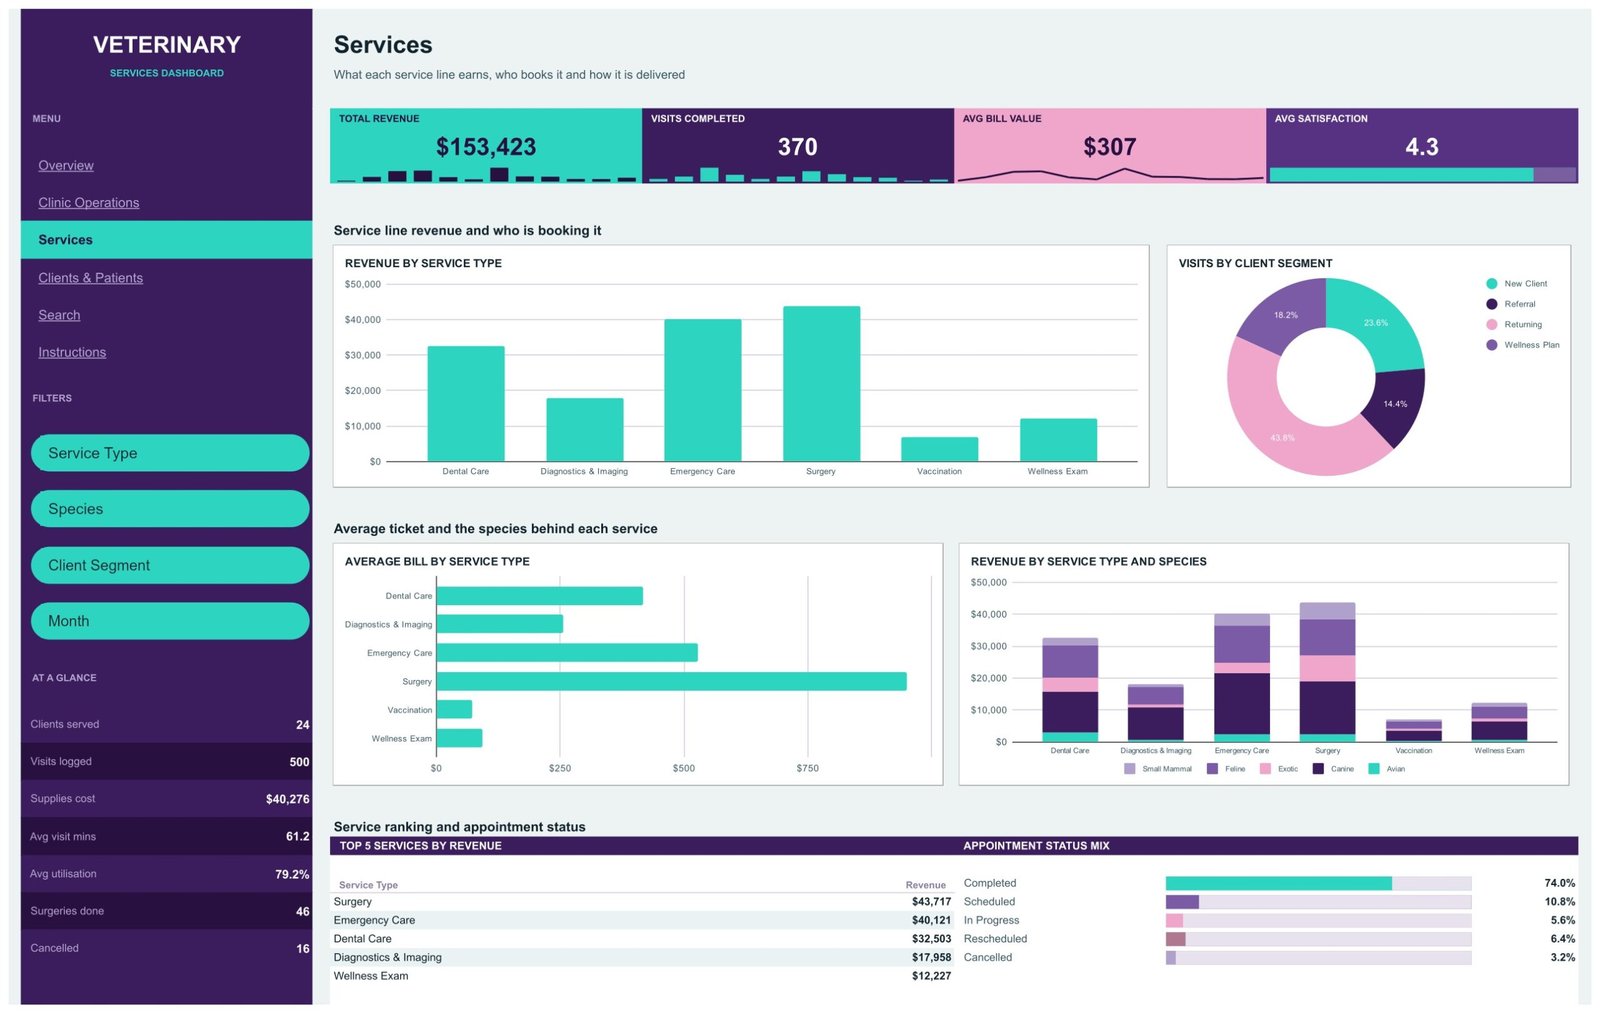
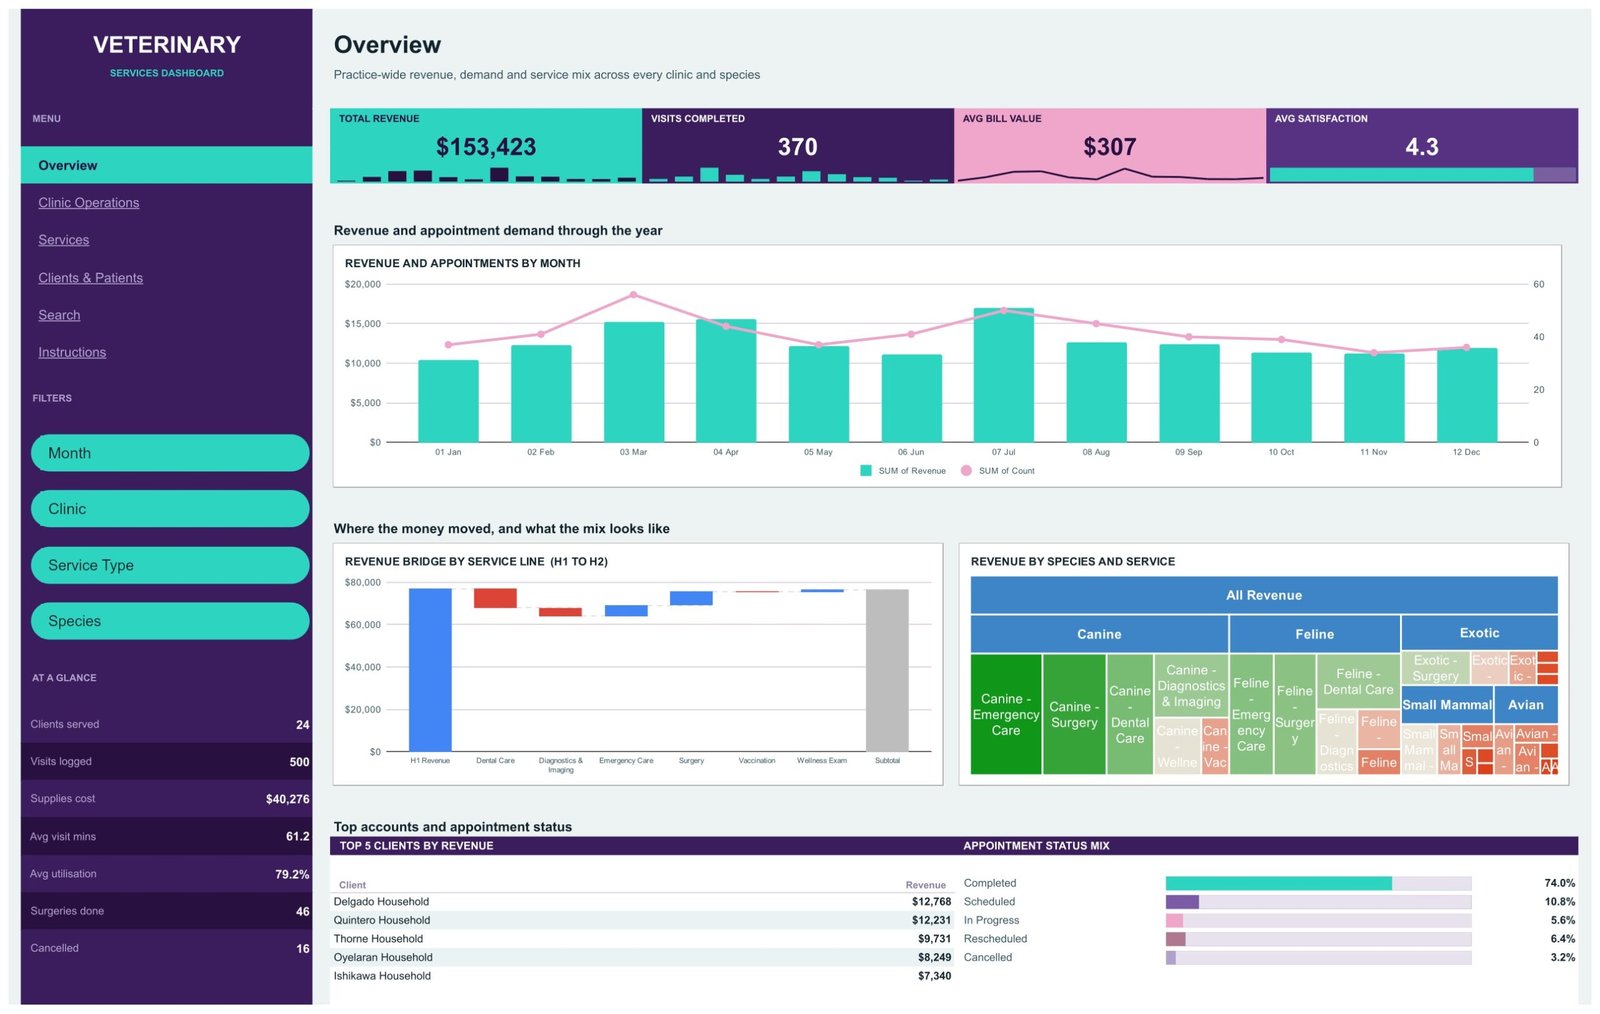
- Four KPI cards on every analysis page – Total Revenue, Visits Completed, Avg Bill Value and Avg Satisfaction, each with its own inline mini chart, so the headline never leaves the screen.Veterinary Services Dashboard in Google Sheets
- An “At a glance” rail carrying seven secondary numbers: clients served, visits logged, supplies cost, average visit minutes, average utilisation, surgeries done and cancellations.Veterinary Services Dashboard in Google Sheets
- 18 charts driven by native pivot tables – a revenue-and-appointments combo chart, a revenue bridge by service line (H1 to H2), a species-and-service treemap, four utilisation gauges, a cumulative visit build, a bill-amount histogram and a visits-per-client scatter, among others.Veterinary Services Dashboard in Google Sheets
- 16 slicers, four per analysis page, stacked in the left rail: Month, Clinic, Service Type, Species, Veterinarian, Status and Client Segment depending on the page.Veterinary Services Dashboard in Google Sheets
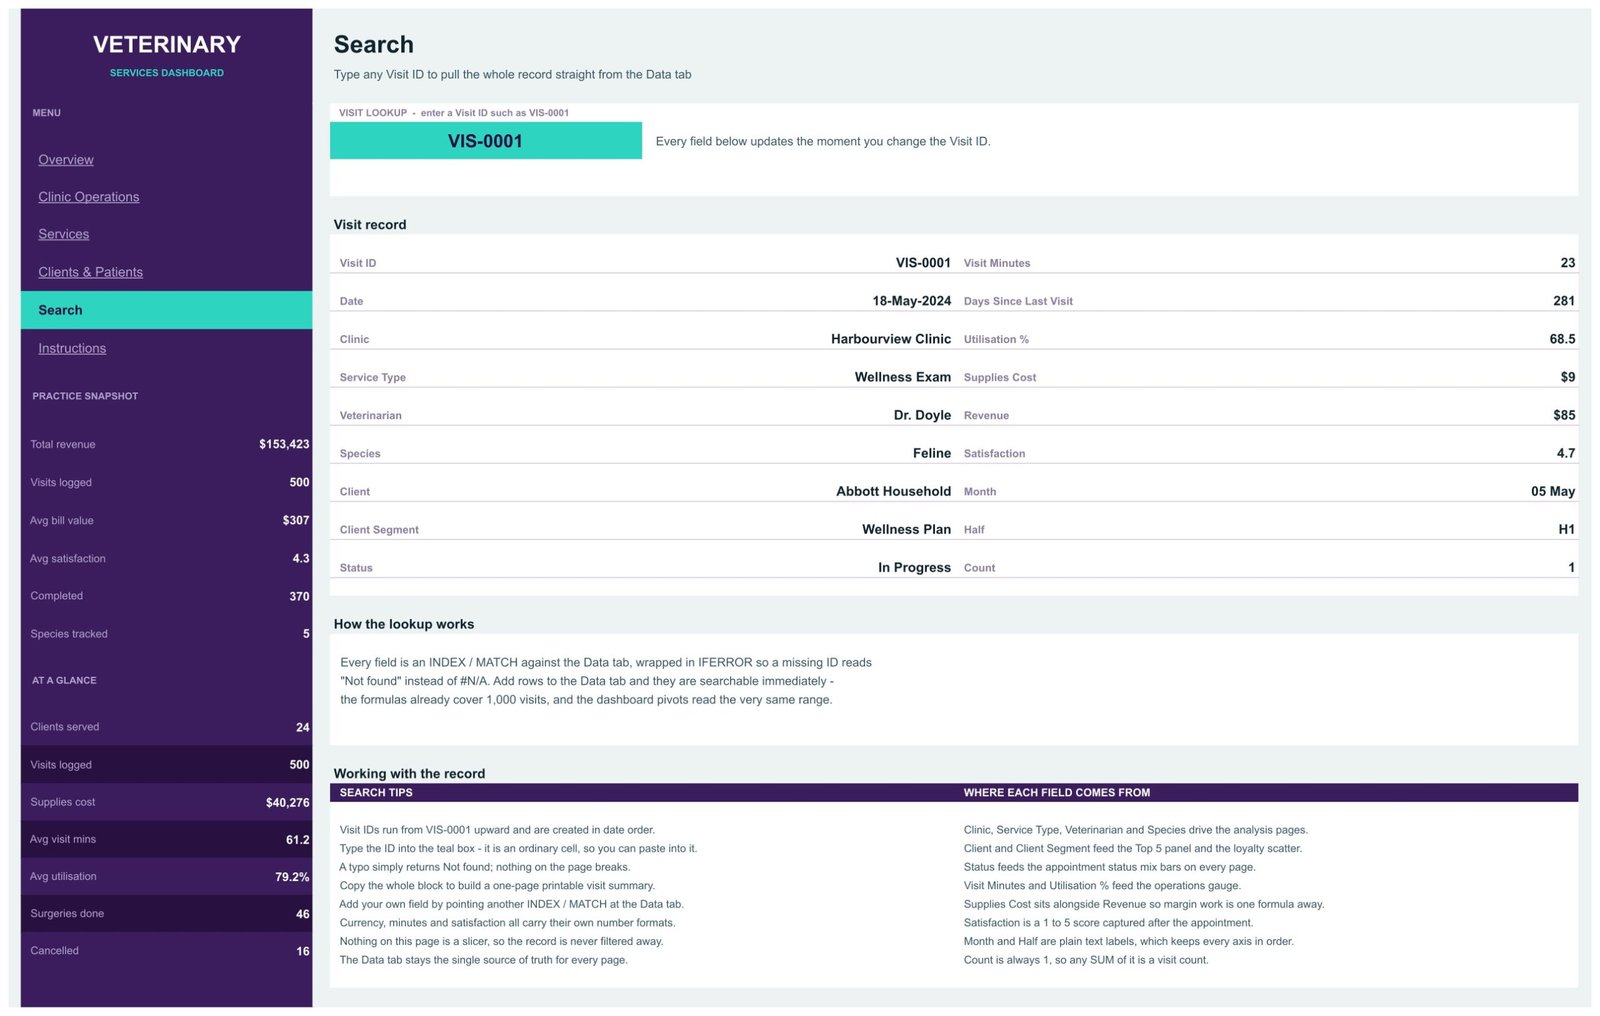
- A Search page that pulls any single visit record by Visit ID through INDEX / MATCH wrapped in IFERROR, showing all 18 fields at once.
- Room for 1,000 visits – the pivots and lookups already read A1:R1001, so you can paste in twice the sample volume before extending anything.
- Nothing hard coded – rename a species, a service line or a client segment on the Data tab and every chart follows without a formula edit.
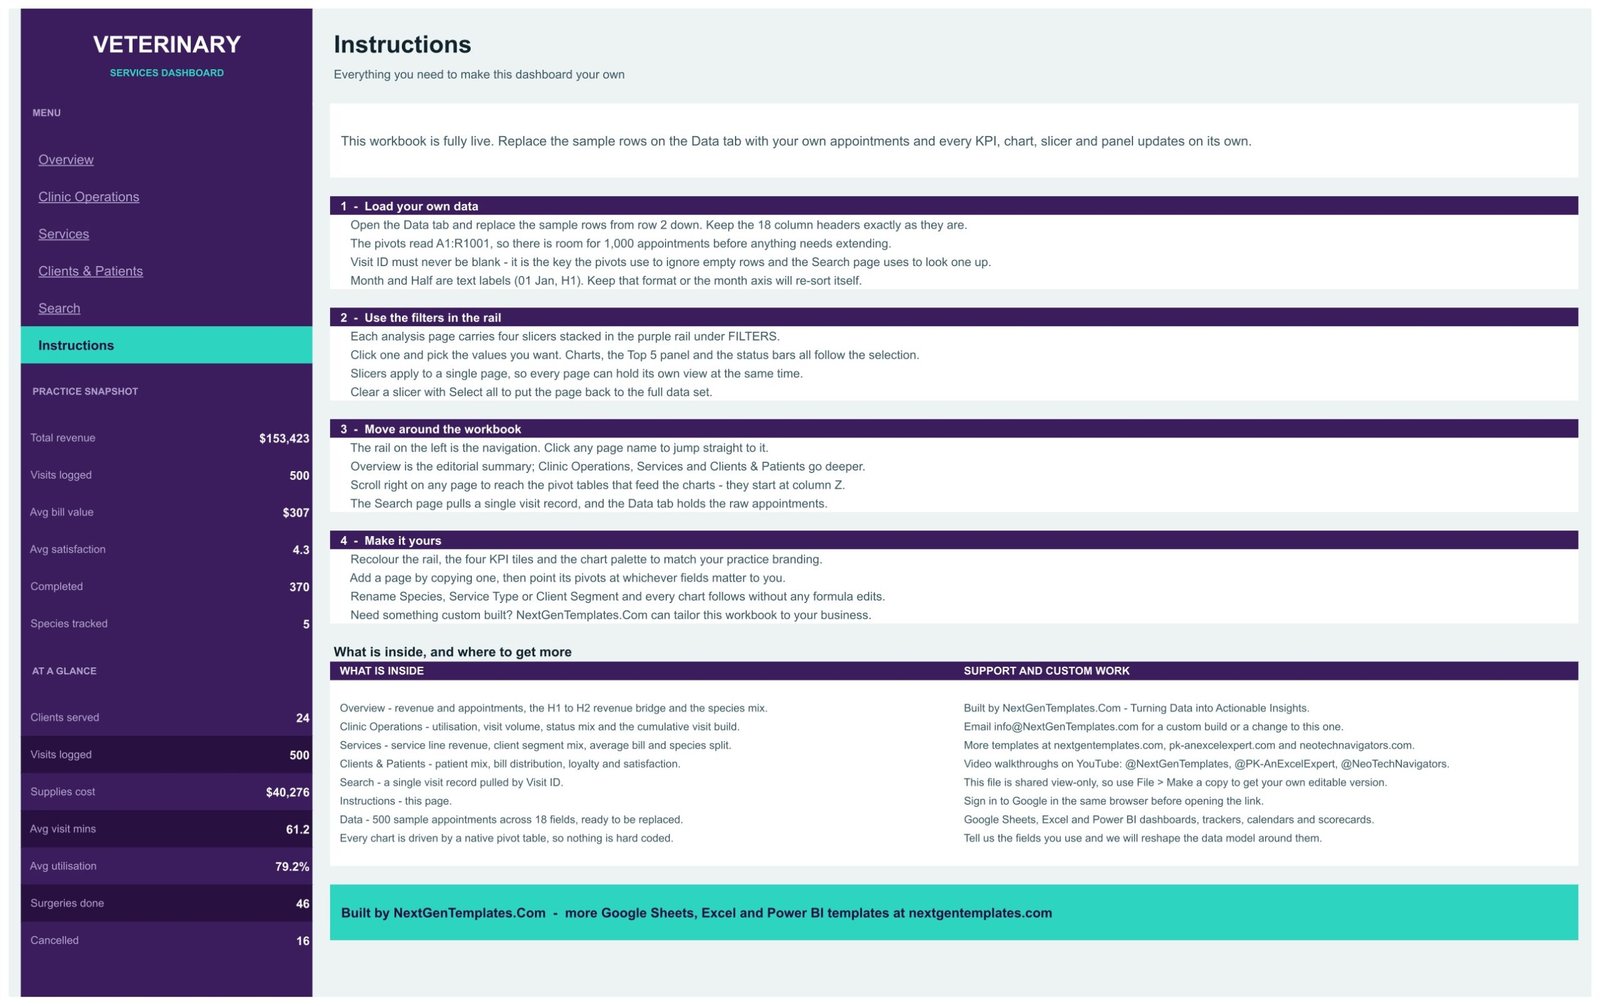
- A built-in Instructions page covering data loading, the slicers, navigation and re-colouring, so the workbook explains itself.
What’s Inside the Veterinary Services Dashboard in Google Sheets
1. Overview – the practice-wide summary: Revenue and Appointments by Month, the Revenue Bridge by Service Line (H1 to H2), Revenue by Species and Service as a treemap, a Top 5 Clients by Revenue table and an appointment status mix bar set.
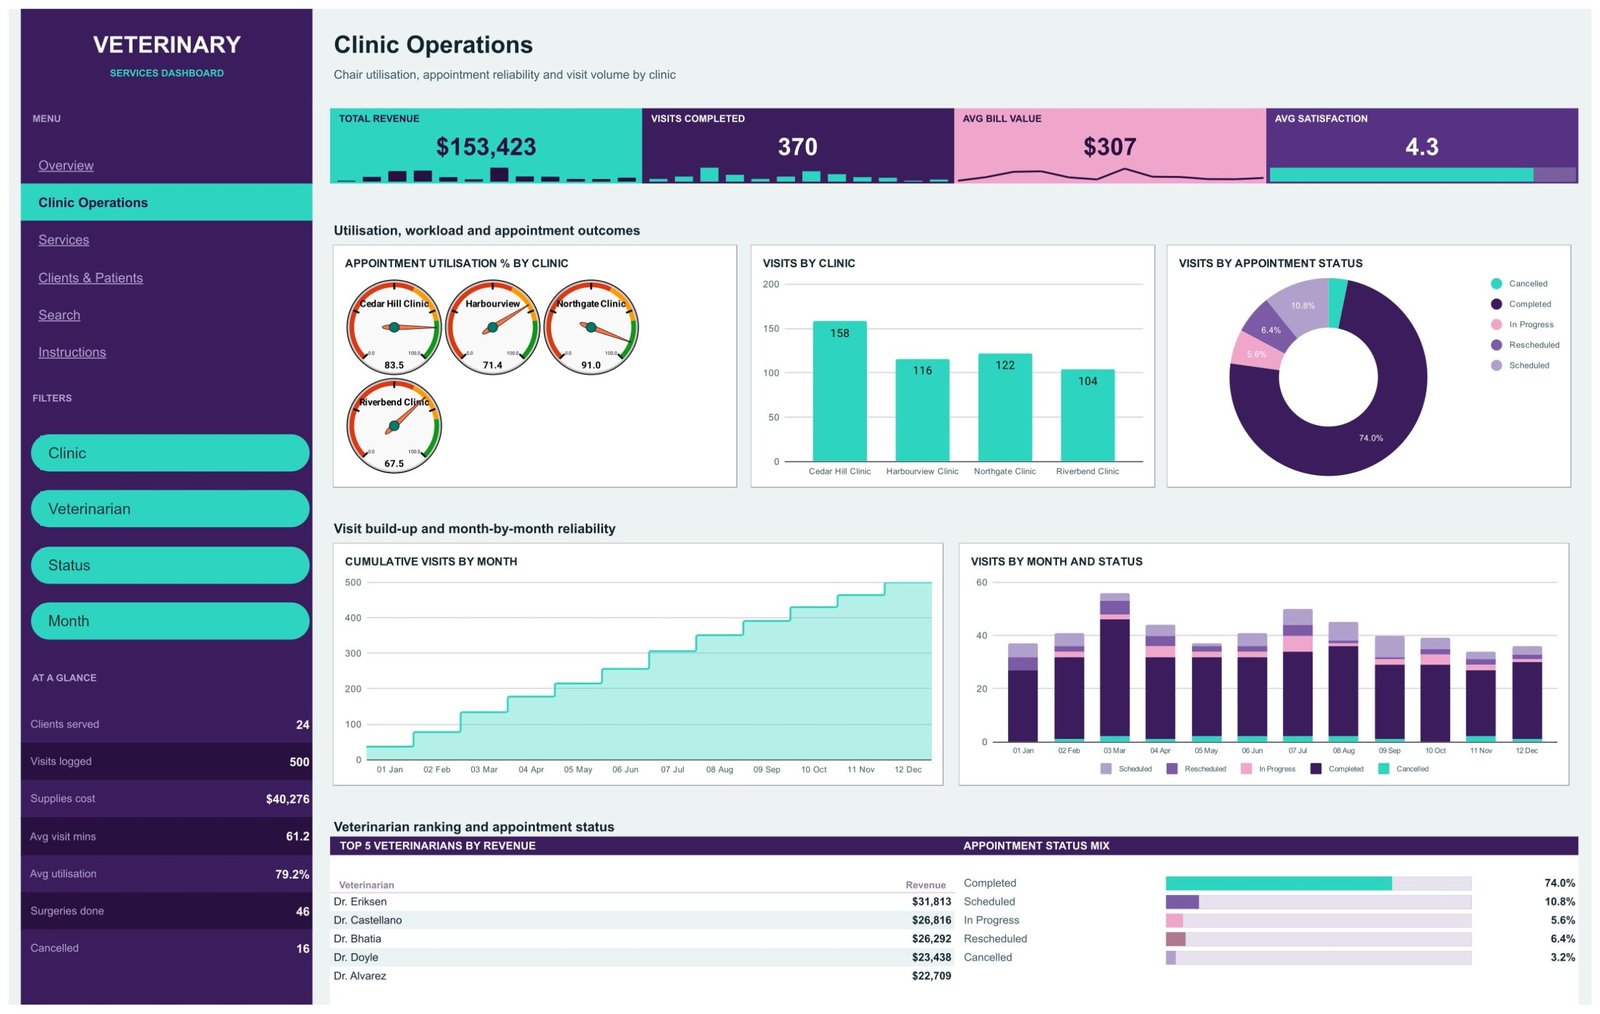
2. Clinic Operations – Appointment Utilisation % by Clinic on four gauges, Visits by Clinic, Visits by Appointment Status as a donut, Cumulative Visits by Month as a stepped area, Visits by Month and Status stacked, and a Top 5 Veterinarians by Revenue table.
3. Services – Revenue by Service Type, Visits by Client Segment, Average Bill by Service Type and Revenue by Service Type and Species, plus a Top 5 Services by Revenue table. In the sample data Surgery leads on revenue and Wellness Exam trails it, while Vaccination carries the smallest average bill.
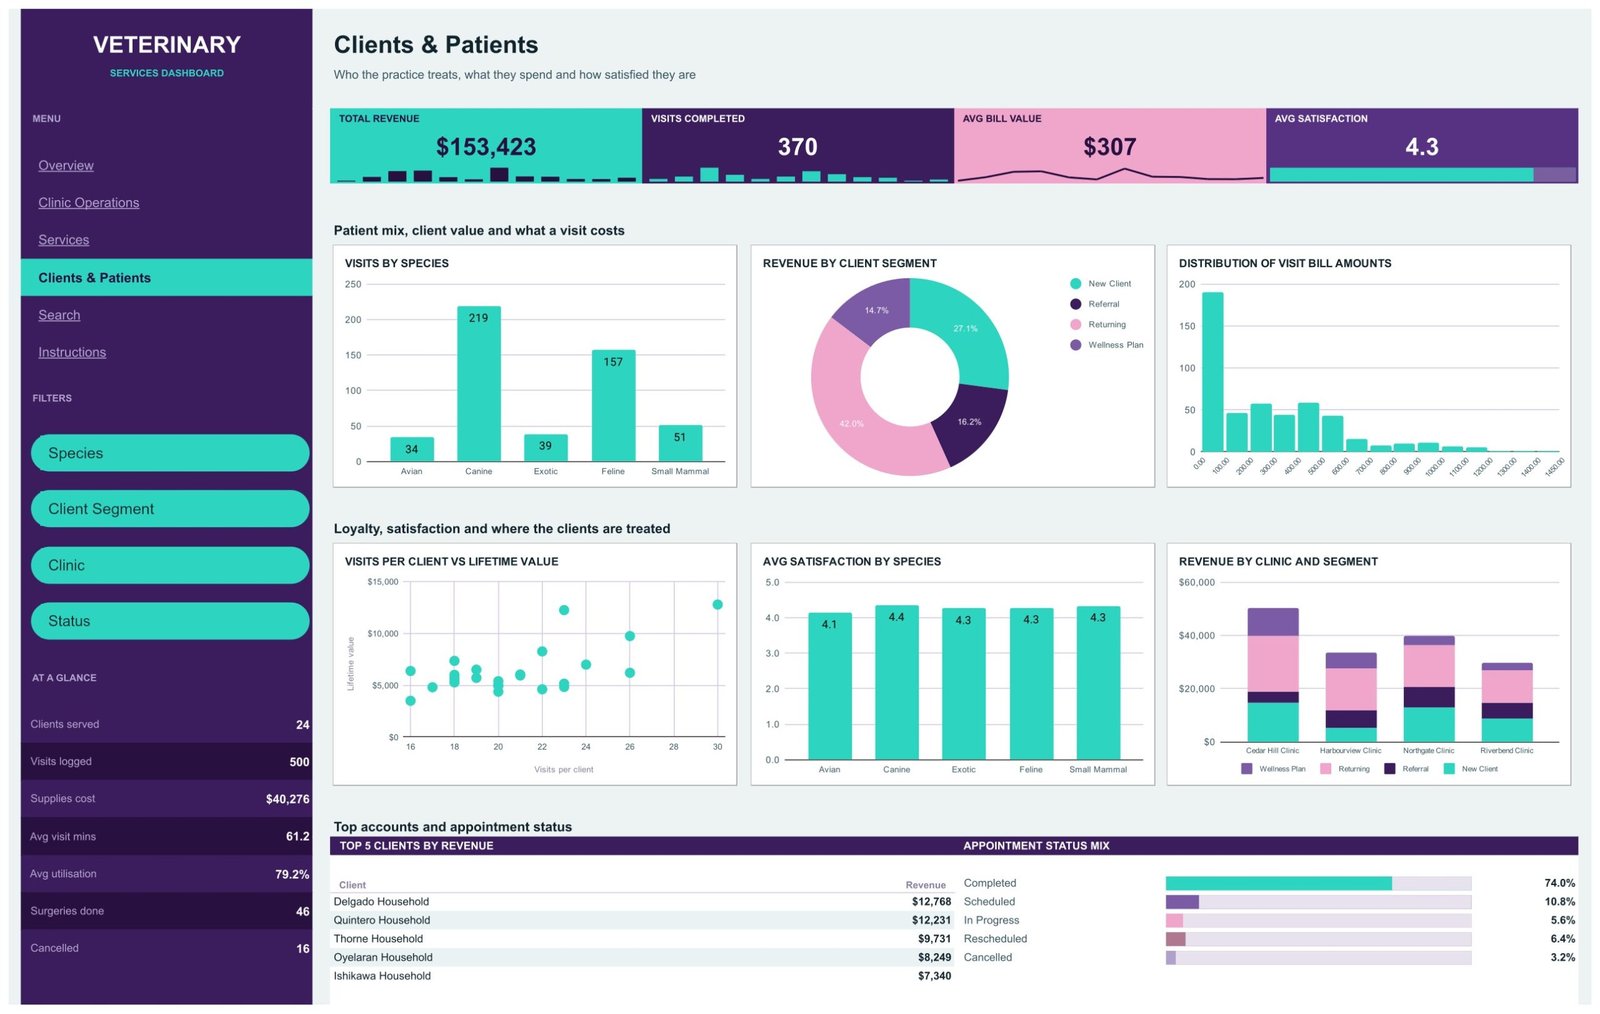
4. Clients & Patients – Visits by Species, Revenue by Client Segment, a Distribution of Visit Bill Amounts histogram, a Visits per Client vs Lifetime Value scatter, Avg Satisfaction by Species and Revenue by Clinic and Segment.
5. Search – type a Visit ID into the teal cell and the full record appears: clinic, service type, veterinarian, species, client, segment, status, minutes, days since last visit, utilisation, supplies cost, revenue, satisfaction, month and half.
6. Instructions – how to load your data, use the rail filters, move around the workbook and re-brand it.
7. Data – 500 sample appointments over a full calendar year across 18 columns: Visit ID, Date, Clinic, Service Type, Veterinarian, Species, Client, Client Segment, Status, Visit Minutes, Days Since Last Visit, Utilisation %, Supplies Cost, Revenue, Satisfaction, Month, Half and Count. The sample set spans four clinics, six service lines, six veterinarians, five species groups and 24 client households.
Google Sheets vs. an Excel Rebuild vs. a Paid BI Subscription – Where This Fits
| This template (Google Sheets) | Building it yourself in Excel | Paid BI suite subscription | |
|---|---|---|---|
| Cost | One-time purchase | Free software, your own hours | Per user, per month, forever |
| Platform | Google Sheets in any browser | Desktop Excel | Vendor cloud plus desktop authoring |
| Setup time | Copy the file, paste your rows | Days of pivot and chart work | Licensing, modelling and training |
| Real-time team collaboration | Yes, native Google Sheets sharing | Only via a shared drive | Yes, at seat cost |
| Mobile access | Yes, Sheets app or browser | Limited | Yes, vendor app |
| Customizable fields | Rename any column value, charts follow | You own every formula | Model changes usually need an admin |
| Share with a link | Yes, view or edit | No | Yes, inside the licensed tenant |
| Year-1 cost at 5 users | The purchase price, once | Your time | Recurring per-seat fees |
| Visit-level sample model included | Yes, 500 rows across 18 fields | You design it | You design it |
| Appointment booking or medical records | No – this is reporting only | No | No |
A veterinary practice information management system (PIMS) is a different category of product altogether – it books appointments, stores clinical records and raises invoices. This template does none of that. It reads what your practice already recorded and shows you the shape of it.
Who This Template Is For – and Who It’s Not For
A good fit for a practice owner or group manager running two to six sites who wants a monthly revenue, utilisation and service-mix pack; for a practice administrator who exports visit data and rebuilds the same charts by hand every month; and for an accountant or consultant reporting to a veterinary client.
Not a fit if you need appointment booking, clinical or medical records, prescription tracking, inventory control or invoicing – none of those exist here. It is also not a fit if your data cannot leave a closed system, because this is a Google Sheets file you paste records into. It makes no clinical, diagnostic, treatment-outcome or animal-welfare assurance claims, and it is not certified against any veterinary or healthcare standard.
How to Use the Veterinary Services Dashboard in Google Sheets
Step 1. Open the PDF in your download and click the Google Sheets link, then use File > Make a copy to put an editable version in your own Drive.
Step 2. Open the Data tab and replace the sample rows from row 2 down, keeping the 18 headers exactly as they are. Visit ID must never be blank – it is the key the pivots and the Search page rely on.
Step 3. Keep Month and Half as text labels (01 Jan, H1) so the month axis stays in calendar order.
Step 4. Refresh the pivots, then use the four slicers in the left rail of each analysis page. Slicers are page-scoped, so four people can hold four different views at once.
Step 5. Recolour the rail, the KPI tiles and the chart palette to your practice branding, and copy a page if you want a fifth view.
Real-World Use Cases
Priya runs four small-animal clinics. On the Clinic Operations page she sees one site at 67.5% appointment utilisation against another at 91.0% in the sample layout, and moves a rota rather than hiring.
Daniel is the practice administrator who used to spend a morning rebuilding the same monthly charts. He now pastes the visit export into the Data tab and sends the Overview page as a PDF before lunch.
Meera advises three veterinary practices as an outsourced finance manager. She keeps one copy per client, uses the Services page to compare service-line revenue against average bill, and uses the Search page to answer “what happened on that visit” questions on a call.
Frequently Asked Questions
Is this a veterinary practice management system?
No. It is a reporting template. There is no booking, no clinical record, no prescribing and no invoicing. It reads visit data you paste in and charts it.
Does it connect to my practice software automatically?
No. There is no live connection to any system. You export or type your visits into the Data tab, and the dashboard updates from that.
What personal data does it hold?
The data model includes a Client column (household-level names in the sample, such as “Delgado Household”) and a named Veterinarian column. There is no animal name, address, phone number, diagnosis or clinical note field. If you paste in real records, those two columns will carry real identifiers, so share the file the way you would share any spreadsheet containing client and staff names.
How many visits can it hold?
The pivots and the Search formulas already cover A1:R1001, which is 1,000 visits. Beyond that you extend the ranges yourself.
Can I add my own fields?
Yes. Add a column on the Data tab and point a new pivot at it, or add a row to the Search page with another INDEX / MATCH. Renaming existing values needs no formula edit at all.
Do I need Excel or Power BI?
No. Everything runs in Google Sheets in a browser. If you prefer another platform, the same topic exists as Veterinary Services Dashboard in Excel and Veterinary Services Dashboard in Power BI, which are separate products with their own layouts.
Is it a one-time payment?
Yes. One purchase, no subscription, and the copy in your Drive is yours to edit forever.
About the Author
Built by PK – Microsoft Certified Professional with 15+ years of Excel, Google Sheets, and Power BI experience. Founder of NextGenTemplates, reaching 300K+ subscribers across YouTube channels. Every template is hand-built and tested before release.
Explore Related Templates
Reporting on a single site instead of a group? Try the Veterinary Clinic Dashboard in Google Sheets. Running boarding, grooming and retail alongside clinical work? See the Pet Care Business Dashboard in Google Sheets. Reporting on a human practice? The Medical Practice Dashboard in Google Sheets covers that. Browse everything in Google Sheets Dashboards or the wider Google Sheets category.
Get the full page-by-page walkthrough on the blog: Veterinary Services Dashboard in Google Sheets.
Buy once, copy it into your Drive today, and have your first practice report out this week.
Watch the step-by-step video Demo:
Last updated: 1 September 2026.
Compatibility and Requirements
- Works in Google Sheets. You need a free Google account and a web browser.
- The dashboard uses native Google Sheets pivot tables, charts and slicers. Google explains how charts work in Add and edit a chart or graph.






























Reviews
There are no reviews yet.