The sporting goods industry never stands still. Sales spike during tournaments. Inventory fluctuates every season. Discounts impact margins instantly. If you are still depending on manual Excel reports, you are already behind.
Stop guessing. Start measuring.
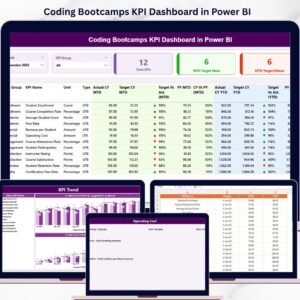
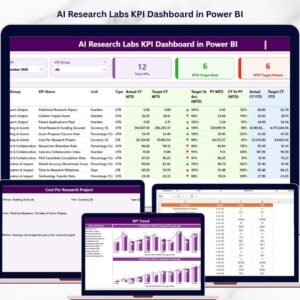
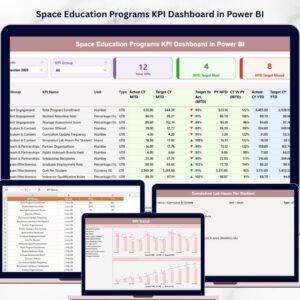
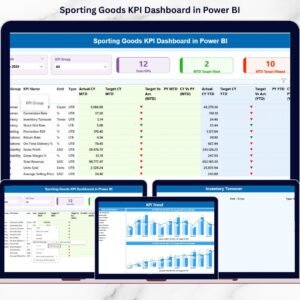
The Sporting Goods KPI Dashboard in Power BI is a ready-to-use, professionally designed business intelligence solution that helps you track sales, inventory, profitability, and operational KPIs in one powerful interactive report.
Monitor Month-to-Date (MTD) and Year-to-Date (YTD) performance. Compare Target vs Actual. Analyze Current Year vs Previous Year. Identify underperforming KPIs instantly.
All in just a few clicks.
🚀 Key Feature of Sporting Goods KPI Dashboard in Power BI
📊 Interactive Summary Page
Filter by Month and KPI Group. Instantly view performance for all KPIs in one structured table.
📈 MTD & YTD Analysis
Track both monthly and yearly performance side by side for better decision-making.
🎯 Target vs Actual Comparison
Automatically calculates achievement percentage and displays visual ▲ / ▼ indicators.
📅 Current Year vs Previous Year Comparison
Measure real growth using automated comparison logic.
📉 Smart KPI Icons (LTB & UTB Logic)
Green and red indicators adjust automatically based on KPI type (Lower the Better / Upper the Better).
📊 KPI Trend Page with Combo Charts
Analyze performance trends using dynamic combo charts (Target Line + Actual Columns).
📘 Drill-Through KPI Definition Page
Understand each KPI’s formula, definition, and measurement unit clearly.
📂 Excel-Based Data Source
No database required. Just update Excel sheets and refresh Power BI.

📦 What’s Inside the Sporting Goods KPI Dashboard in Power BI
This product includes a professionally built Power BI file with 3 structured pages:
1️⃣ Summary Page
Your central control panel.
Month Slicer
KPI Group Slicer
KPI Performance Cards
Detailed KPI Performance Table
MTD and YTD comparisons
Target vs Actual %
Current Year vs Previous Year %
2️⃣ KPI Trend Page
Visual performance analysis using:
MTD Combo Chart
YTD Combo Chart
KPI Selection Slicer
Track seasonal patterns, target gaps, and performance fluctuations clearly.
3️⃣ KPI Definition Page
Hidden drill-through page showing:
KPI Number
KPI Group
KPI Name
Unit
Formula
Definition
KPI Type (LTB/UTB)
Additionally, you get structured Excel templates:
Input_Actual Sheet
Input_Target Sheet
KPI Definition Sheet
Simply update values. Refresh Power BI. Everything calculates automatically.
🛠 How to Use the Sporting Goods KPI Dashboard in Power BI
Using this dashboard is simple:
1️⃣ Open the Excel data file.
2️⃣ Update Actual values in the Input_Actual sheet.
3️⃣ Update Target values in the Input_Target sheet.
4️⃣ Maintain KPI definitions in the KPI Definition sheet.
5️⃣ Refresh the Power BI file.
That’s it.
The dashboard automatically:
Calculates performance ratios
Displays KPI indicators
Updates charts and tables
Compares CY vs PY
Highlights target achievement
No advanced Power BI knowledge required.
🎯 Who Can Benefit from This Sporting Goods KPI Dashboard in Power BI
🏬 Sporting Goods Retailers
📦 Wholesale Distributors
🏭 Sports Equipment Manufacturers
🛒 Online Sports Stores
📊 Regional Sales Managers
💼 Business Owners
If you manage sporting products and want full visibility over performance, this dashboard is built for you.
This dashboard helps you track essential KPIs such as:
Net Sales
Gross Sales
Sales Growth %
Inventory Turnover
Dead Stock %
Gross Margin %
Operating Margin %
Return Rate %
Order Fulfillment Rate
Instead of preparing manual reports, you get instant clarity.
You reduce reporting time.
You improve decision speed.
You increase profitability control.
You identify weak KPIs faster.
Power BI’s interactive visuals, smart calculations, and drill-through functionality make this dashboard far more powerful than traditional spreadsheets.
If you want structured KPI tracking, clear target monitoring, and reliable performance comparison, this Sporting Goods KPI Dashboard in Power BI is your complete solution.
Click here to read the Detailed blog post
Watch the step-by-step video tutorial:
Visit our YouTube channel to learn step-by-step video tutorials:
\YouTube.com/@PKAnExcelExpert
Compatibility and Requirements
- Works in Power BI Desktop, which is free to download from Microsoft. Microsoft explains the install in Get Power BI Desktop.
- The data lives in an Excel file with the Input_Actual, Input_Target and KPI Definition sheets, so you need Excel to edit your figures.
- No database is required. You update the Excel sheets and refresh the Power BI file.
Frequently Asked Questions
What pages does the dashboard have?
Three pages: Summary, KPI Trend and KPI Definition. The KPI Definition page is a hidden drill-through page.
Where do I enter my numbers?
Enter actual values in the Input_Actual sheet and targets in the Input_Target sheet of the Excel data file. Keep the KPI names, units, formulas and definitions in the KPI Definition sheet, then refresh the Power BI file.
Does it show month-to-date and year-to-date results?
Yes. The Summary page shows MTD and YTD figures side by side, with Target vs Actual and Current Year vs Previous Year percentages. You pick the month and KPI group with slicers.
How do the green and red indicators work?
Each KPI is set as Lower the Better or Upper the Better. The icons change color and direction based on that type, so a falling return rate shows as good and a falling net sales figure shows as bad.
Is there an Excel version of this dashboard?
Yes. See the Sporting Goods KPI Dashboard in Excel.
Related Sporting Goods and KPI Dashboard Templates
- Sporting Goods KPI Dashboard in Excel: the same KPIs in an Excel workbook
- Sporting Goods Dashboard in Power BI: another Power BI dashboard for the same industry
- Luxury Goods KPI Dashboard in Power BI: a similar retail KPI dashboard in Power BI
- Power BI Dashboard Mega Collection: 15 Power BI templates in one download
Browse all Power BI KPI dashboards.