

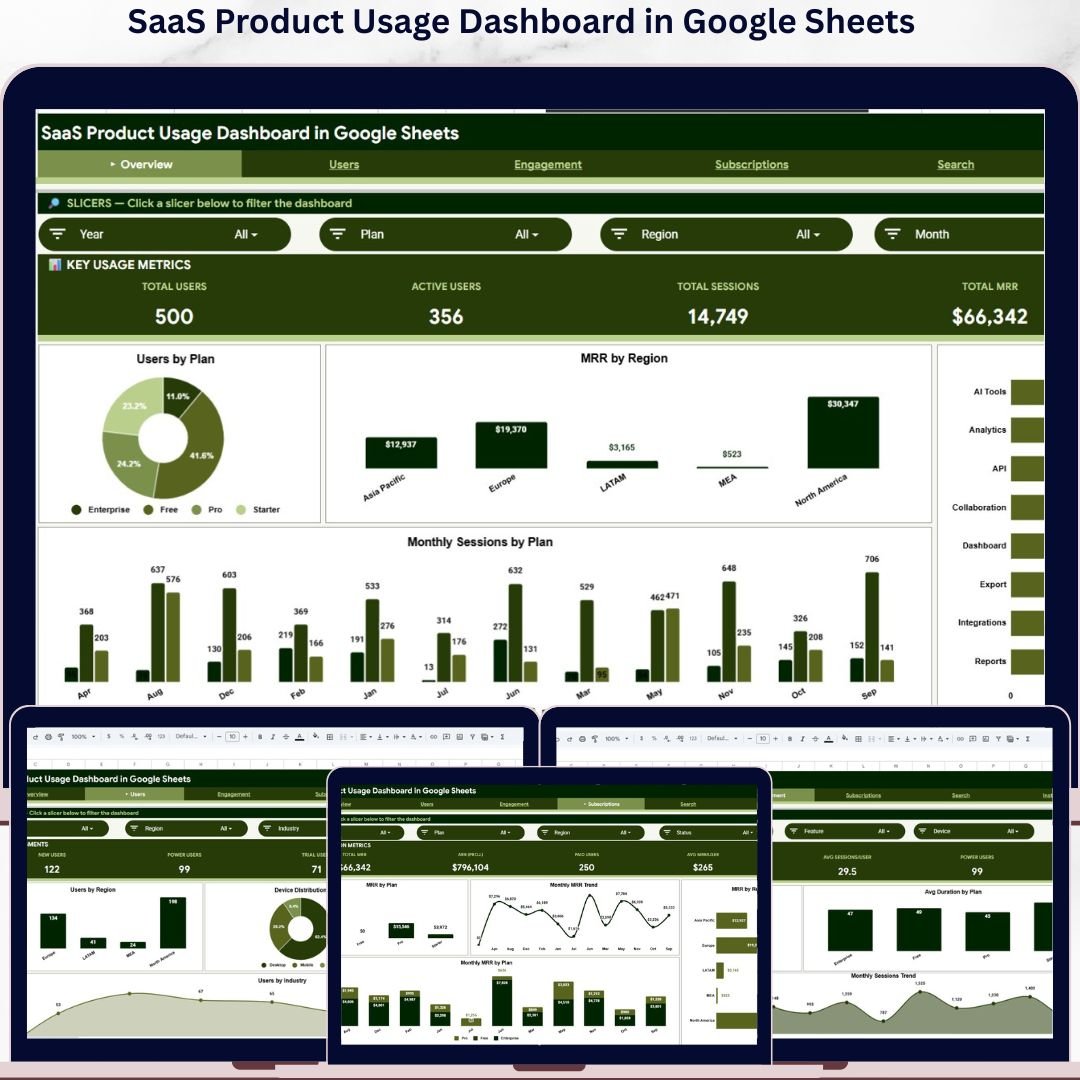

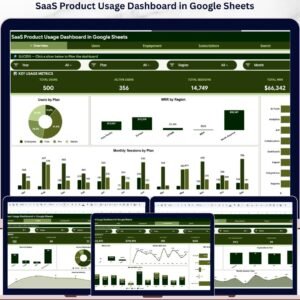
The SaaS Product Usage Dashboard in Google Sheets tracks 4 high-level KPIs across 6 interactive sheets, with 16 pre-built charts and slicer-driven filters covering Plans, Regions, Devices, Industries, and Segments. Setup takes under 10 minutes — just paste your user activity data into the Data sheet and every chart, MRR roll-up, and segment breakdown updates automatically.
🌍 Join 10,000+ customers in 180+ countries using NextGenTemplates to replace paid SaaS analytics tools with one-time-purchase Google Sheets Dashboards, Excel Dashboards, and Power BI Dashboards.
✅ Instant download · One-time payment · No subscription · No per-user fees · Lifetime access
🔑 Key Features of SaaS Product Usage Dashboard in Google Sheets
- 4 Live KPI Cards: Total Users, Active Users, Total Sessions, and Total MRR sit at the top of the Overview sheet and recalculate the moment you apply any slicer for Plan, Region, Industry, Device, or Segment.
- 16 Pre-Built Charts: The dashboard ships with 16 ready-to-use charts across Overview, Users, Engagement, and Subscriptions sheets — including Users by Plan, MRR by Region, Sessions by Feature, Feature Engagement, Avg Duration by Plan, and Monthly MRR Trend.
- Slicer-Driven Filtering: Native Google Sheets slicers sit at the top of each analysis page. One click filters every chart, KPI card, and supporting table on that sheet — no formula edits, no helper columns.
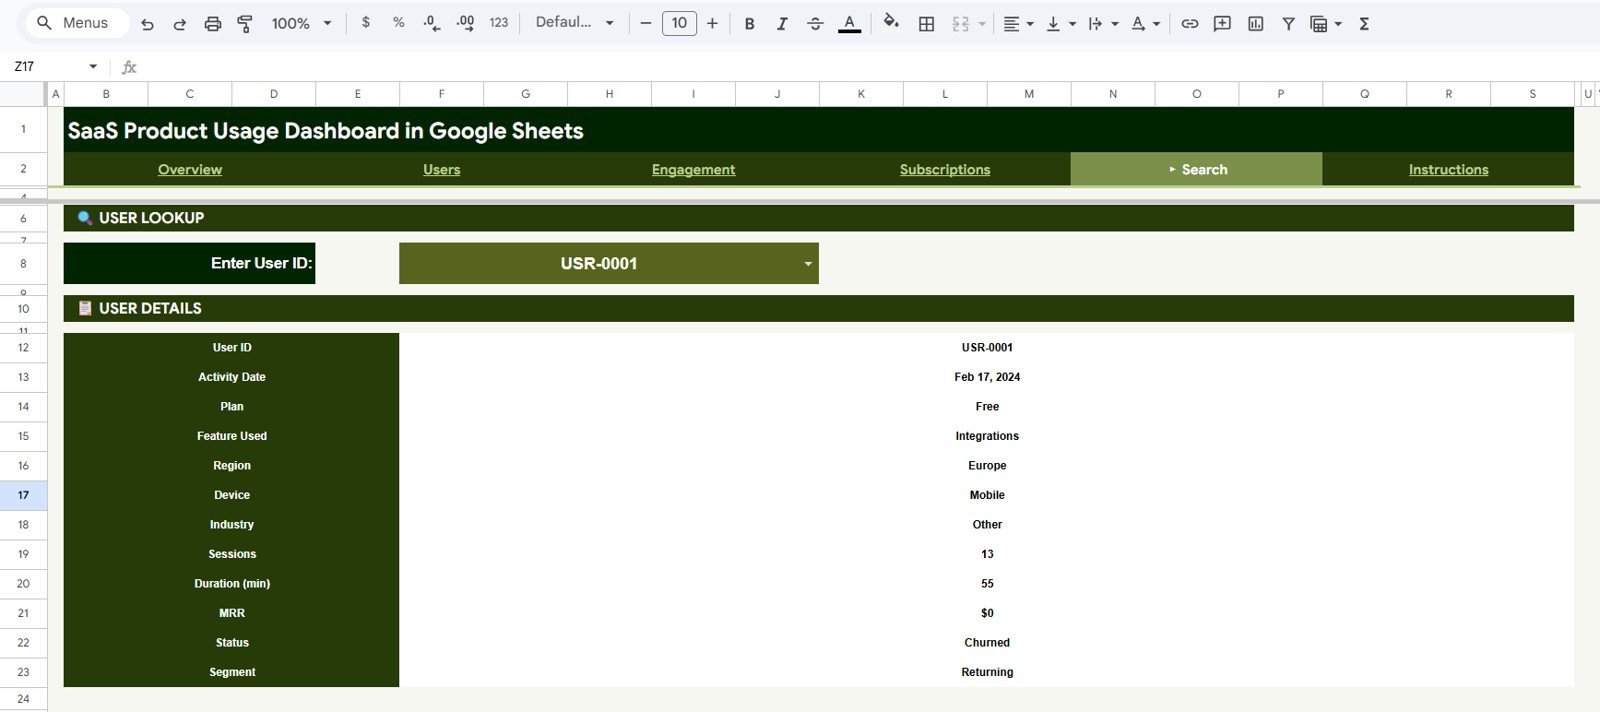
- Built-In Search Sheet: Pick any User ID from the dropdown and the Search sheet instantly returns that user’s full profile — Activity Date, Plan, Feature Used, Region, Device, Industry, Sessions, Duration, MRR, Status, and Segment.
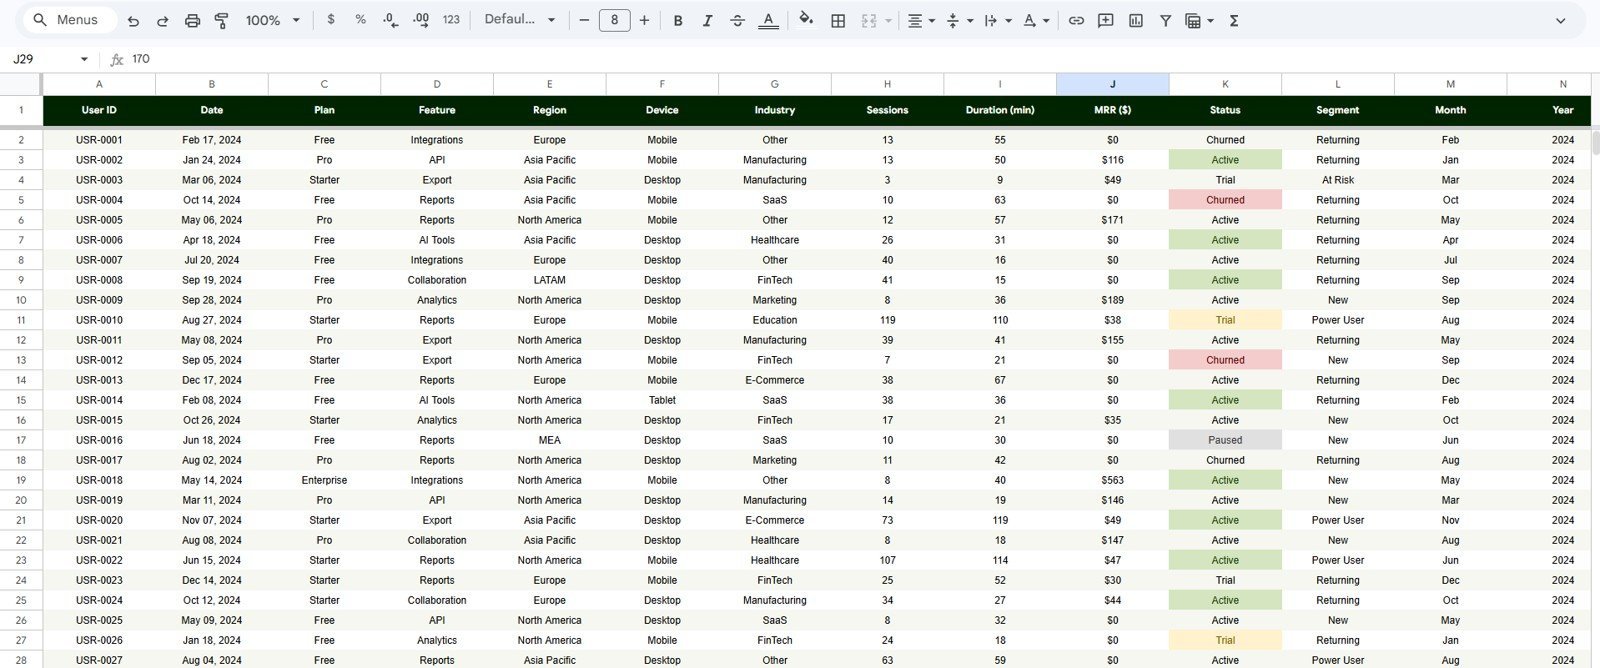
- Editable Data Sheet: The Data tab is the input layer where you paste your own user activity export. The fixed 12-column layout means every dashboard sheet auto-updates the moment new rows land.
- Pure Google Sheets: No Apps Script triggers to authorize, no paid add-ons, and no Workspace-only features. The template runs on any free Google account in any modern browser.
📦 What’s Inside the SaaS Product Usage Dashboard in Google Sheets
Page 1: Overview
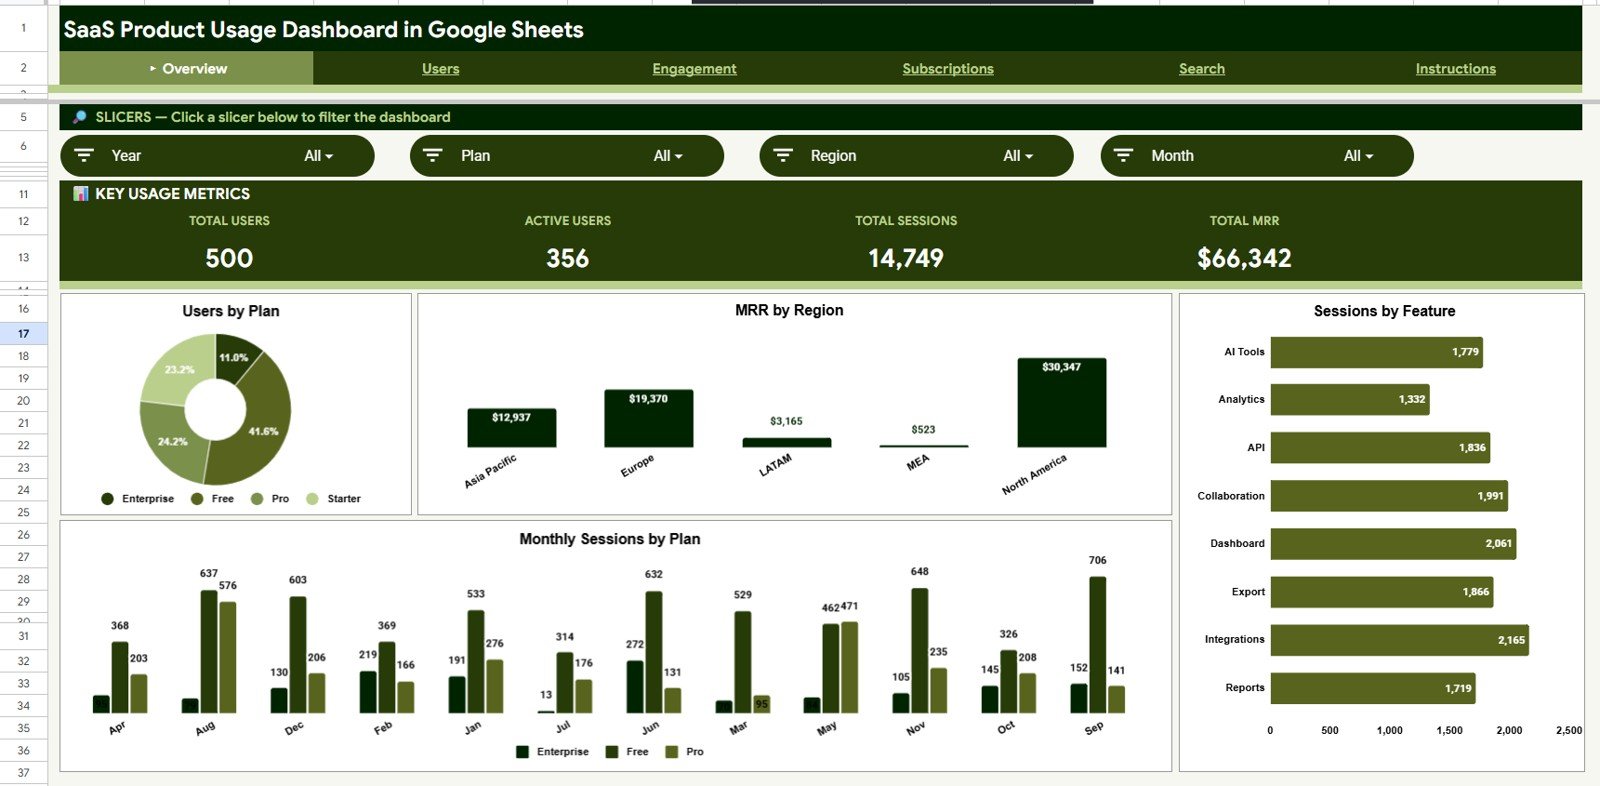
The Overview sheet anchors the dashboard with four KPI cards — Total Users, Active Users, Total Sessions, and Total MRR — and four charts: Users by Plan, MRR by Region, Sessions by Feature, and Monthly Sessions by Plan. Slicers at the top filter every card and chart on this page in one click, so any stakeholder can answer a Plan-, Region-, or Industry-specific question in seconds.
Page 2: Users
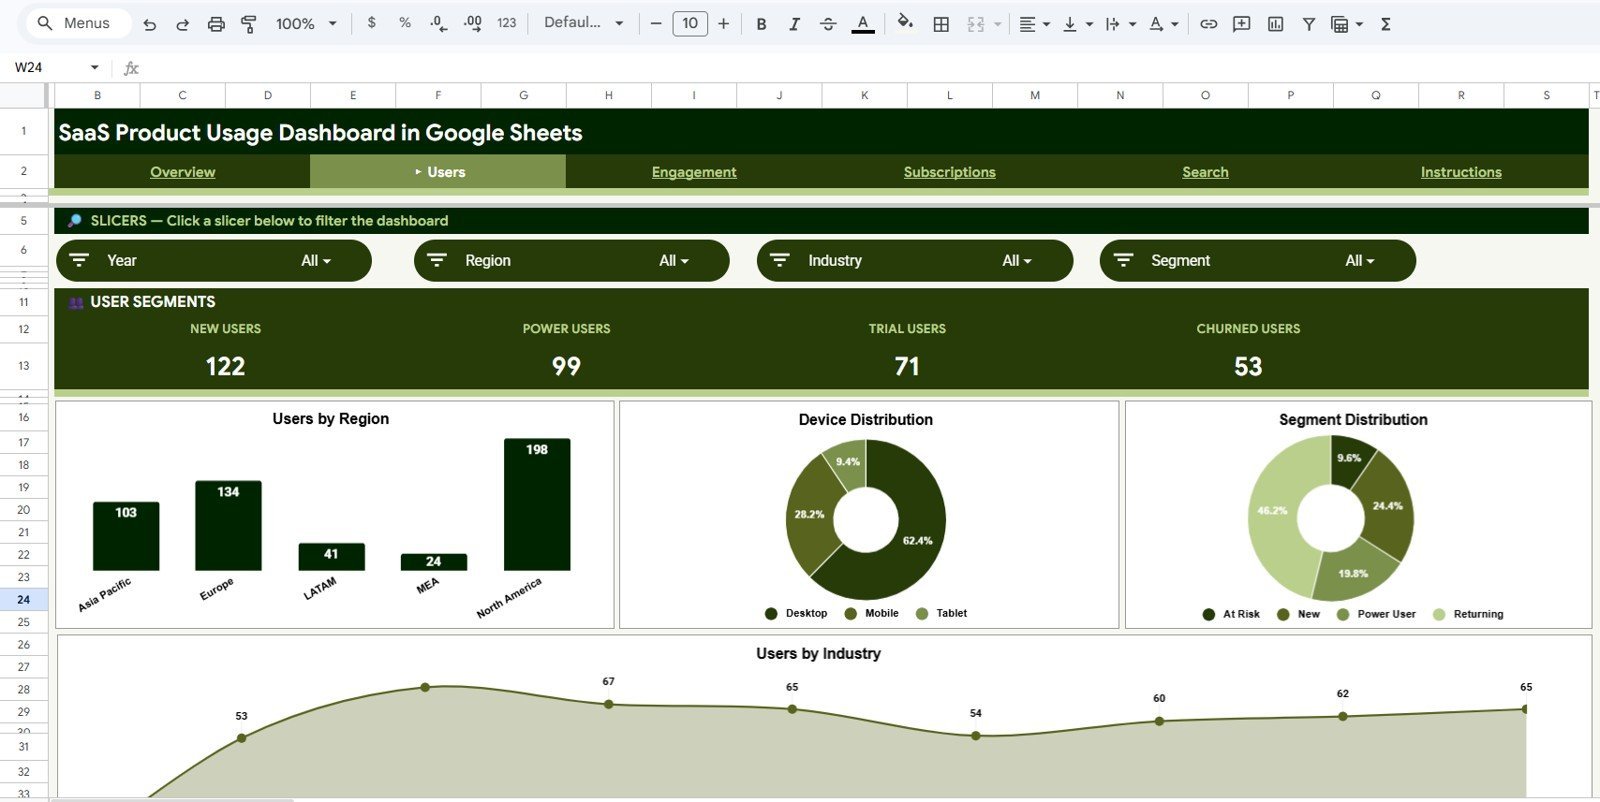
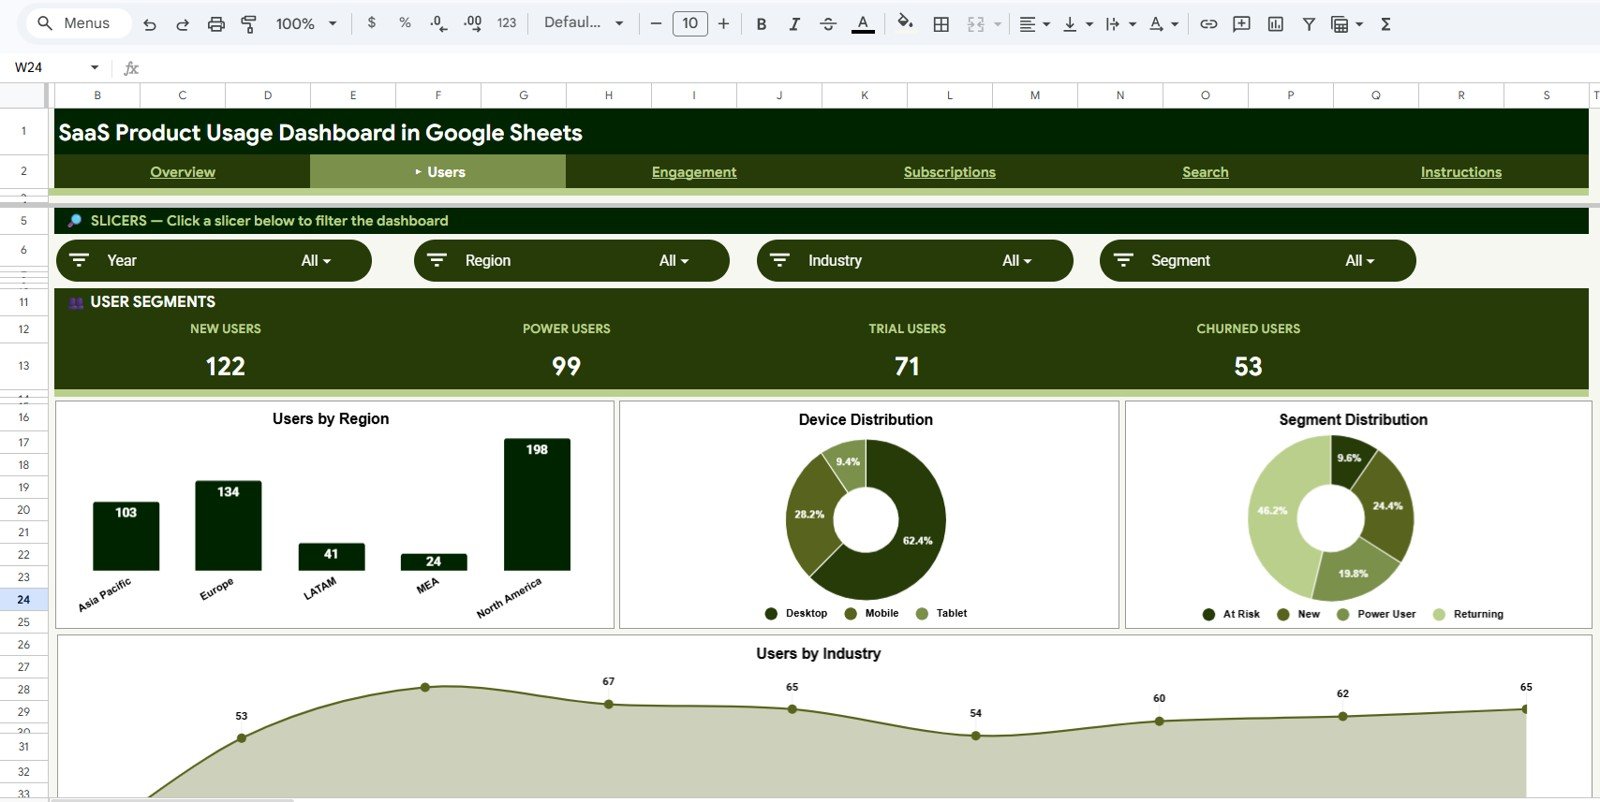
The Users sheet breaks down your customer base across four dimensions: Users by Region, Device Distribution, Segment Distribution, and Users by Industry. Open this page when you need to answer “who is using our product” by geography, device type, customer segment, or industry vertical.
Page 3: Engagement
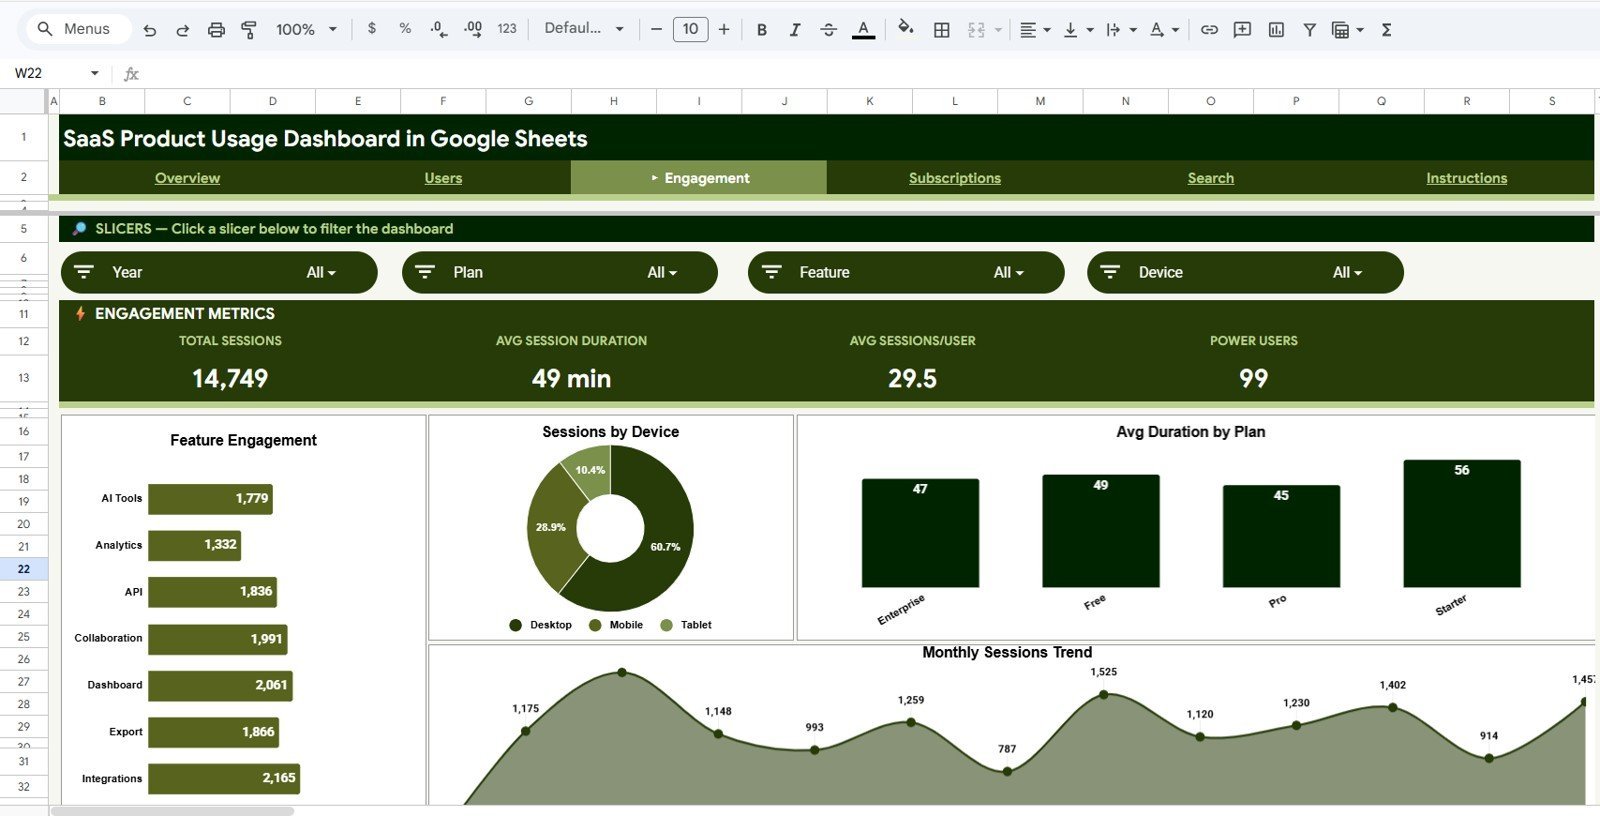
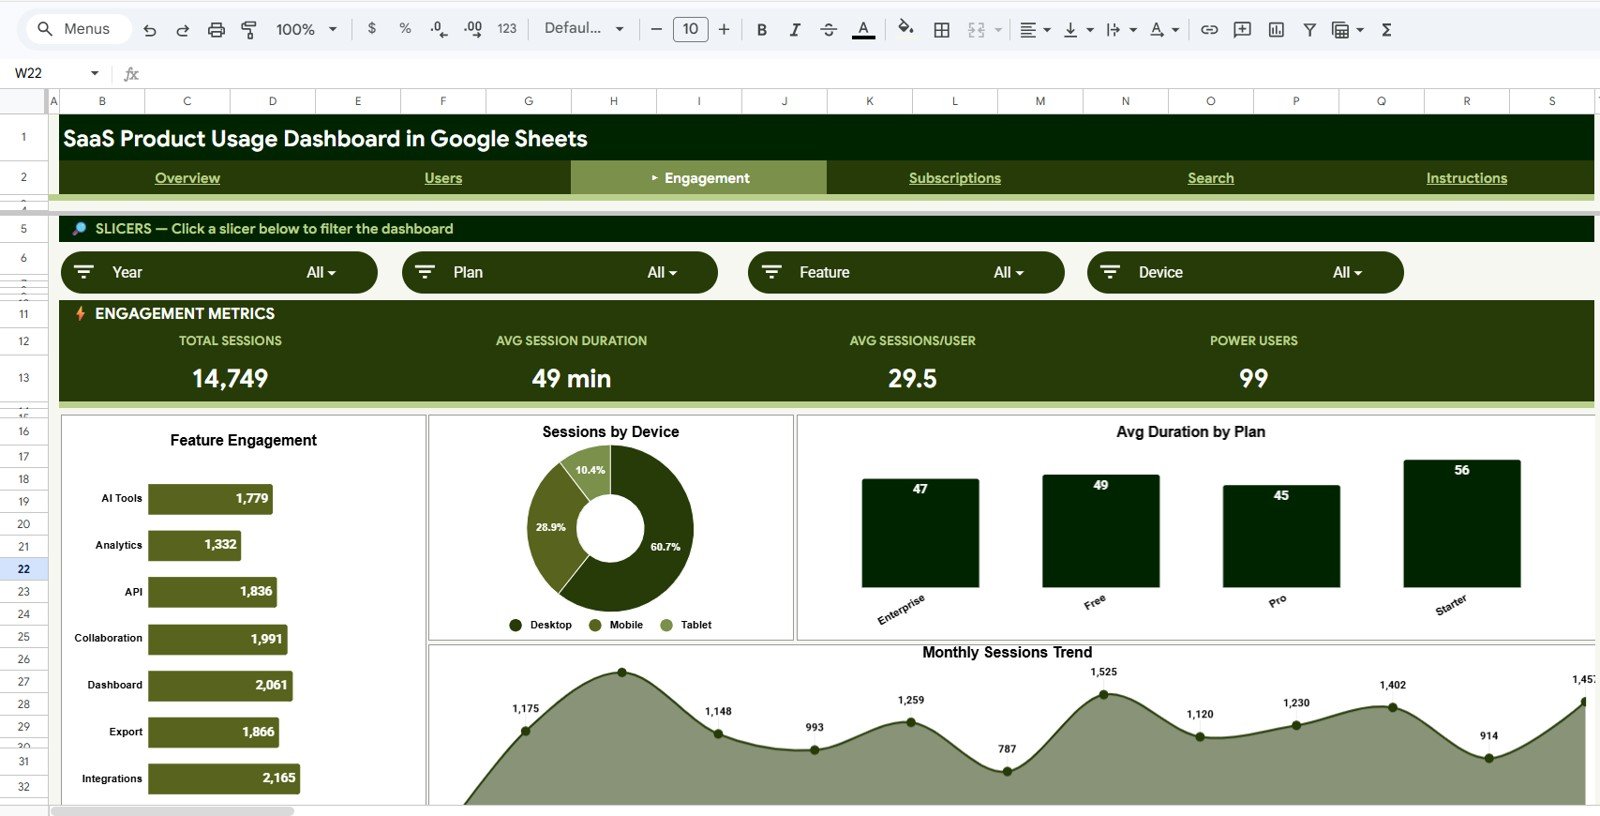
The Engagement sheet quantifies how users actually interact with your product through Feature Engagement, Sessions by Device, Avg Duration by Plan, and Monthly Sessions Trend. Use these charts to identify which features drive depth of use and which plan tiers deliver the longest sessions — critical signals for upgrade campaigns and feature investment.
Page 4: Subscriptions
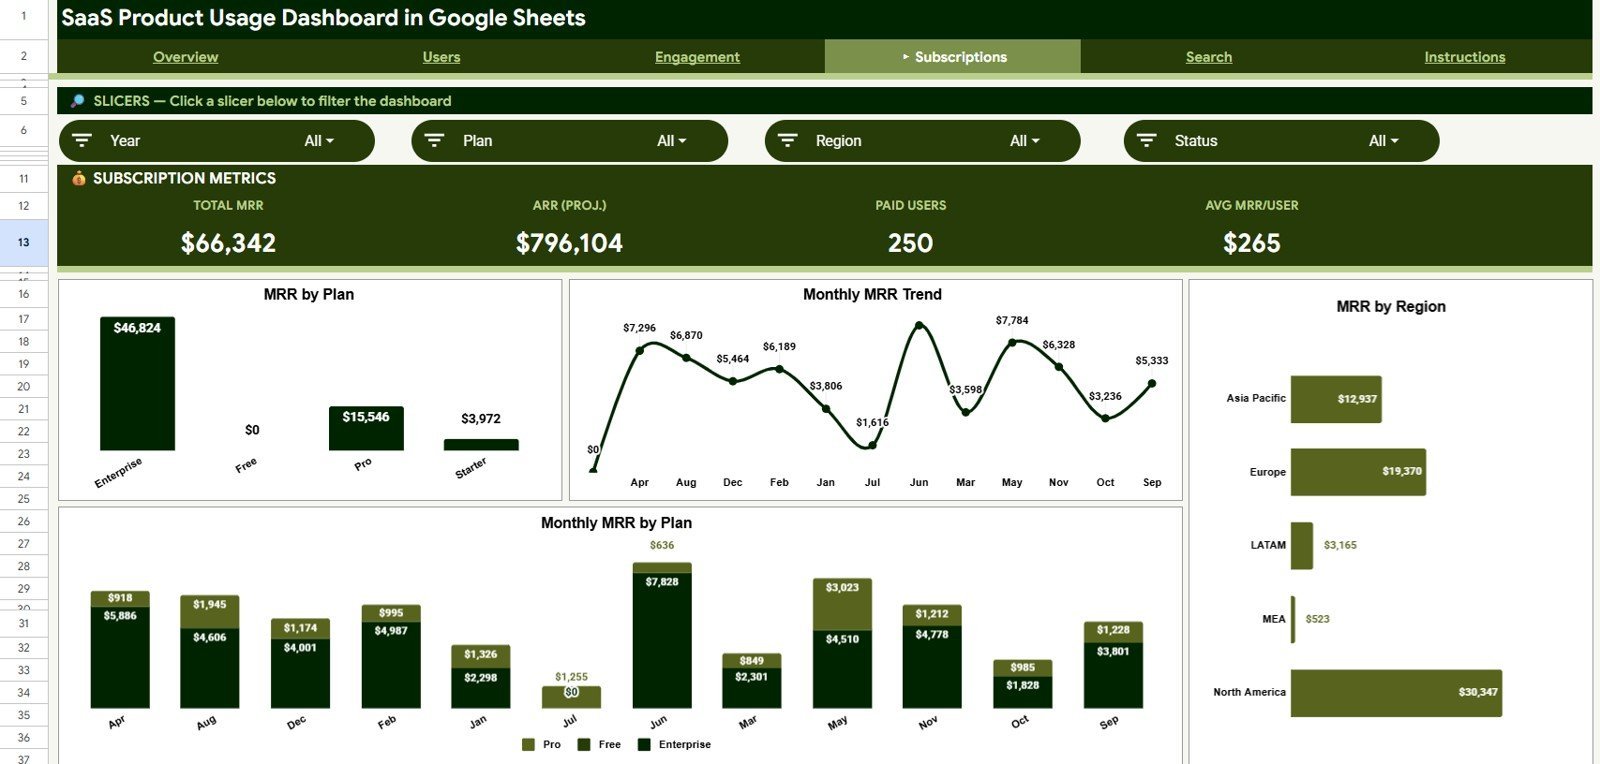
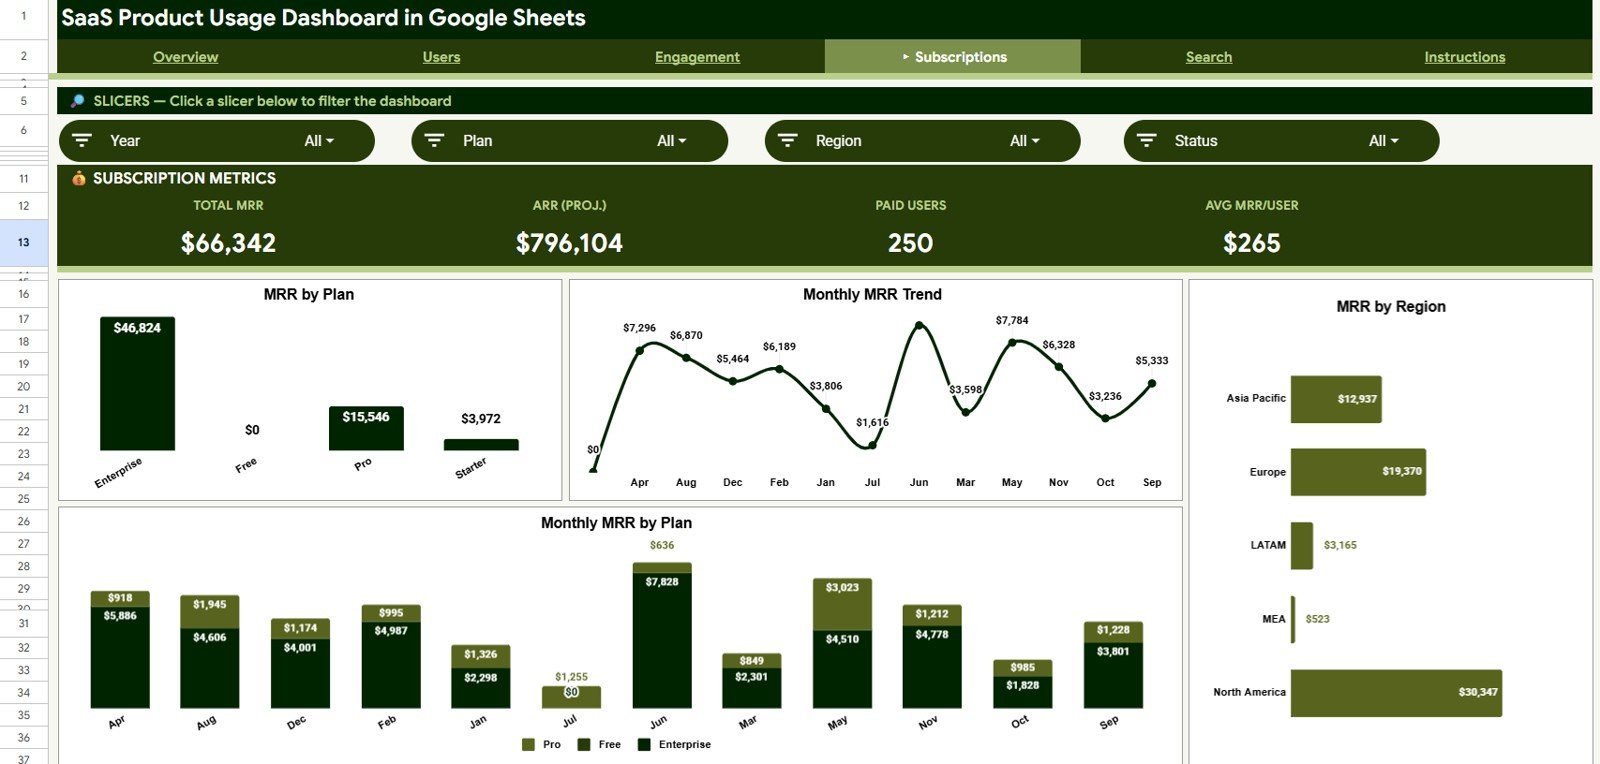
The Subscriptions sheet centers on monthly recurring revenue with MRR by Plan, Monthly MRR Trend, MRR by Region, and Monthly MRR by Plan. This is the page leadership wants in board decks — total MRR, plan mix, geographic revenue concentration, and month-over-month direction in one view.
Page 5: Search Sheet
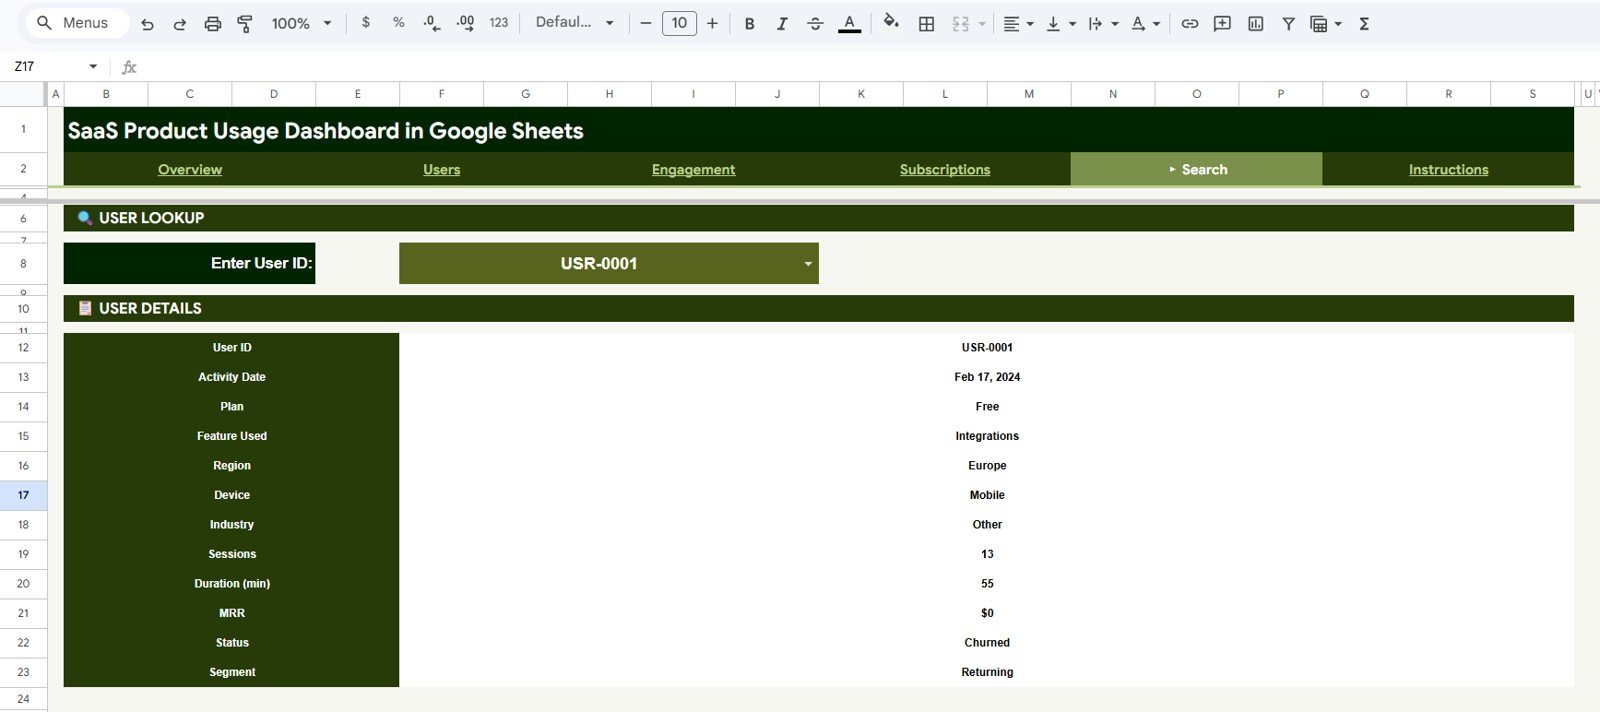
The Search sheet is built for one-user investigations. Pick any User ID from the dropdown and the page instantly displays User ID, Activity Date, Plan, Feature Used, Region, Device, Industry, Sessions, Duration, MRR, Status, and Segment. It turns “what’s going on with this customer” into a 5-second answer.
Page 6: Data Sheet
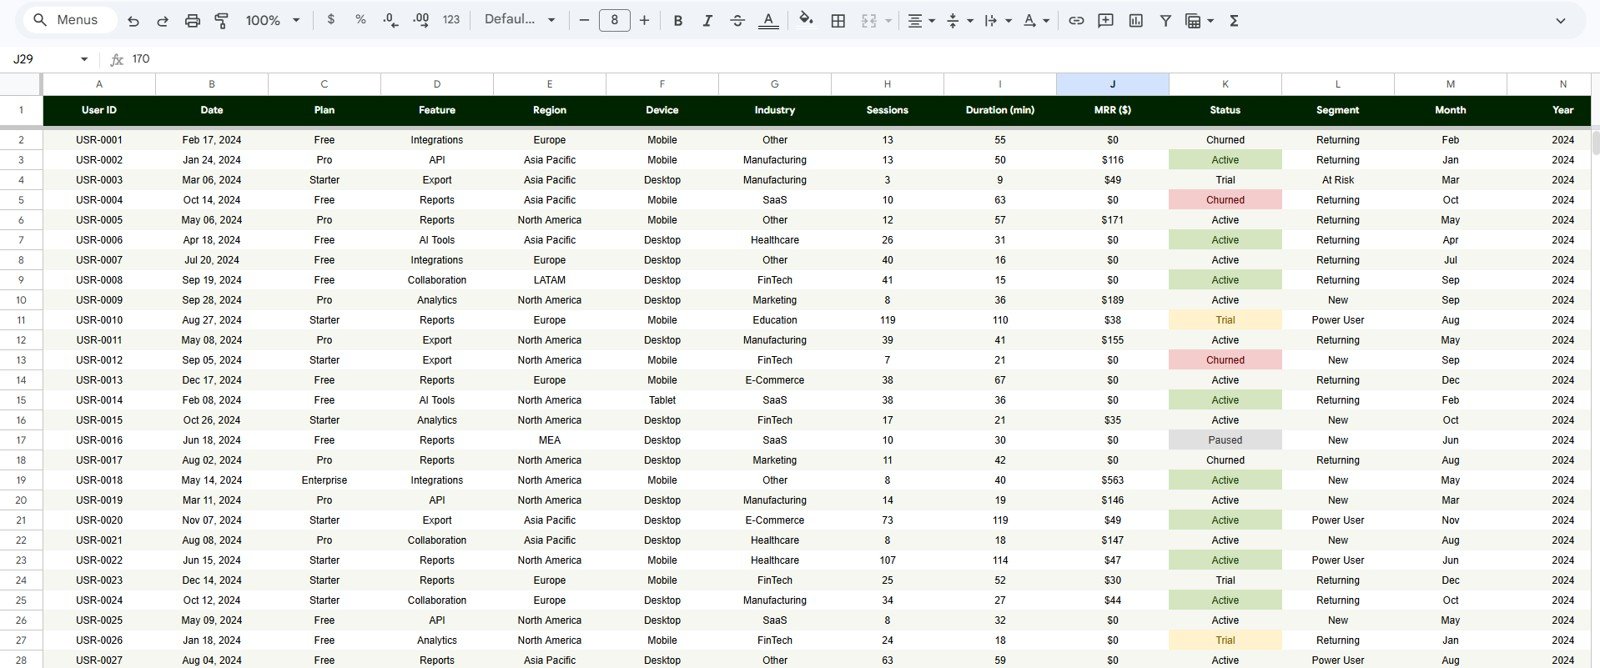
The Data sheet is the input layer — paste your own user activity records here in the same column order and the entire dashboard re-renders. Columns include User ID, Activity Date, Plan, Feature Used, Region, Device, Industry, Sessions, Duration, MRR, Status, and Segment.
📊 SaaS Product Usage Dashboard vs. Excel Dashboard vs. Mixpanel/Amplitude — Where This Fits
| Feature | SaaS Product Usage Dashboard (Google Sheets) | Microsoft Excel Dashboard | Mixpanel / Amplitude / Pendo |
|---|---|---|---|
| Cost | $9.99 one-time | $17.99 one-time | $0–$2,000+ / month (per-seat or per-MTU) |
| Platform | Google Sheets (browser, free) | Microsoft Excel (desktop) | SaaS web app |
| Setup time | Under 10 minutes | Under 10 minutes | Days to weeks (SDK install, event mapping) |
| Real-time team collaboration | ✅ | ❌ (file-based) | ✅ |
| Mobile / tablet access | ✅ (browser + Sheets app) | Limited | ✅ |
| Customizable fields and charts | ✅ | ✅ | Limited (vendor-controlled schema) |
| Share with link | ✅ | ❌ | ✅ (seats required) |
| User-level profile lookup | ✅ (built-in Search sheet) | ❌ (separate template needed) | ✅ |
| Year-1 cost at 5 users | $9.99 | $17.99 | $3,000–$12,000+ |
For SaaS founders and growth teams who want MRR, user, and feature-engagement visibility without paying $250+ per month for Mixpanel or Amplitude seats, the SaaS Product Usage Dashboard in Google Sheets sits in the sweet spot.
👥 Who This Template Is For — and Who It’s Not For
✅ This template is built for:
- Early-stage SaaS founders tracking their first 50–5,000 paying users without committing to a $250/month analytics platform
- Product managers who need a weekly MRR + engagement snapshot for standup or board updates
- Customer success and growth teams running monthly user-cohort reviews by Plan, Region, and Industry
- Solo operators and bootstrapped founders already exporting user activity from Stripe, their app database, or a BI tool
❌ This template is NOT for:
- Enterprise SaaS teams needing SOC 2-compliant data warehousing and SDK-based event capture
- Real-time clickstream analytics — Google Sheets refreshes when you paste, not as users click
- Teams tracking 100,000+ active users per month — Sheets row limits will eventually force a move to BigQuery
⚙️ How to Use the SaaS Product Usage Dashboard in Google Sheets
- Open your purchase email and click the PDF guide — it contains your Google Sheets template copy link.
- Click “Make a copy” when the link opens; the template lands in your own Google Drive, fully editable.
- Open the Data sheet and replace the sample rows with your own user activity export. Keep the same 12-column order: User ID, Activity Date, Plan, Feature Used, Region, Device, Industry, Sessions, Duration, MRR, Status, Segment.
- Switch to the Overview sheet — every KPI card, chart, and slicer recalculates the moment your data lands.
- Use the slicers on Overview, Users, Engagement, and Subscriptions to filter by Plan, Region, Industry, Device, or Segment.
- Use the Search sheet to look up any single user’s profile when a customer success rep needs context fast.
- Share with your team via the standard Google Sheets share link — view-only for leadership, edit access for the data owner.
💼 Real-World Use Cases
Priya runs growth at a 12-person B2B SaaS in Bengaluru. She uses the SaaS Product Usage Dashboard every Monday morning to pull Total MRR, Active Users, and Sessions by Feature for the founders’ standup — without paying $1,500/year for Mixpanel’s Growth tier.
Marcus is a solo indie hacker shipping a productivity tool. He exports a CSV from Stripe and his app database once a week, pastes it into the Data sheet, and uses the Search sheet to investigate the three power users who churned this week — all from his laptop on cafe Wi-Fi.
Lina leads customer success at a mid-stage SaaS with 1,800 paying accounts. Her team uses the Subscriptions sheet’s MRR by Region + Monthly MRR Trend charts to flag which geographies are decelerating, then drills into the Users sheet to see industry-mix shifts before they land in the QBR deck.
❓ Frequently Asked Questions
What KPIs does the SaaS Product Usage Dashboard track?
The SaaS Product Usage Dashboard in Google Sheets tracks 4 headline KPIs (Total Users, Active Users, Total Sessions, Total MRR) plus 16 chart-level metrics covering Users by Plan, MRR by Region, Sessions by Feature, Feature Engagement, Avg Duration by Plan, Monthly MRR Trend, and Users by Industry — all in one Google Sheets file.
How does this compare to Mixpanel or Amplitude?
Mixpanel and Amplitude are real-time SDK-based platforms that cost $250–$2,000+ per month. The SaaS Product Usage Dashboard in Google Sheets is a $9.99 one-time spreadsheet you paste your own export into. You trade real-time event capture for a 10-minute setup, zero recurring cost, and full data ownership.
How long does setup take?
Setup takes under 10 minutes. Click the copy link in the PDF guide, copy the SaaS Product Usage Dashboard to your Drive, paste your user activity rows into the Data sheet using the 12-column layout, and the entire dashboard re-renders automatically. No formulas to edit, no scripts to authorize.
Do I need a paid Google Workspace plan?
No. The SaaS Product Usage Dashboard in Google Sheets works on any free Google account. There are no Apps Script triggers, no add-ons, and no Workspace-only features required. Personal Gmail accounts run the entire template without limitations.
Can I customize the columns or charts?
Yes. Every chart in the SaaS Product Usage Dashboard is built directly from the Data sheet, so you can add columns, rename plan tiers, or change the slicer fields. Keep the original column order intact and existing charts continue to update — added columns can drive new pivots you build.
What data do I need to bring?
You need a per-user-per-activity export with these 12 fields: User ID, Activity Date, Plan, Feature Used, Region, Device, Industry, Sessions, Duration, MRR, Status, and Segment. Most teams generate this from a Stripe + product DB join or a Metabase/Mode export.
Is it a one-time purchase or subscription?
It’s a one-time purchase. Pay $9.99 once, get lifetime access, and copy the SaaS Product Usage Dashboard to your Drive as many times as you need. No monthly fees, no per-seat costs, no expiry.
👤 About the Author
Built by PK — Microsoft Certified Professional with 15+ years of Excel, Google Sheets, and Power BI experience. Founder of NextGenTemplates, reaching 300K+ subscribers across YouTube channels (@PK-AnExcelExpert, @NextGenTemplates, @NeoTechNavigators). Every template is hand-built and tested before release.
🔗 Explore Related Templates
Also available as:
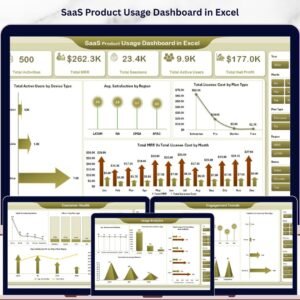
- SaaS Product Usage Dashboard in Excel — same KPIs and analysis, packaged for Microsoft Excel users.
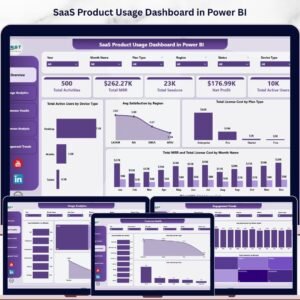
- SaaS Product Usage Dashboard in Power BI — Power BI version with DAX measures and interactive slicers.
Other SaaS templates in Google Sheets you may like:
- SaaS Customer Success Dashboard in Google Sheets — health scores, NPS, and renewal risk on a single sheet.
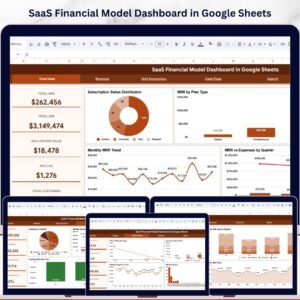
- SaaS Financial Model Dashboard in Google Sheets — MRR, ARR, burn, and runway in one model.
- Startup Growth KPI Scorecard in Google Sheets — weekly growth scorecard for early-stage teams.
📖 Click here to read the Detailed Blog Post
Watch the step-by-step video tutorial:
🎥 Visit our YouTube channel for step-by-step video tutorials
👉 YouTube.com/@NextGenTemplates
Compatibility and Requirements
- Works in Google Sheets. You need a free Google account and a web browser.
- Slicers on the Overview, Users, Engagement and Subscriptions sheets filter the charts, and the Search sheet uses a User ID dropdown. Google explains dropdowns in Create an in-cell dropdown list.












Reviews
There are no reviews yet.