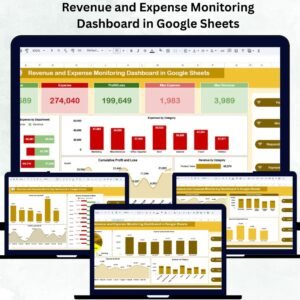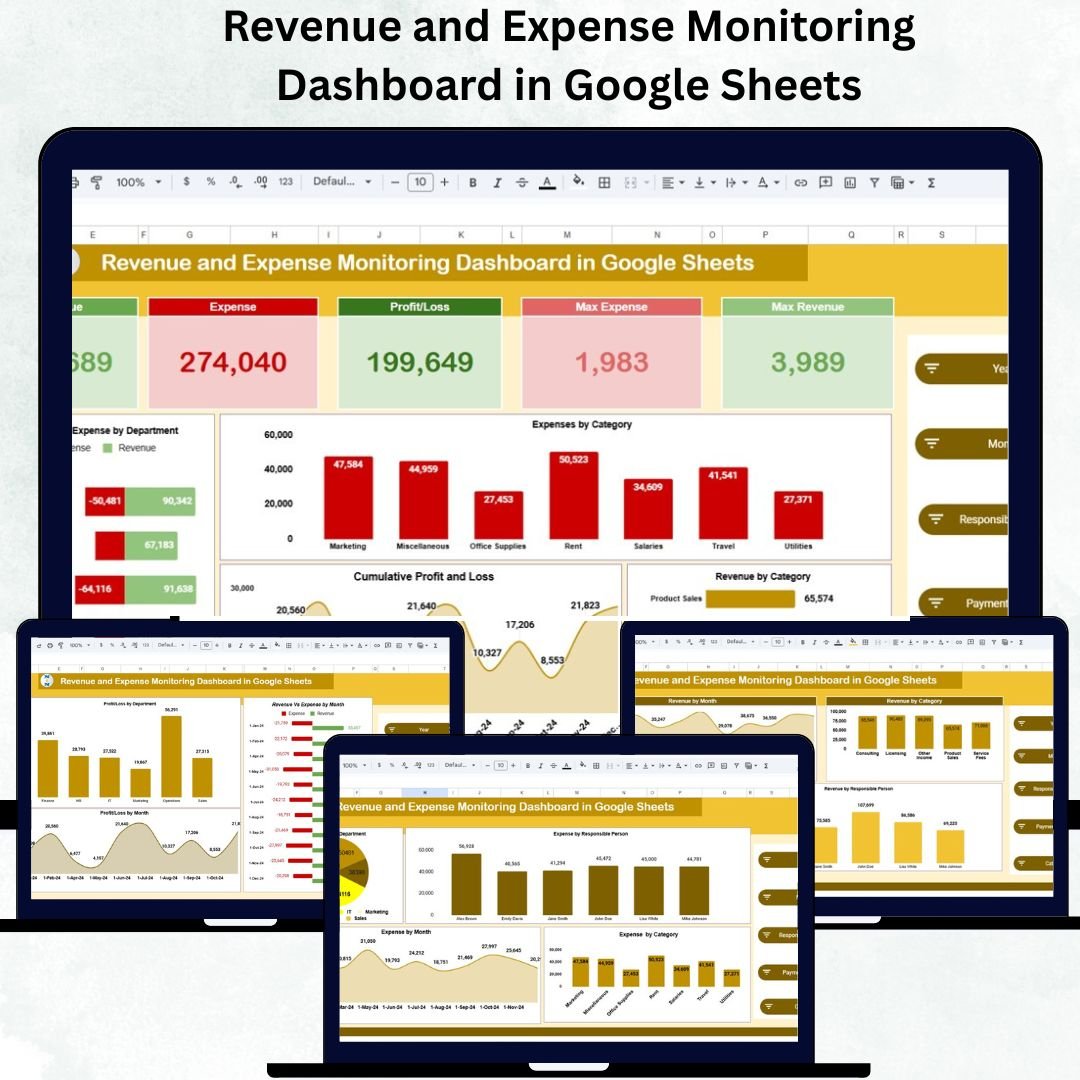
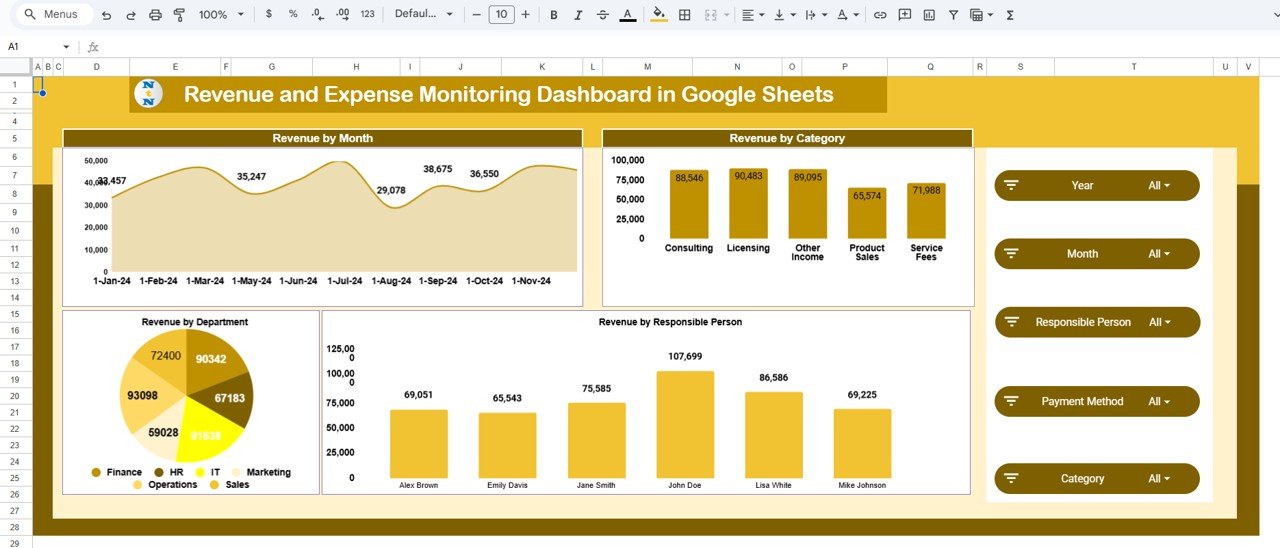
Tracking financial performance accurately is essential for every business. Whether you’re managing a startup, a department, or a consultancy, keeping an eye on your revenues, expenses, and profits ensures informed decision-making and financial control. The Revenue and Expense Monitoring Dashboard in Google Sheets simplifies this process — offering a real-time, automated, and visually appealing way to monitor your organization’s financial health.
Built entirely in Google Sheets, this dashboard helps users visualize financial data through interactive charts, KPIs, and performance analysis, providing a complete view of revenue and expense dynamics — all without the need for any additional software.

💼 What Is a Revenue and Expense Monitoring Dashboard in Google Sheets?
The Revenue and Expense Monitoring Dashboard is a pre-built, data-driven financial management tool that allows you to track income, spending, and profit trends in real time.
It empowers users to:
✅ Visualize how revenue and expenses evolve month by month
✅ Analyze profits across departments or product categories
✅ Identify high-cost areas and profitability trends
✅ Make quick, data-backed financial decisions
This template is perfect for small business owners, finance teams, department managers, and consultants who want a professional, cloud-based solution that’s easy to update and share.
📊 Key Features of the Revenue and Expense Dashboard
🏠 1. Overview Sheet Tab
The Overview tab provides an instant financial snapshot with five major KPI cards:
Revenue 💵 – Displays total earnings for the selected period.
Expense 💸 – Shows total costs across departments and categories.
Profit/Loss 📈 – Calculates net profit after expenses.
Max Revenue 💰 – Identifies the department or month with the highest revenue.
Max Expense 🧾 – Highlights the highest single expense record.
Charts Include:
Revenue vs Expense by Department – Compare performance across business units.
Expenses by Category – View detailed spending breakdowns.
Revenue by Category – Analyze which areas drive the most revenue.
Cumulative Profit & Loss – Track profitability over time.
Profit/Loss Trend – Identify positive or negative trends easily.
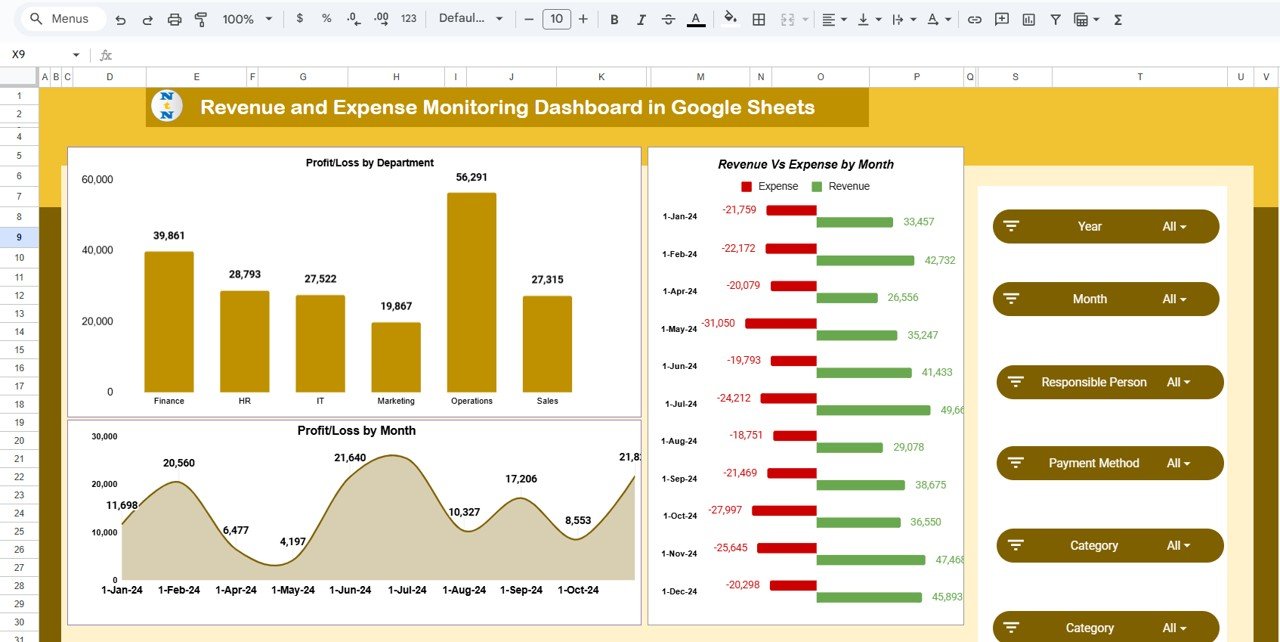
💹 2. Profit and Loss Analysis
Understand your financial performance at a deeper level:
Profit/Loss by Department
Profit/Loss by Month
Revenue vs Expense by Month
This view highlights which departments are profitable and when expenses spike, enabling strategic budgeting and forecasting.
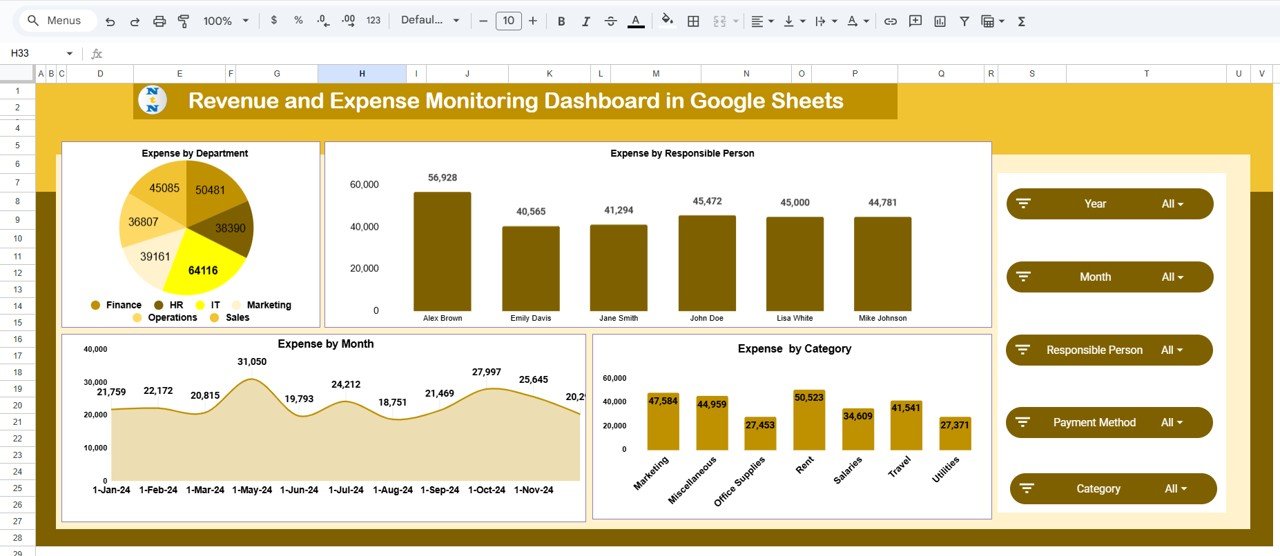
💰 3. Expense Analysis Tab
Track spending across multiple dimensions with charts such as:
Expense by Department
Expense by Responsible Person
Expense by Category
Expense by Month
These visuals help spot overspending trends and keep financial discipline strong.
💵 4. Revenue Analysis Tab
Dive deep into your income sources:
Revenue by Month
Revenue by Category
Revenue by Responsible Person
Revenue by Department
These insights ensure that businesses can focus on high-performing products, services, or teams to maximize revenue potential.
📑 5. Data Sheet Tab
The Data Sheet is the backbone of the dashboard — where all financial data is entered.
Fields Include:
Date
Department
Category
Responsible Person
Revenue Amount (USD)
Expense Amount (USD)
Profit/Loss (Auto-calculated)
Once data is entered, all charts and KPIs auto-refresh instantly — giving you real-time financial visibility.
🌟 Advantages of Using This Dashboard
📊 Centralized Financial Monitoring: Track all key financial metrics in one place.
⚙️ Automated Calculations: Eliminate manual math errors with built-in formulas.
🧭 Visual Financial Insights: Turn raw data into actionable graphs and KPIs.
🌍 Cloud Collaboration: Multiple users can update data in real time.
💡 Customizable: Add new categories, departments, or fields easily.
🕒 Real-Time Updates: Charts refresh instantly as data changes.
💻 Accessible Anywhere: Use on desktop, tablet, or mobile devices.
💰 Cost-Effective: Enjoy professional analytics without costly software.
🚀 Opportunities for Improvement
Enhance your dashboard even further with these optional upgrades:
🔗 Automated Data Import: Sync directly with accounting tools for live updates.
💬 Expense Approval Workflow: Add verification or approval tracking.
📊 Budget vs Actual Comparison: Measure performance against planned targets.
💱 Currency Conversion: Perfect for global organizations.
📧 Email Notifications: Trigger alerts for overspending or profit drops.
📈 Advanced Visualization: Integrate with Google Looker Studio or Power BI.
💡 Best Practices
✅ Update data weekly or monthly for accurate reporting.
✅ Maintain consistent naming for categories and departments.
✅ Analyze quarterly trends for strategic decision-making.
✅ Protect sensitive data by managing permissions.
✅ Use color-coded conditional formatting to highlight anomalies.
👥 Who Can Use This Dashboard
Finance Teams: For real-time monitoring and reporting.
Department Managers: To track their team’s spending and profit performance.
Business Owners: To make informed growth and budgeting decisions.
Accountants: For reconciliation and expense validation.
Consultants & Freelancers: To monitor personal income and project expenses.
✅ Conclusion
The Revenue and Expense Monitoring Dashboard in Google Sheets gives businesses a crystal-clear view of their financial performance. It brings together all key indicators — revenue, expenses, and profit — into one visual, automated system that’s easy to maintain and share.
If your goal is to improve financial accuracy, transparency, and decision-making, this dashboard is your all-in-one solution — designed to simplify accounting while empowering smarter business growth.
🔗 Click here to read the detailed blog post
Watch the step-by-step video Demo: