₹1,899.00Original price was: ₹1,899.00.₹999.00Current price is: ₹999.00.
💡 Powerful Retail Dashboard in Google Sheets for smart performance tracking:
🔹 Gross Sales Tracker — Monitor total and net sales in real time
🔹 Discount Monitoring — See total discounts and average percentage at a glance
🔹 Product-Level Analysis — Understand what’s selling and what’s not
🔹 Sales Trends by Month — Track changes and forecast future sales
🔹 Store-Wise Breakdown — Compare location performance visually
🔹 Rep-Wise Sales Chart — Identify your top-performing team members
🔹 Auto KPIs and Charts — Instantly generated insights from raw data
🔹 User-Friendly Interface — Google Sheets based, no complex tools needed
🔹 Fully Customizable — Add or remove KPIs to match your business needs
Managing a retail business means juggling multiple metrics every day—sales, discounts, inventory, and team performance. The Retail Dashboard in Google Sheets gives you a powerful, visual, and easy-to-use solution to monitor all these key performance indicators (KPIs) from one clean interface. Whether you’re a store owner, manager, or sales analyst, this dashboard helps you make faster, smarter decisions.
Retail Dashboard in Google Sheets
✨ Key Features of Retail Dashboard in Google Sheets
🔹 Interactive Dashboard Sheet:
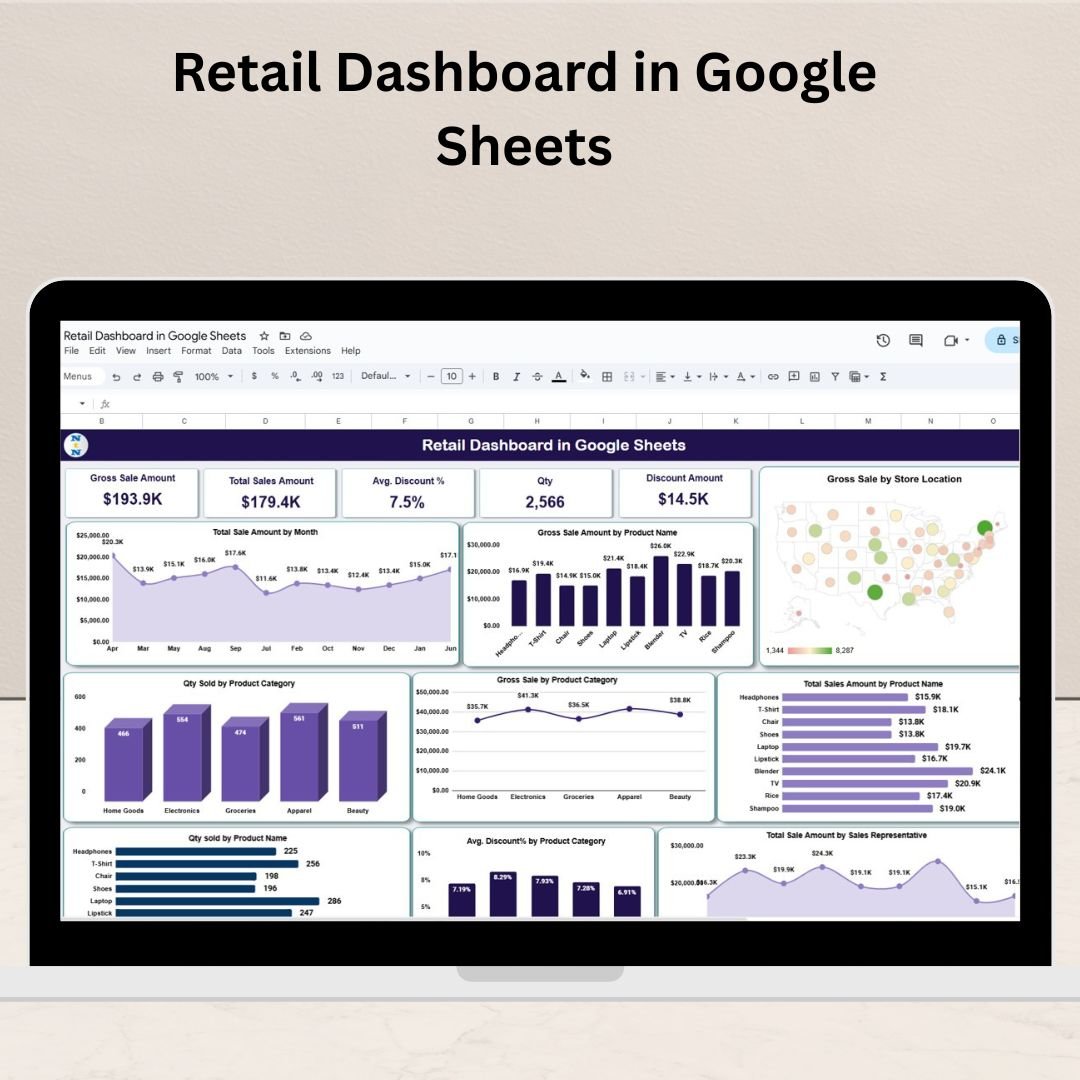
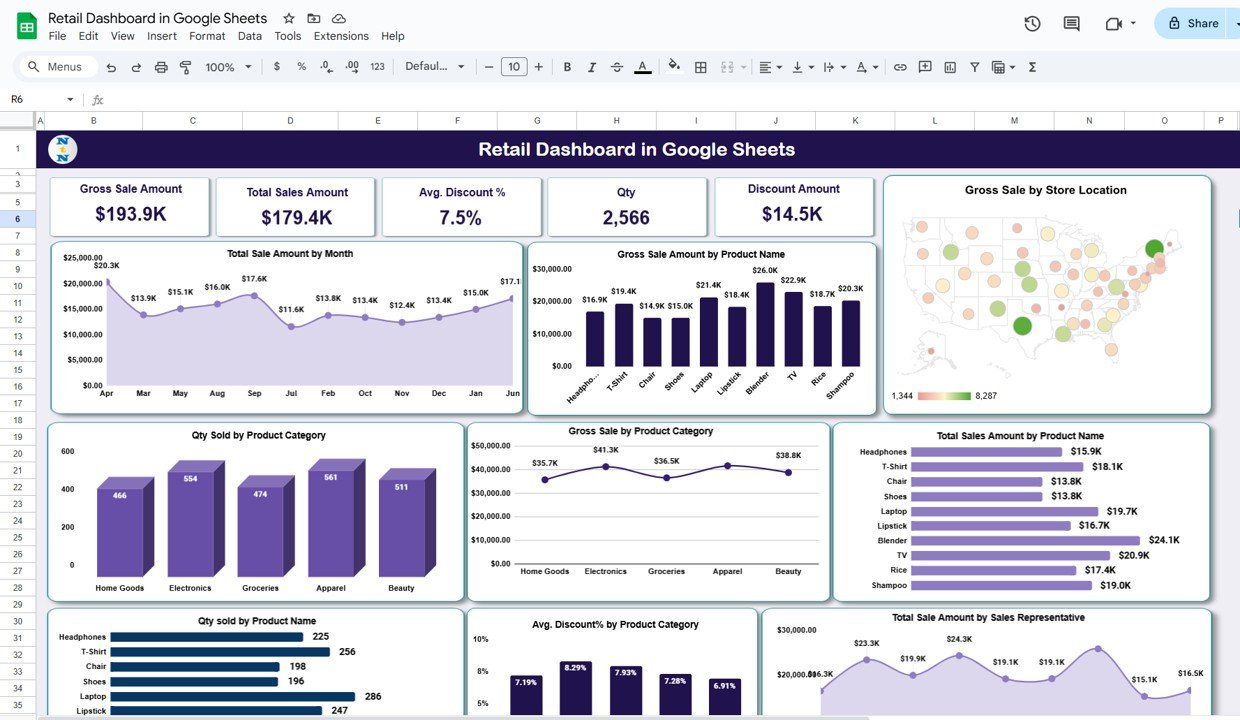
5 KPI Cards: Gross Sale Amount, Total Sales Amount, Average Discount %, Quantity Sold, and Discount Amount.
10+ Dynamic Charts: Visual breakdowns by store location, month, product name, product category, and sales rep.
Auto Updating Progress: Charts and cards refresh as you update your data.
📈 Visualizations That Drive Decisions:
Gross Sale by Location
Sales Amount by Month
Qty Sold by Product Category
Discount % by Product Category
Sales Amount by Sales Rep and more!
📄 Data Sheet Tab:
Easy data entry section for adding daily/monthly sales data
Automatically feeds charts and KPIs with accurate data
📆 What’s Inside the Retail Dashboard
Dashboard Sheet Tab: Real-time visual insights at a glance
Data Sheet Tab: Raw data entry section for sales input
Automated KPIs: Calculates Gross Sales, Total Sales, Discounts, and Quantity Sold
Charts: Pre-built analytics covering locations, products, and team performance
Customization Options: Add your own KPIs or modify visuals as needed
🔧 How to Use the Retail Dashboard in Google Sheets
📆 Input Sales Data: Head to the Data Sheet and enter sales transactions regularly.
🔄 Watch It Update: The dashboard updates all charts and KPI cards automatically.
📊 Analyze Trends: Use visual graphs to identify sales spikes, underperformers, and discount effectiveness.
💼 Share With Team: Share the file with your team to keep everyone aligned and data-driven.
🤝 Who Can Benefit from This Retail Dashboard?
💼 Store Managers: Get a snapshot of overall performance in seconds
🚗 Retail Business Owners: Make data-driven decisions to boost profits
🤵 Sales Executives: Track sales rep performance and product trends
📅 Franchise Owners: Compare store location performances with ease
🚀 Startups & Small Businesses: Begin data tracking without costly software










Reviews
There are no reviews yet.