
Real Estate Property Portfolio Performance Dashboard in Google Sheets

Google Sheets - instant download

Original price was: ₹1,499.00.Current price is: ₹699.00.
Details, requirements and demo below
Sale!

Real Estate Property Portfolio Performance Dashboard in Google Sheets

Original price was: ₹1,499.00.Current price is: ₹699.00.

Simplify your property management with the Real Estate Property Portfolio Performance Dashboard in Google Sheets 🏘💰 — your all-in-one platform to track costs, areas, clients, and performance visually.

✨ Key Features Include:
🏡 KPI Cards – Track total properties, cost, and area instantly
📊 Smart Charts – Analyze cost, area & client distribution dynamically
🔎 Search Tab – Locate properties or clients instantly
📈 Region & Type Analysis – Compare investment performance
🧩 Auto-Updated Dashboard – Charts refresh in real time
👥 Collaborative Access – Work with your entire property team
☁️ Google Sheets Based – No software installation needed
🚀 Fully Customizable – Edit categories, types, or visuals freely

- +

💡 Buy any 2 templates and save 20% automatically at checkout.

Pricing country
Prices follow your selected country; checkout uses your billing country.
Excel Pivot Tables & Dashboards: Basic to Advanced courseLaunch offer
🎓 NEXTGENTEMPLATES ACADEMY
Like this dashboard? Learn to build your own.
Excel Pivot Tables & Dashboards: Basic to Advanced

From your first Pivot Table to the Data Model, DAX, Power Query and a one-page KPI dashboard. 11h 51m of video by PK, with practice files, quizzes and a capstone.

Managing multiple real estate properties can be complex — balancing investment costs, occupancy, and client relations requires clarity and control. The Real Estate Property Portfolio Performance Dashboard in Google Sheets is a ready-to-use, automated solution designed for real estate investors, property managers, and brokers to track portfolio performance, analyze costs, and optimize asset utilization.

This smart, visual, and data-driven tool transforms raw property data into actionable insights, giving you a complete overview of your portfolio’s financial and operational health — all within the convenience of Google Sheets.

Whether you manage residential apartments, commercial buildings, or mixed-use developments, this dashboard helps you make informed, data-backed decisions to maximize ROI.
Real Estate Property Portfolio Performance Dashboard in Google Sheets

🔑 Key Features of the Real Estate Property Portfolio Performance Dashboard in Google Sheets

📋 Dashboard Sheet Tab (Main Analytics Page)
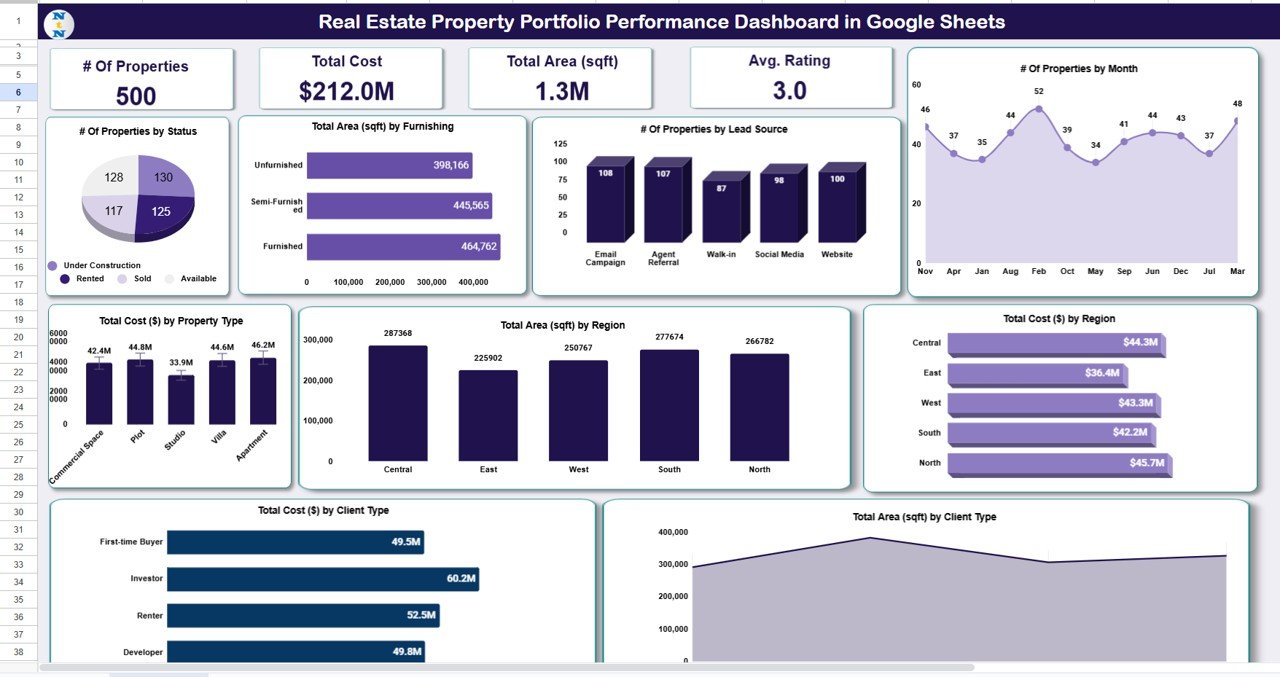
Your central hub for visualizing the complete portfolio at a glance.

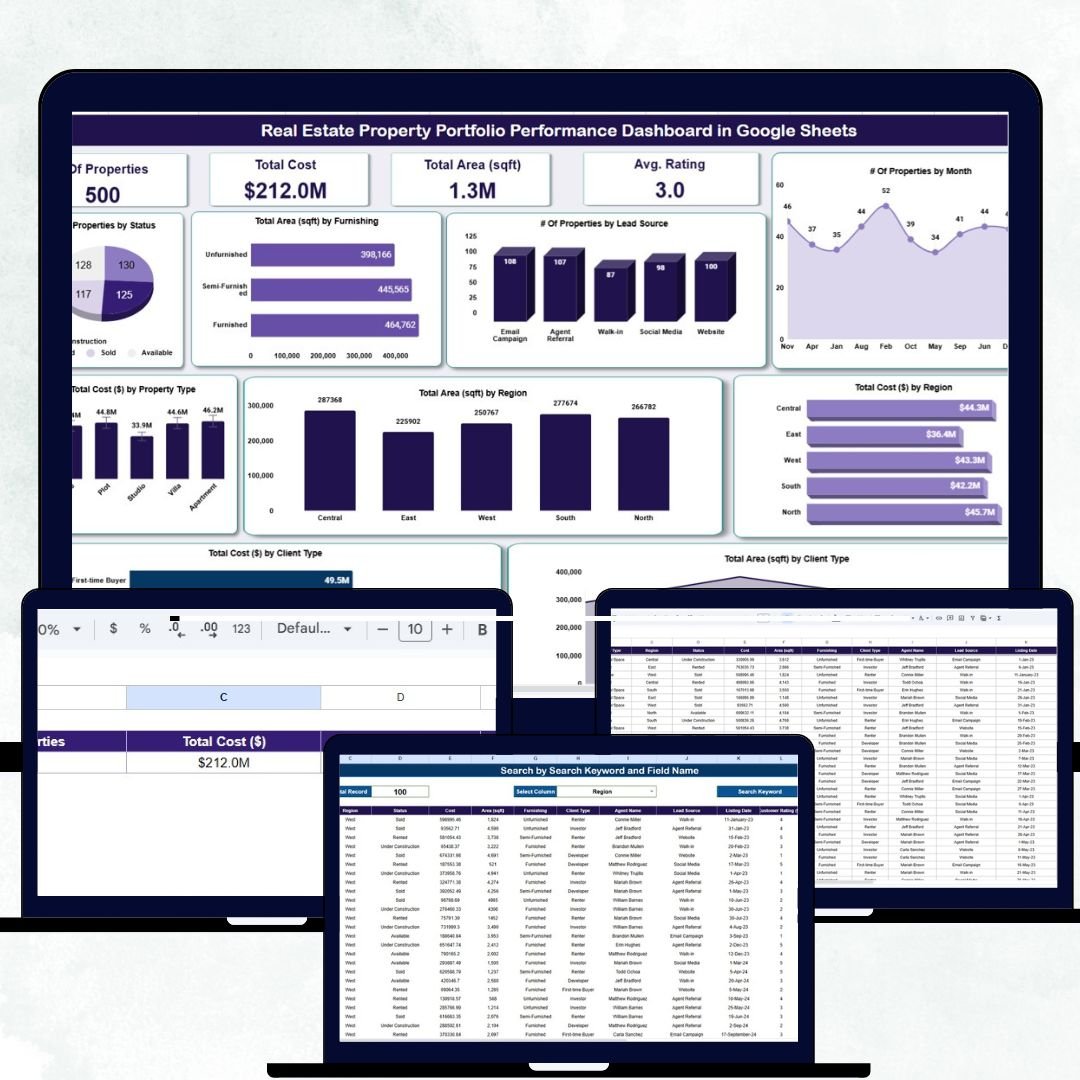
KPI Cards:
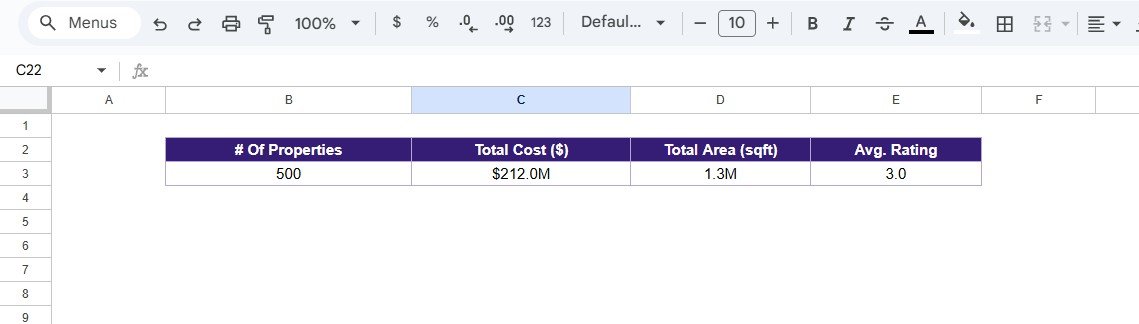
🏘 # of Properties: Displays the total number of properties in your portfolio.
💰 Total Cost ($): Aggregates the total purchase or construction cost.
📏 Total Area (sqft): Shows the cumulative built-up or usable area.
⭐ Average Rating: Reflects overall satisfaction or performance ratings.

Charts Included:
📊 # of Properties by Status: Categorizes properties as Available, Sold, Leased, or Under Construction.
🏢 Total Area (sqft) by Furnishing: Compares area across Furnished, Semi-Furnished, and Unfurnished units.
👥 # of Properties by Lead Source: Tracks where inquiries come from (e.g., Ads, Agents, Referrals).
📆 # of Properties by Month: Visualizes new acquisitions or deals monthly.
🌍 Total Cost ($) by Region: Identifies regions with high investment concentration.
📈 Total Area (sqft) by Region: Compares regional property footprints.
🏠 Total Cost ($) by Property Type: Breaks down spending across Apartments, Villas, Offices, or Retail Units.
🤝 Total Cost ($) by Client Type: Analyzes cost contribution from Individuals, Corporates, and Investors.
📐 Total Area (sqft) by Client Type: Displays client group-wise property occupancy.

All charts auto-refresh when data is entered or modified in the Data Sheet — ensuring real-time visibility.


🔍 Search Sheet Tab (Smart Lookup Page)
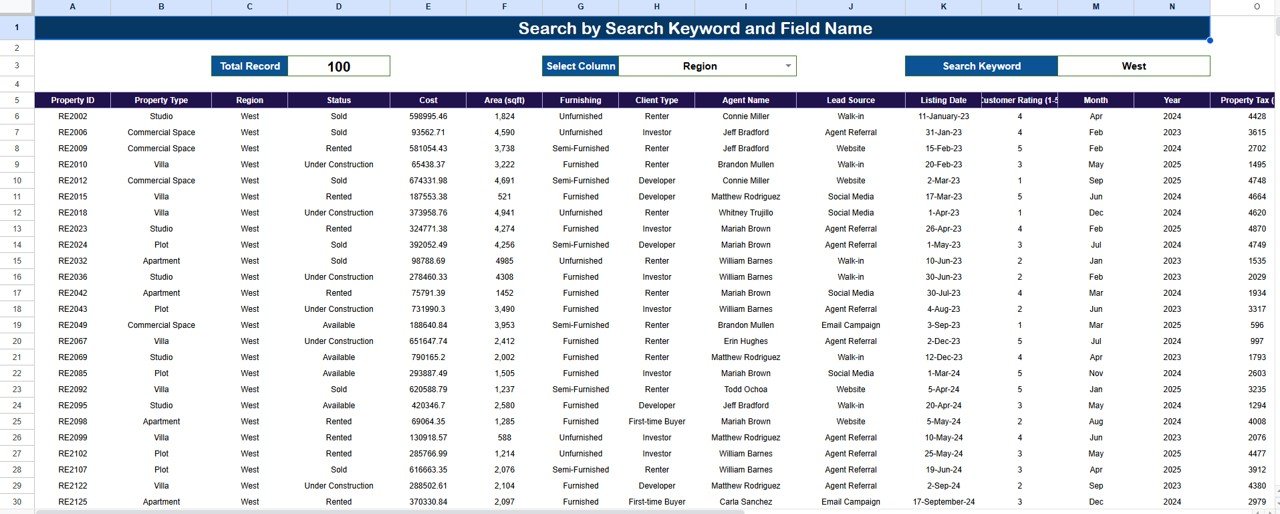
Easily find any property or client record using the built-in search feature.

How It Works:

  • Search by Keyword: e.g., “Villa” or “Downtown” to locate related entries.

  • Search by Field Name: e.g., “Status,” “Region,” or “Client Type” for targeted results.
    Examples:

  • Searching “Corporate” filters all corporate-owned properties.

  • Searching “Leased” shows all active leased properties.

Perfect for quick analysis, audits, and client reporting.


📊 Data Sheet Tab (Database)
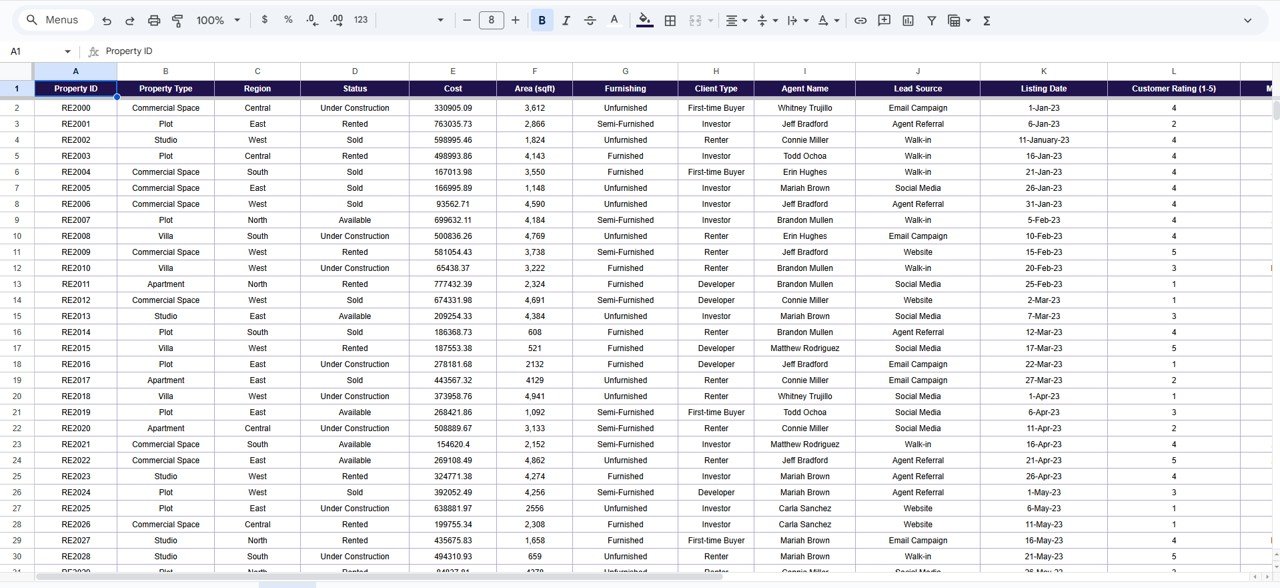
The foundation of your dashboard — stores all property records in a structured format.
Includes columns for:

  • Property Name / ID

  • Region

  • Property Type

  • Status

  • Client Type

  • Lead Source

  • Total Area (sqft)

  • Cost ($)

  • Rating / Feedback

This structured setup feeds all charts and KPIs seamlessly.


⚙️ Support Sheet Tab
Contains dropdown lists, formulas, and data validation settings that power automation and maintain consistency.


📦 What’s Inside the Dashboard

✅ Fully functional Google Sheets dashboard file
✅ 10+ auto-updating charts and KPI cards
✅ Smart search tab for instant lookups
✅ Editable data and dropdown fields
✅ Real-time collaboration for multiple users
✅ 100% customizable for any real estate business
✅ Plug-and-play — no coding or add-ons required


🧑‍💼 Who Can Benefit from This Dashboard

🏘 Real Estate Agents – Track property listings and client activity.
🏢 Property Managers – Manage leasing, maintenance, and costs efficiently.
💰 Investors & Developers – Monitor capital distribution and project progress.
📊 Financial Teams – Evaluate property profitability and performance metrics.
🌍 Brokerage Firms – Centralize all property and client data for portfolio insights.

It’s the perfect all-in-one tool for anyone managing multiple properties across different locations.


🧪 How to Use the Real Estate Property Portfolio Performance Dashboard

1️⃣ Enter property details into the Data Sheet.
2️⃣ Watch all KPIs and charts auto-update in real time.
3️⃣ Use filters or the Search Tab to find specific data points.
4️⃣ Review portfolio performance by region, client type, or property status.
5️⃣ Update records monthly for consistent trend analysis.

💡 Pro Tip: Add your sales or rental data to create a full Profit vs. Cost performance view.


🌟 Why Choose This Dashboard

  • 🏡 Complete visibility into property portfolio performance

  • 📈 Smart automation with dynamic charts and analytics

  • 👥 Team collaboration via Google Sheets

  • ⚙️ Fully editable for different property types

  • 🚀 Ready to use — no complex setup required

The Real Estate Property Portfolio Performance Dashboard in Google Sheets turns property data into business intelligence — helping you save time, make smarter decisions, and drive long-term profitability. 🌟


🔗 Click here to read the Detailed blog post

Watch the step-by-step video Demo:

 

🔗 Visit our YouTube channel to learn step-by-step video tutorials

Frequently asked questions

How do I get my own copy?
After purchase you get a link to the Google Sheet. Open it while signed in to your Google account and use File > Make a copy - the copy in your Google Drive is fully yours and editable.
Do I need a paid Google account? Will it expire?
No. A free Google account is enough, and your copy lives in your own Google Drive - it never expires and there is nothing to renew.
Does it work on Mac, phone or tablet?
Yes - in any browser on Windows, Mac or Chromebook, and in the Google Sheets mobile app for viewing and quick entries.
Can I share it with my team?
Yes. Share your copy with colleagues using Google's normal sharing, with view or edit rights as you choose.
Can I change the design and formulas?
Yes, your copy is fully editable - colours, labels, logo, formulas and charts. If a range is protected, use Data > Protect sheets and ranges to remove it in your copy.
Are there macros or add-ons?
No macros or add-ons - it uses normal Google Sheets formulas and charts.
Is it a one-time payment or a subscription?
One-time payment. No subscription, no per-user fees and nothing to renew - the file is yours to keep.
How do I get the file after payment?
Instantly. The download link appears on screen after checkout, is emailed to you, and stays under My Account > Downloads on our website. If the email does not arrive within a few minutes, check your spam or promotions folder.
Is a user manual included?
Most of our newer products include a PDF user manual in the download. If yours does not have one, message us with your order number and we will send it.
Do I get free updates?
Bug fixes are always free - if something does not work as described, we fix it and send you the corrected file. New versions with new features are not included in the price, unless this product's description says otherwise.
Can you customise it for me?
Yes. Small changes to this template (your columns, categories, logo, colours, minor layout) cost the template price plus $40-80 (Rs 3,000-6,000 + GST), quoted once you send your list. A fully custom build is usually $100-200 (Rs 8,000-18,000 + GST) with two revision rounds. Email your requirements to [email protected] or message us on WhatsApp.
Can I use it for my business or my clients?
Yes, for your own personal or internal business use, for as long as you like. Reselling or redistributing the template is not allowed.
What is your refund policy?
Because these are digital downloads, they are non-refundable once delivered - except when the product does not match its description (report it within 48 hours of purchase) or there is a technical problem our team cannot fix within 72 hours. Email [email protected] with your order number.
How do I get help?
Email [email protected] (Mon-Fri, 10 AM-7 PM IST) or message us on WhatsApp +91 80770 90260 (chat only, no calls). Please include your order number.

Still have a question? Click Need help? at the bottom-left to ask our assistant, or message us on WhatsApp.

Application

Google Sheets

Template Type

Dashboard

Price

Paid

Business Or Department

Real Estate

Reviews

There are no reviews yet.

Only logged in customers who have purchased this product may leave a review.

Real Estate Property Portfolio Performance Dashboard in Google SheetsReal Estate Property Portfolio Performance Dashboard in Google Sheets
Original price was: ₹1,499.00.Current price is: ₹699.00.
- +
Scroll to Top