

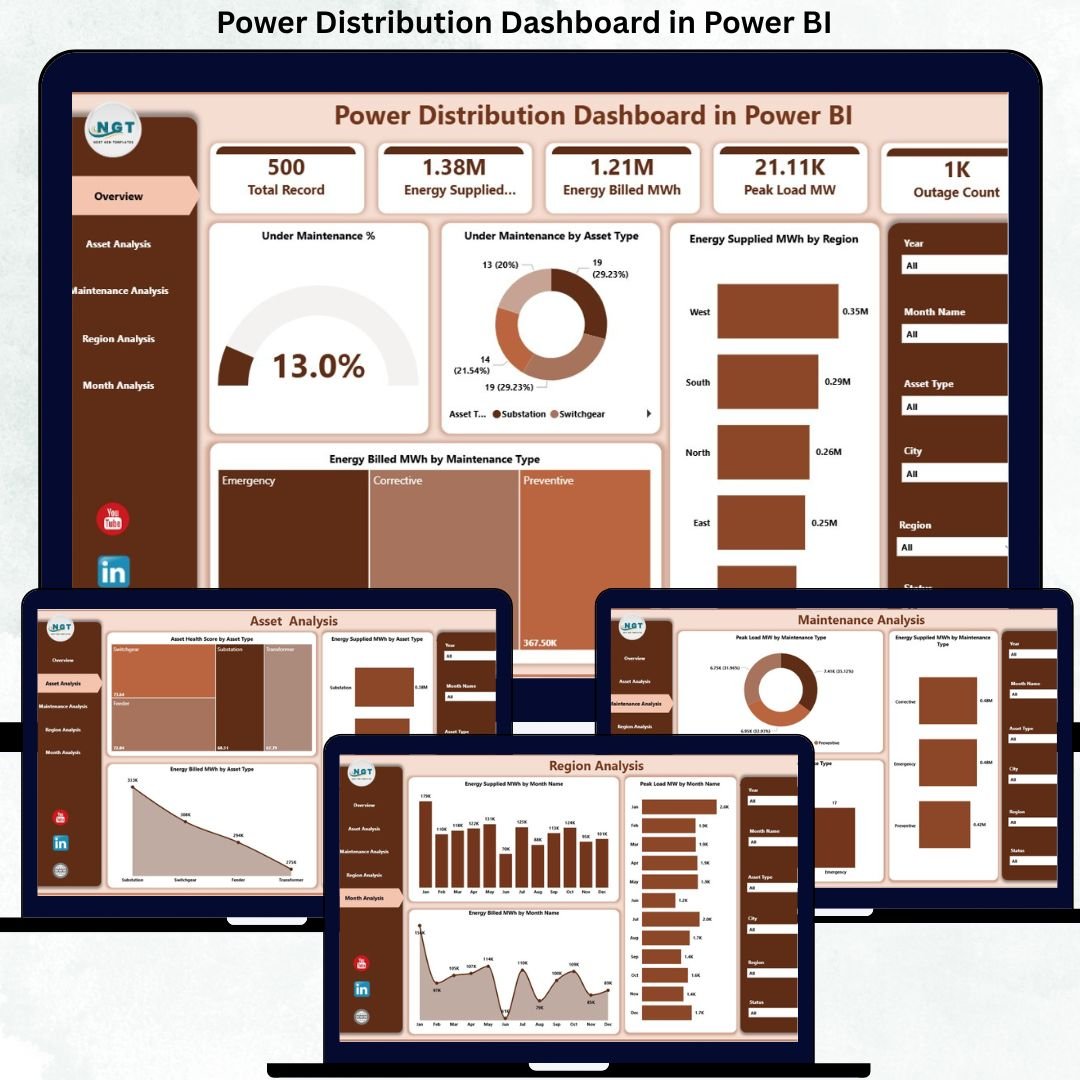

Power Distribution Dashboard companies operate in a highly complex, asset-intensive, and time-critical environment. Every day, teams must manage electricity flow, monitor asset health, handle maintenance activities, reduce outages, and ensure accurate energy billing. However, when operational data remains scattered across Excel files, SCADA exports, and manual reports, visibility is lost, and decisions become reactive.
That is exactly where the Power Distribution Dashboard in Power BI becomes a powerful and essential solution.
This ready-to-use dashboard transforms raw power distribution data into clear, interactive, and actionable insights. Instead of spending hours compiling reports, utilities and power companies can monitor energy supplied, energy billed, asset health, maintenance status, outages, regional performance, and monthly trends from one centralized Power BI dashboard.
Because this dashboard is built using Power BI with structured data sources, it delivers real-time visibility, faster decision-making, and better operational control—without complex tools or coding.
🚀 Key Features of Power Distribution Dashboard in Power BI
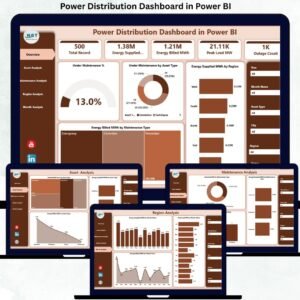
This professionally designed dashboard includes five structured analytical pages, each focused on a critical area of power distribution performance.
📊 Overview Page – Instant System-Wide Visibility
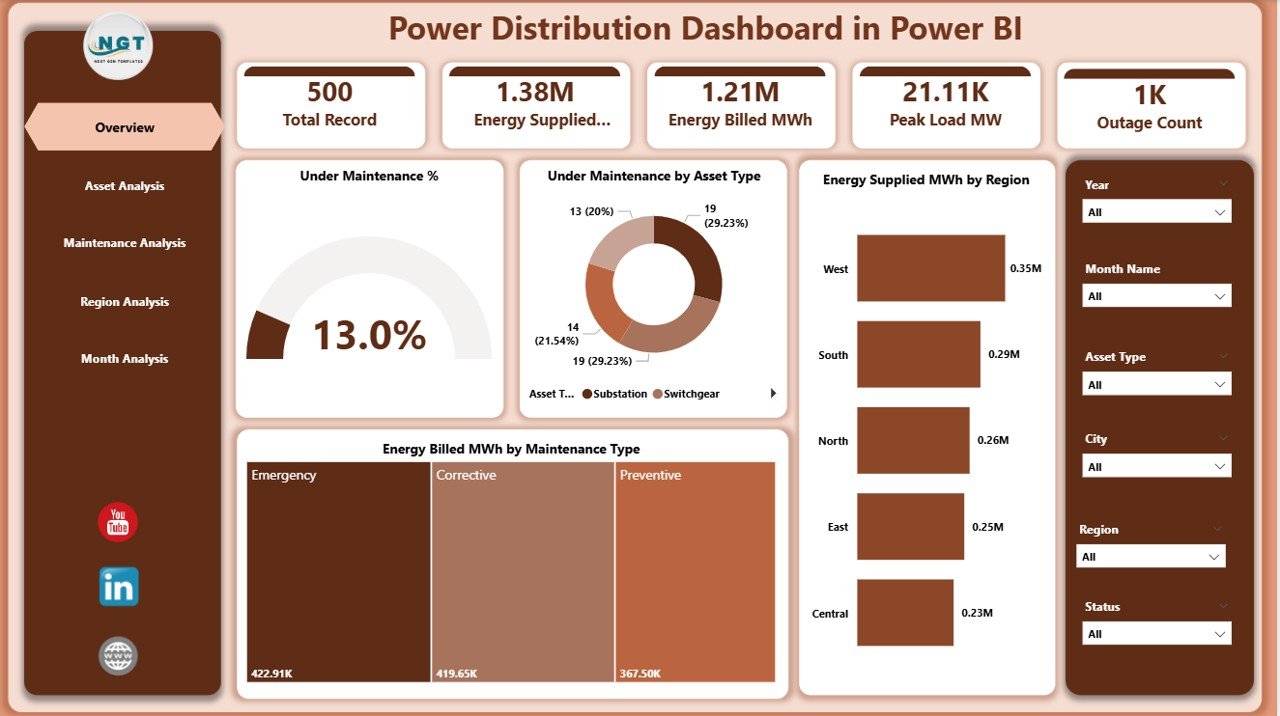
⚡ Interactive slicers for Region, Asset Type, and Maintenance Type
📌 KPI Cards showing Under Maintenance % and key metrics
📈 Under Maintenance % by Asset Type
🌍 Energy Supplied (MWh) by Region
💡 Energy Billed (MWh) by Maintenance Type
This page gives leadership a quick, executive-level snapshot of network health and performance.
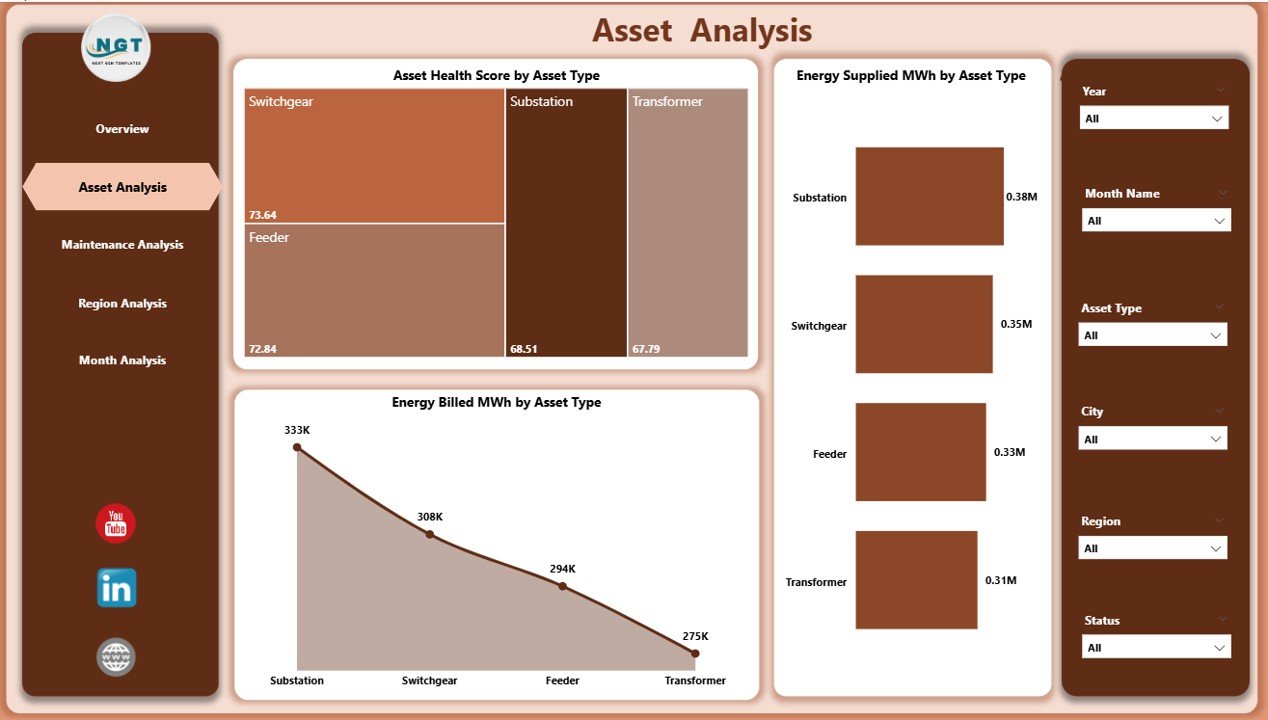
🏗 Asset Analysis Page – Asset Health & Contribution
🔧 Asset Health Score by Asset Type
⚡ Energy Supplied (MWh) by Asset Type
💰 Energy Billed (MWh) by Asset Type
With this page, asset managers can identify weak assets, prioritize maintenance, and plan replacements more effectively.
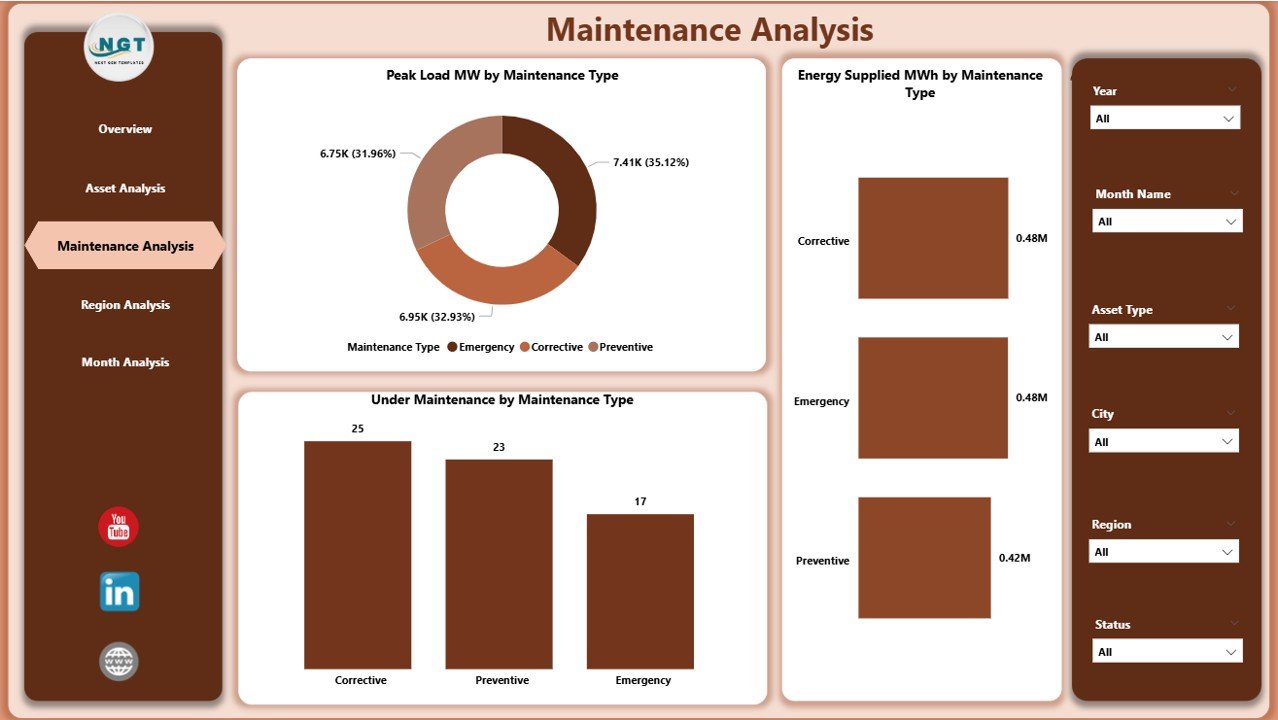
🛠 Maintenance Analysis Page – Maintenance Impact Visibility
📈 Peak Load (MW) by Maintenance Type
⚡ Energy Supplied (MWh) by Maintenance Type
🚧 Under Maintenance by Maintenance Type
This analysis helps teams balance preventive and corrective maintenance while minimizing load stress and service disruptions.
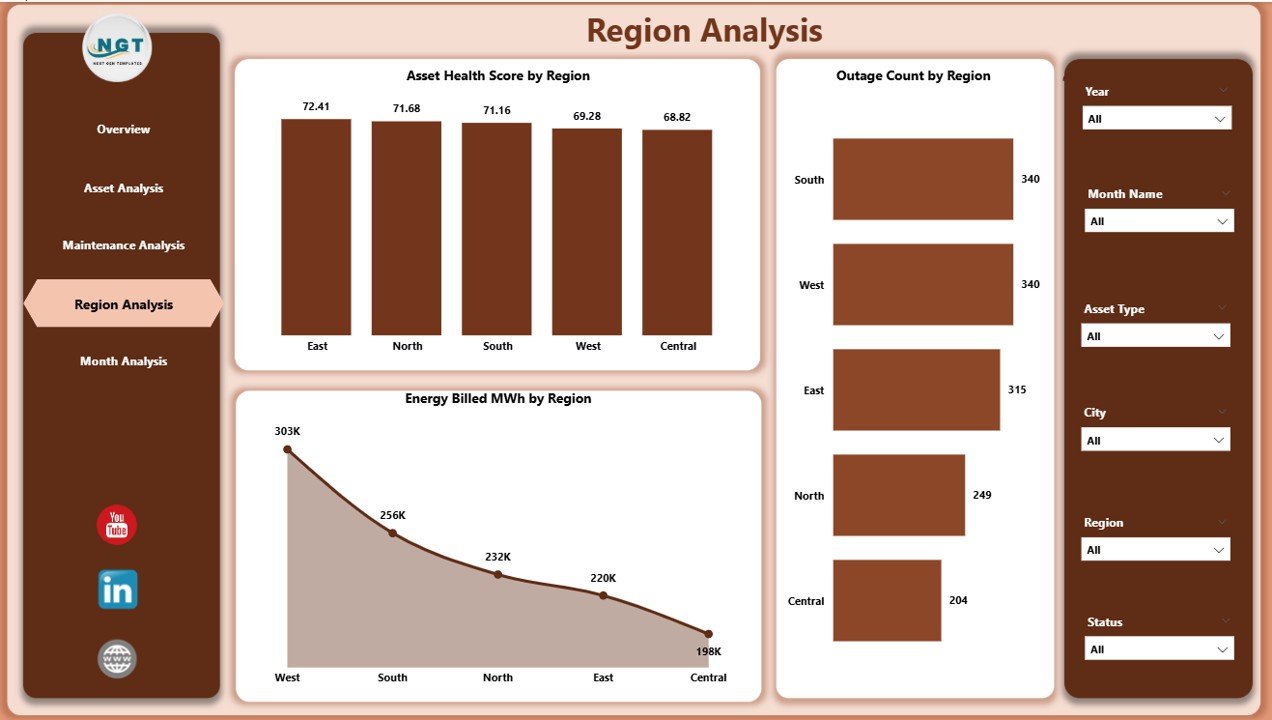
🌍 Region Analysis Page – Regional Performance Comparison
🧭 Asset Health Score by Region
🚨 Outage Count by Region
💵 Energy Billed (MWh) by Region
Using this page, management can identify high-risk regions, control outages, and improve regional billing performance.
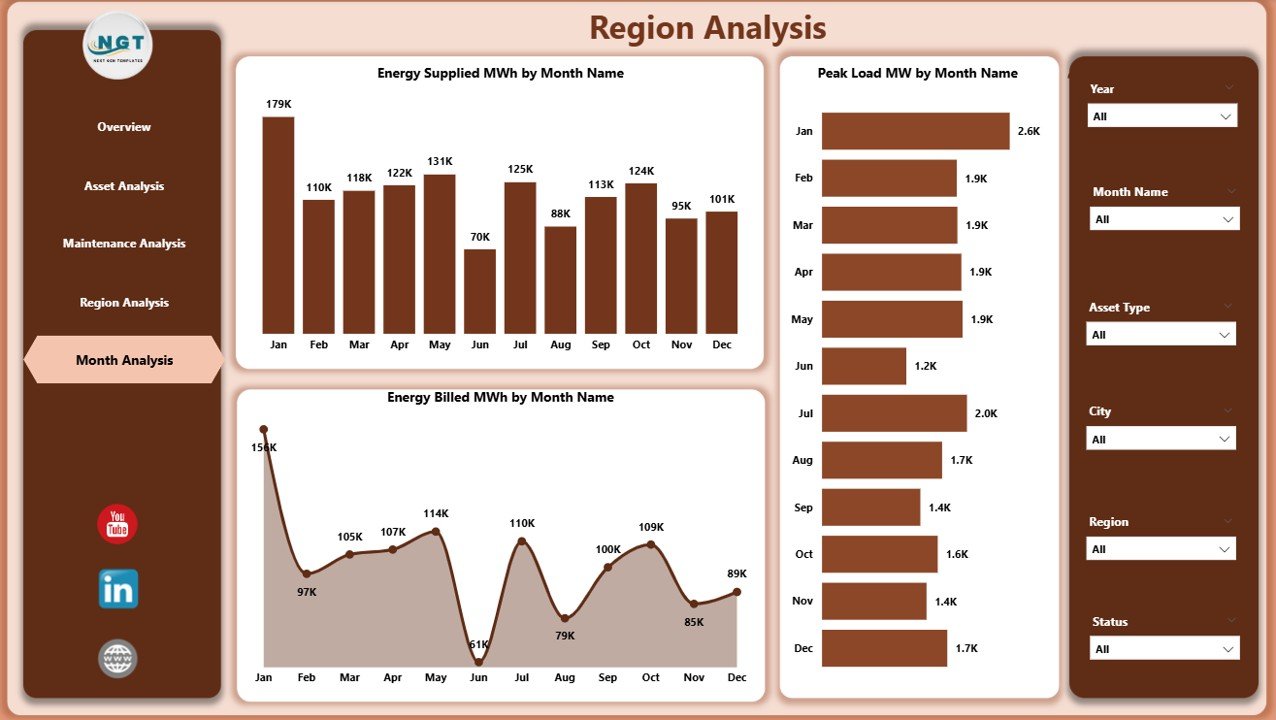
📅 Monthly Trends Page – Time-Based Performance Tracking
⚡ Energy Supplied (MWh) by Month
📊 Peak Load (MW) by Month
💰 Energy Billed (MWh) by Month
Monthly trends help utilities detect seasonal patterns, forecast demand, and plan capacity upgrades proactively.
📦 What’s Inside the Power Distribution Dashboard in Power BI
✅ Fully interactive Power BI (.pbix) dashboard
✅ 5 structured analytical pages
✅ KPI cards, charts, and slicers
✅ Asset, maintenance, region, and trend analysis
✅ Professional, clean, executive-ready design
✅ Easy-to-connect Excel or database data source
✅ Scalable for small and large power networks
⚙️ How to Use the Power Distribution Dashboard in Power BI
Update power distribution data in Excel or your data source
Refresh the Power BI dashboard
Use slicers to filter by region, asset type, or maintenance type
Monitor energy supply, billing, and outages
Identify asset risks and maintenance priorities
Use insights for operational reviews and management reporting
No advanced Power BI or coding skills are required.
👥 Who Can Benefit from This Dashboard
⚡ Power Distribution Companies
🏭 Utility Operators
🔧 Asset & Maintenance Managers
📊 Power System Analysts
💼 Operations & Reliability Teams
🏛 Government & Regulatory Bodies
This dashboard is ideal for urban, regional, and large-scale power distribution networks.
### Click here to read the Detailed blog post
📺 Visit our YouTube channel to learn step-by-step video tutorials
👉 https://youtube.com/@PKAnExcelExpert
Watch the step-by-step video tutorial:
Compatibility and Requirements
- Works in Power BI Desktop, which is free. Download it from Microsoft: Get Power BI Desktop.
- The dashboard is a Power BI (.pbix) file. Connect it to an Excel file or a database that holds your power distribution data.
Frequently Asked Questions
Which pages are included in the dashboard?
Five pages: Overview, Asset Analysis, Maintenance Analysis, Region Analysis and Monthly Trends.
Can I filter the dashboard by region or asset type?
Yes. The Overview page has slicers for Region, Asset Type and Maintenance Type, so you can narrow every chart to the part of the network you want to review.
What can I see on the Region Analysis page?
It shows Asset Health Score by Region, Outage Count by Region and Energy Billed (MWh) by Region, so you can compare regions side by side.
Where does the data come from?
You update your power distribution data in Excel or another data source, then refresh the dashboard in Power BI. The template works with an Excel or database source.
Is there an Excel version?
Yes. See the Power Distribution Dashboard in Excel. A related Power Distribution KPI Dashboard in Power BI is also available.
Related Power Distribution Templates
- Power Distribution Dashboard in Excel: the same topic in Excel
- Power Distribution KPI Dashboard in Power BI: a KPI-focused Power BI edition
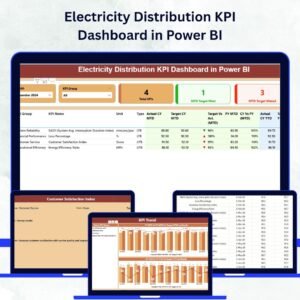
- Electricity Distribution KPI Dashboard in Power BI: electricity distribution KPIs in Power BI
- Energy Consumptions Dashboard in Power BI: track energy use in Power BI
- Power BI Dashboard Mega Collection: 15 Power BI templates in one download
Browse all Power BI dashboards.
































Reviews
There are no reviews yet.