

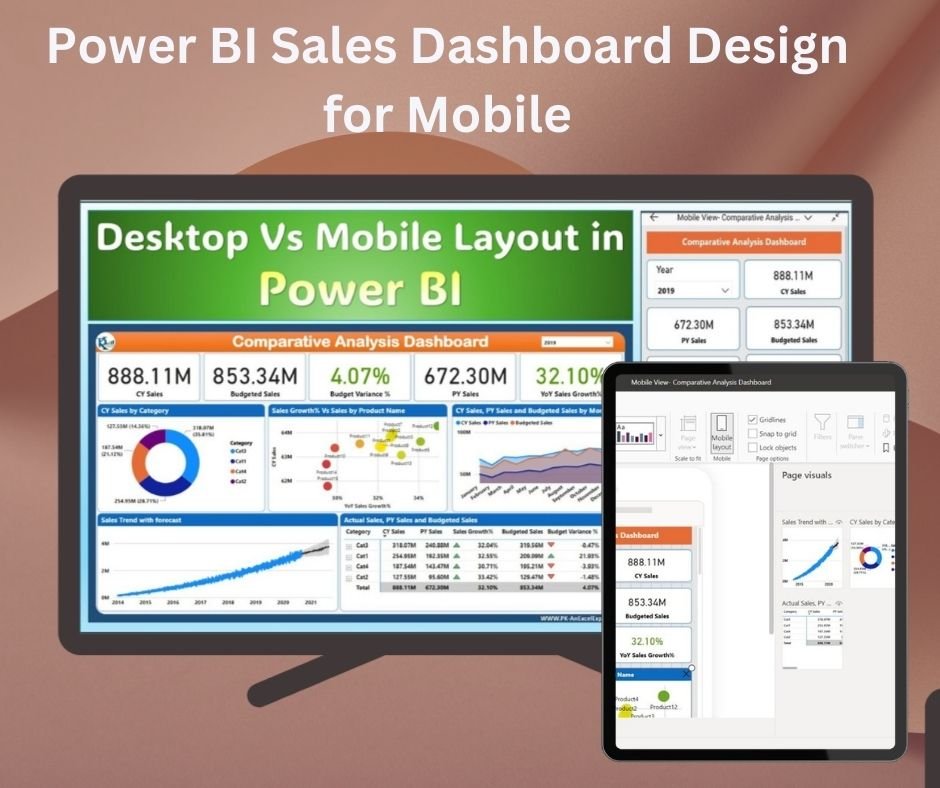
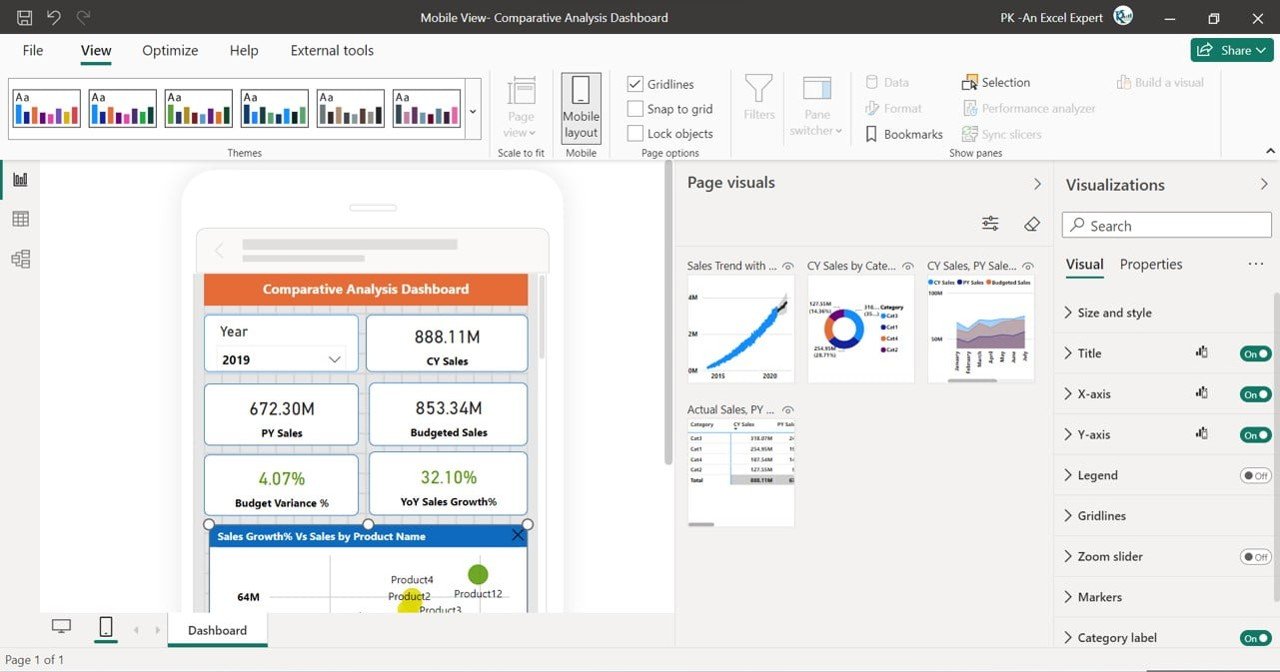
The Power BI Sales Dashboard Design for Mobile is a ready-made Power BI template that brings business intelligence and data visualization to your smartphone or tablet. It is built for sales managers, business owners and data analysts who need to track sales, revenue, customer data and other key metrics anytime, anywhere. You get a responsive, easy-to-read mobile sales dashboard that keeps your KPIs within reach, even when you are on the go.

Most dashboards are designed for large monitors and become hard to use on a phone. This template is specifically optimized for mobile viewing, with interactive charts and graphs that are easy to navigate on smaller screens, so you do not have to compromise on visual appeal or functionality. It works as a complete sales performance dashboard that you can open on a desktop and then check on your mobile device.
Key Features of the Power BI Sales Dashboard Design for Mobile
- Mobile-optimized design: Access your business intelligence dashboard on any mobile device, from smartphones to tablets.
- Customizable sales KPIs: Tailor the dashboard to track key sales metrics such as revenue, sales growth and product performance.
- Real-time data tracking: View live sales data, monitor trends and make data-driven decisions on the move.
- Interactive visualizations: Explore data with dynamic, interactive charts, graphs and KPIs optimized for mobile use.
- Time-based insights: Analyze sales trends over specific periods – daily, weekly, monthly or yearly.
- Cross-device synchronization: Sync data between your desktop and mobile devices for seamless access.
- User-friendly interface: An intuitive layout makes navigation and interaction with your data effortless.
Why You Will Love This Mobile Sales Dashboard
- Mobile accessibility: Stay connected to your business data from anywhere, at any time.
- Real-time data visualization: Make quick, informed decisions by viewing current sales and performance data on the go.
- Sales KPI tracking that fits your business: Focus on the metrics that matter most, whether you monitor revenue, customer acquisition or sales growth.
- Seamless mobile experience: Enjoy a smooth, responsive experience tailored for mobile screens, with easy-to-read visuals.
- Business intelligence at your fingertips: Track performance, monitor trends and stay up to date with your sales goals wherever you are.
What’s Inside the Template
| Component | What it does |
|---|---|
| Mobile-friendly layout | Responsive design optimized for mobile devices, including tablets and smartphones. |
| Custom sales metrics | Track and visualize sales data, revenue, customer acquisition and other KPIs. |
| Interactive charts and graphs | Dynamic charts to explore data trends in real time. |
| Time period analysis | Analyze sales performance over various time periods for better decision-making. |
| Sync across devices | Access your data on both desktop and mobile devices. |
Who Is This Dashboard For?
This template is a good fit for anyone who needs sales numbers on hand away from the desk:
- Sales managers
- Business owners
- Data analysts
- E-commerce managers
- Marketing teams
- Executive leadership teams
- Retail managers
If your team wants to use Power BI for mobile reporting without building a phone layout from scratch, this ready-made design gives you a strong starting point.
How to Use the Power BI Sales Dashboard Design for Mobile
- Download the Power BI template: Get access to the mobile-optimized dashboard template.
- Customize your KPIs: Adjust the dashboard to include the sales metrics that matter most to your business.
- Input your sales data: Connect your data sources to Power BI for real-time updates on your mobile device.
- Monitor sales performance: Use the interactive visualizations to track your sales metrics and progress.
- Access on mobile: View your dashboard from any device – smartphone, tablet or desktop – and make data-driven decisions on the go.
Click here to read the detailed blog post Power BI Sales Dashboard Design for Mobile
Visit our YouTube channel to learn step-by-step video tutorials.
Watch the step-by-step video tutorial:
Frequently Asked Questions
What is the Power BI Sales Dashboard Design for Mobile?
It is a Power BI dashboard template designed and optimized for mobile viewing. It lets you track sales, revenue, customer data and other key metrics on smartphones and tablets using interactive charts and graphs.
Which devices can I view the dashboard on?
The layout is responsive and optimized for mobile devices, including smartphones and tablets, and it can also be viewed on a desktop. Data syncs between desktop and mobile for seamless access.
Can I change the KPIs shown on the dashboard?
Yes. The sales KPIs are customizable, so you can track metrics such as revenue, sales growth, product performance and customer acquisition according to your business needs.
Can I analyze sales over different time periods?
Yes. The time-based insights let you analyze sales trends daily, weekly, monthly or yearly to support better decision-making.
How do I add my own sales data?
Connect your data sources to Power BI, and the dashboard visuals will reflect your data so you can monitor it on your mobile device.
Is there a tutorial available?
Yes. A detailed blog post and a step-by-step video tutorial are linked above, and more tutorials are available on our YouTube channel.
Get your sales team on track and boost performance with this mobile-friendly Power BI dashboard designed to bring business intelligence to your fingertips.
Also check our Small Business KPI Dashboard
Last updated: October 2026
Compatibility and Requirements
- Works in Power BI Desktop, which is free to download. Connect your own sales data there, then view the dashboard on a smartphone, tablet or desktop.
- Microsoft explains how to get the app in Get Power BI Desktop.
Related Sales Dashboard Templates
- Sales Dashboard in Excel: a sales overview for Excel users
- Sales KPI Dashboard in Excel: sales KPIs in a workbook
- Sales KPI Dashboard in Google Sheets: the same idea in Google Sheets
- Sales Business Intelligence Dashboard in Excel: deeper sales analysis in Excel
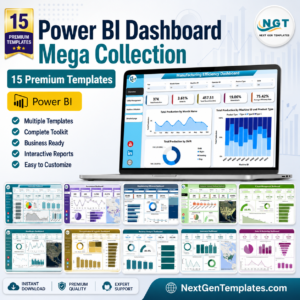
- Power BI Dashboard Mega Collection: 15 Power BI dashboard templates in one download
Browse all Power BI dashboards.











Reviews
There are no reviews yet.