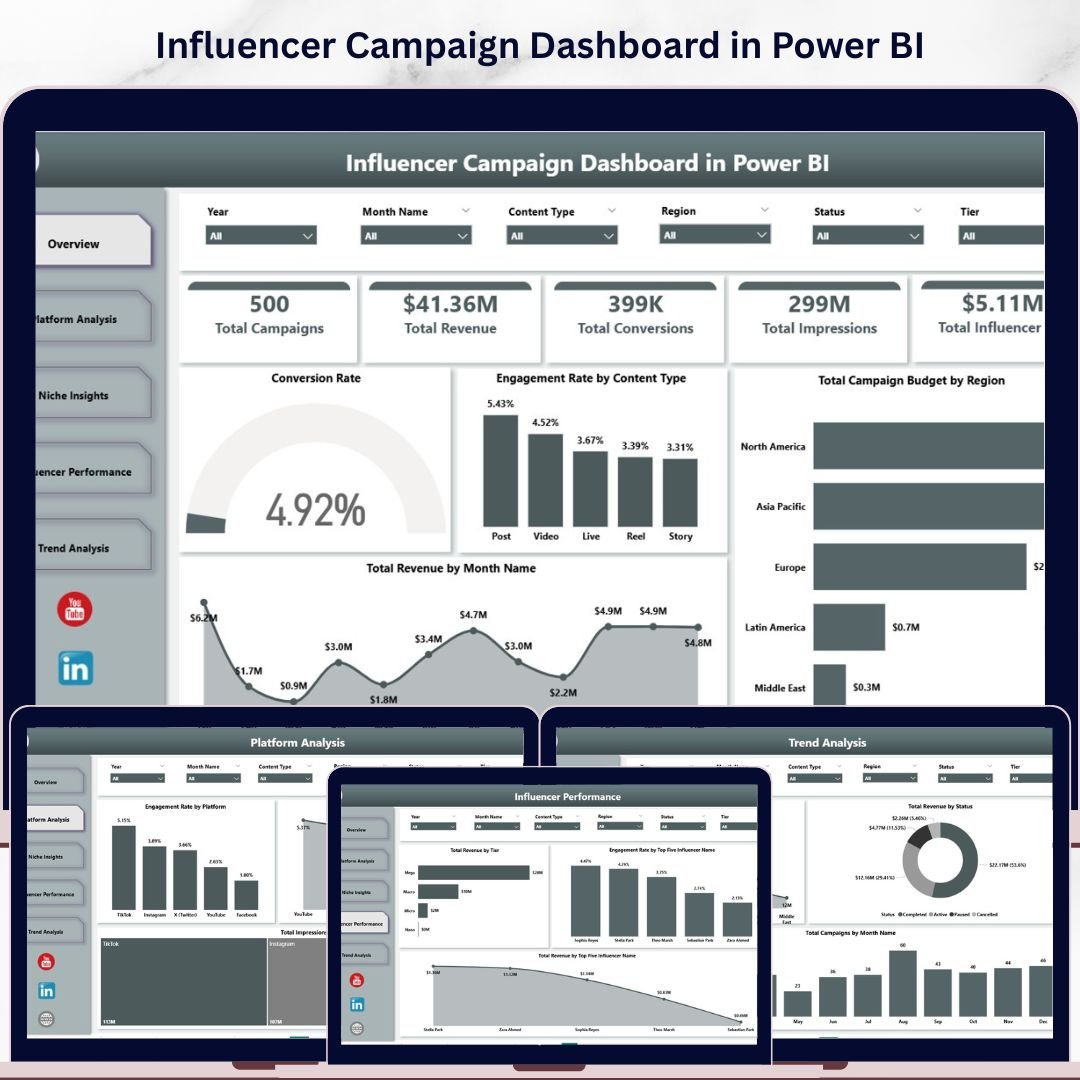
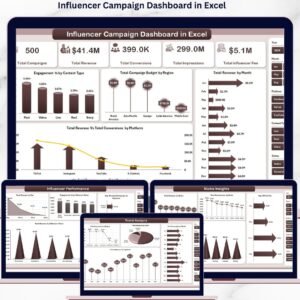
The Influencer Campaign Dashboard in Power BI tracks 5 high-level KPIs and 16 pre-built visuals across 5 interactive report pages — Overview, Platform Analysis, Niche Insights, Influencer Performance, and Trend Analysis. Setup takes under 10 minutes: open the .pixy file in the free Power BI Desktop app, swap the sample data for your own, and every chart, card, and slicer refreshes automatically.
🌍 Join 8,400+ teams across 40+ countries using Nextgen Templates to replace expensive influencer marketing SaaS with one-time-purchase Power BI, Excel, Google Sheets, and HTML templates.
✅ Instant download · One-time payment · No subscription · No per-user fees · Lifetime access
🔑 Key Features of the Influencer Campaign Dashboard in Power BI
This dashboard is built around the metrics influencer marketers actually defend in board meetings — campaign volume, revenue, conversions, impressions, and creator fees. Every page is filterable with Power BI slicers, and every visual refreshes from a single connected data model.
- 📊 Five KPI cards — Total Campaigns, Total Revenue, Total Conversions, Total Impressions, and Total Influencer Fee — anchor the Overview page and recalculate instantly when any slicer is applied.
- 📈 Five interactive report pages covering Overview, Platform Analysis, Niche Insights, Influencer Performance, and Trend Analysis. Each page has its own slicer set for platform, region, tier, niche, content type, and status.
- 🎯 16 pre-built visuals including Engagement Rate by Content Type, Conversion Rate by Platform, Total Revenue by Niche, ROI by Niche, Total Revenue by Tier, and Top Five Influencers by Revenue.
- 🏆 Top Five Influencer benchmarking ranks creators by total revenue and engagement rate so you know exactly who to renew at contract end.
- 🌐 Niche, region, and tier breakdowns reveal which verticals, geographies, and influencer tiers generate the highest revenue and conversion volume from your influencer spend.
- 🎨 Fully editable — change colors, add your logo, rename KPI cards, add new DAX measures, or extend the data model with extra metric columns. The .pbix is yours to modify.
- 💻 Runs on free Power BI Desktop — no Power BI Pro license required to build or view locally. Microsoft offers Power BI Desktop as a free download.
📦 What’s Inside the Influencer Campaign Dashboard in Power BI
The .pixy file ships with five interactive report pages. All visuals are powered by a single data model you can extend at will.
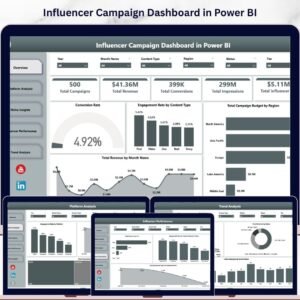
1. Overview Page — Five KPI cards (Total Campaigns, Total Revenue, Total Conversions, Total Impressions, Total Influencer Fee) plus four visuals: Conversion Rate, Engagement Rate by Content Type, Total Campaign Budget by Region, and Total Revenue by Month Name. Multiple slicers above the visuals filter the entire page.
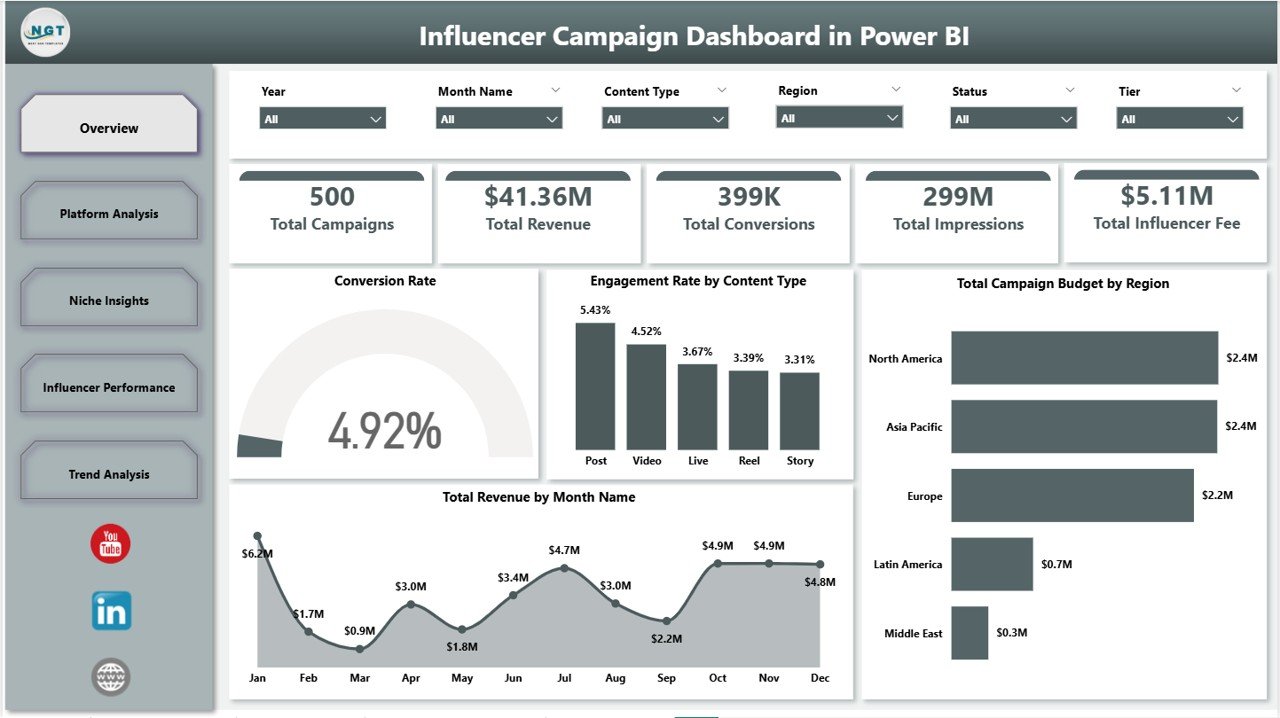
Influencer Campaign Dashboard in Power BI
2. Platform Analysis — Three visuals: Engagement Rate by Platform, Conversion Rate by Platform, and Total Impressions by Platform. Spot which platforms drive the highest reach versus which ones convert — a critical signal for next-quarter budget allocation.
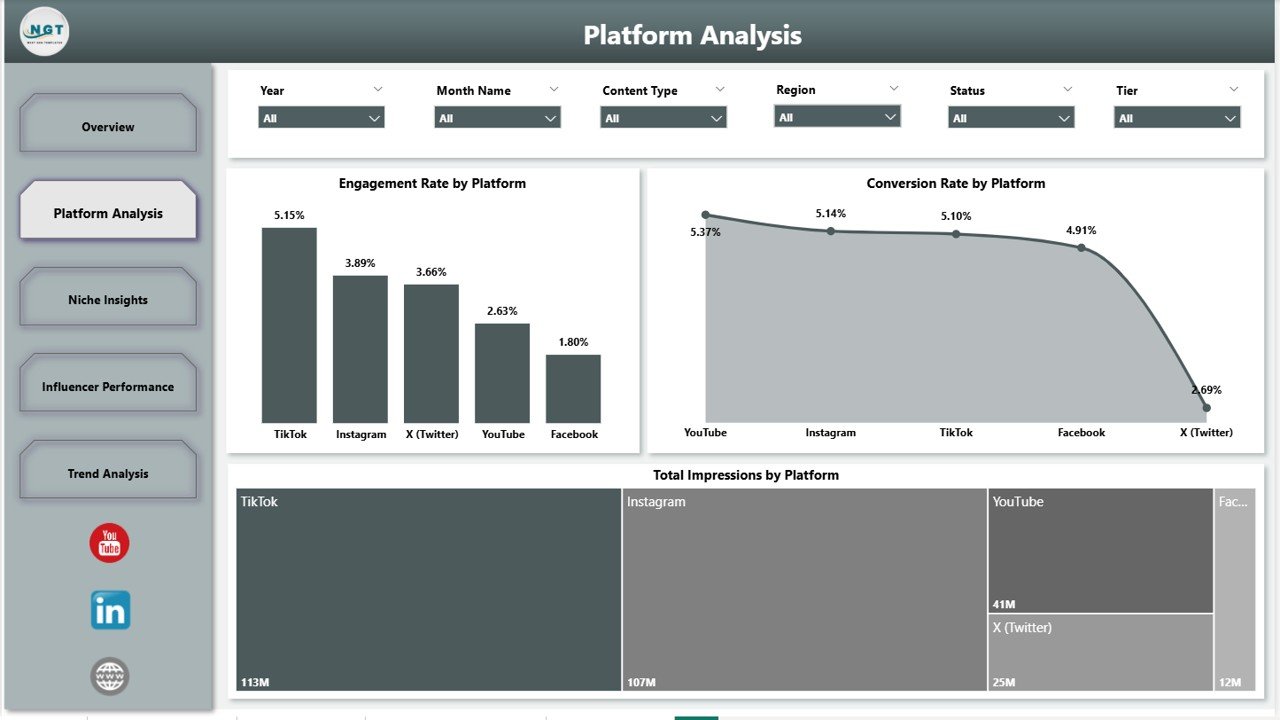
Platform Analysis
3. Niche Insights — Three visuals: Total Conversions by Niche, Total Revenue by Niche, and ROI by Niche. Identify which verticals (beauty, fitness, fintech, gaming, etc.) deliver the highest revenue per dollar spent on influencer fees.
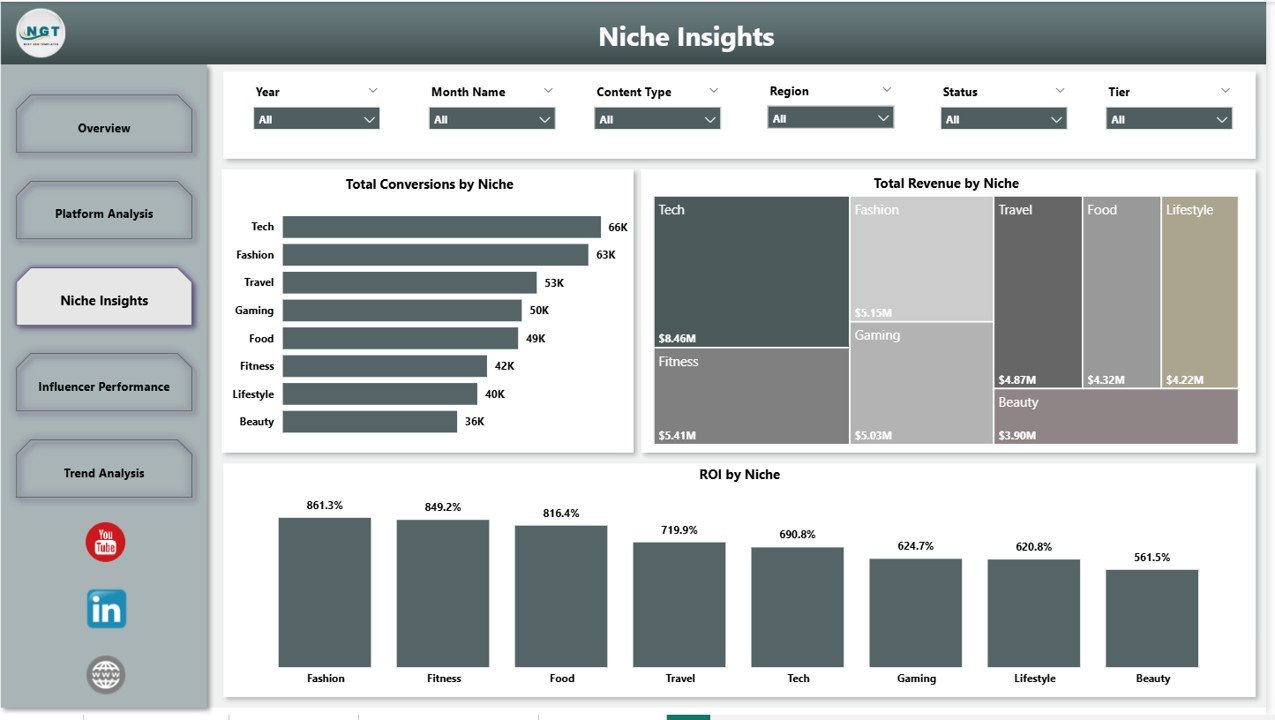
Niche Insights
4. Influencer Performance — Three visuals: Total Revenue by Tier, Engagement Rate by Top Five Influencer Name, and Total Revenue by Top Five Influencer Name. Decide who to renew at contract end and which tier (nano, micro, mid, macro, mega) earns its fee.
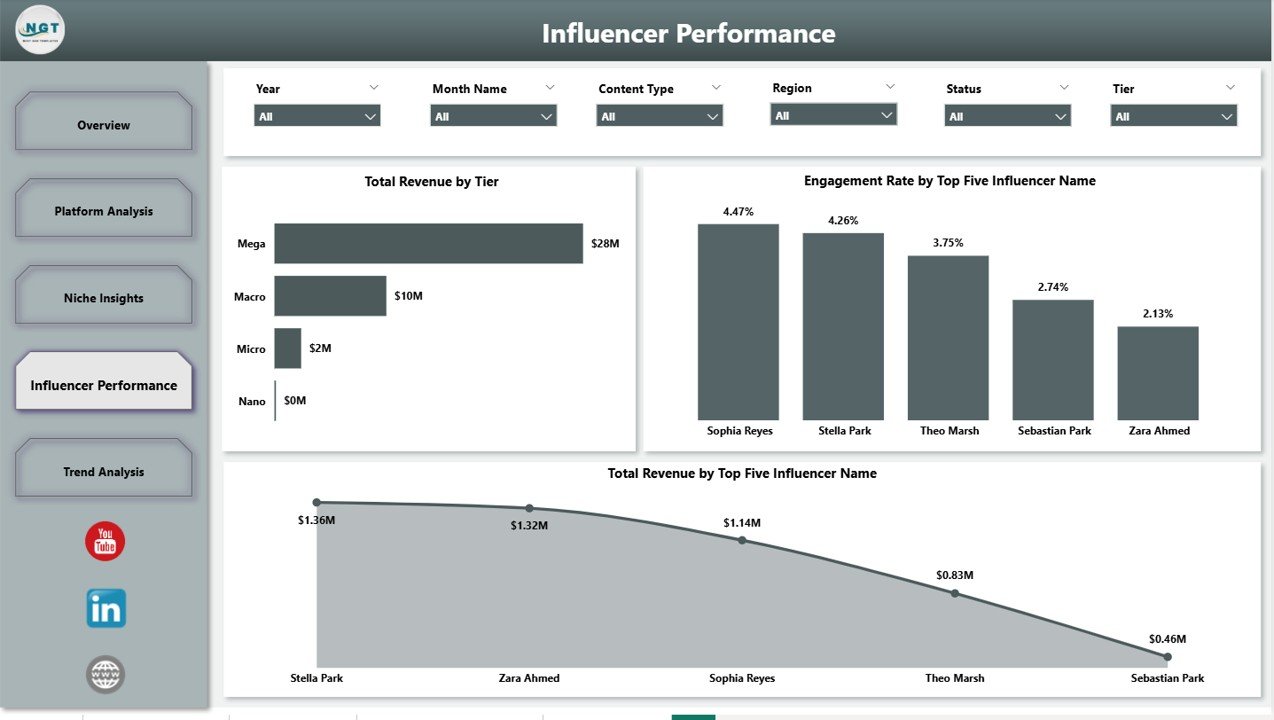
Influencer Performance
5. Trend Analysis — Three visuals: Total Impressions by Region, Total Revenue by Status, and Total Campaigns by Month Name. Use it in monthly business reviews to spot seasonality and forecast next-quarter spend.
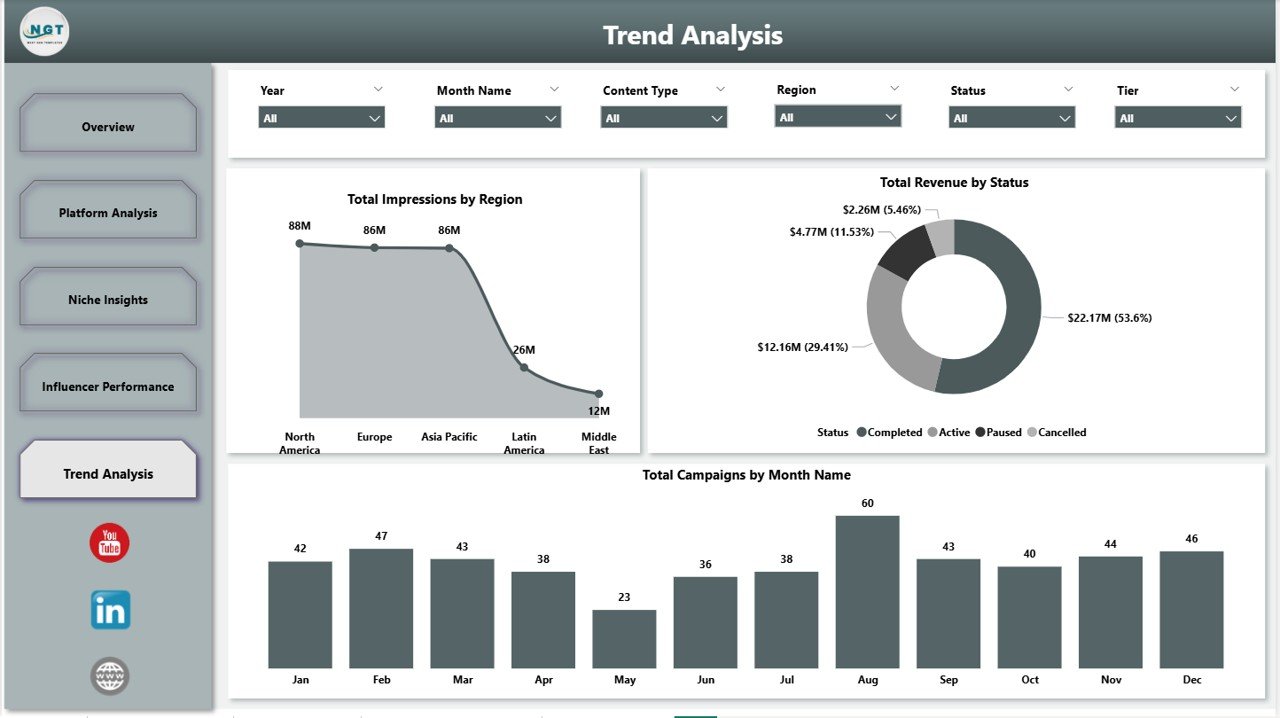
Trend Analysis
📊 Influencer Campaign Dashboard in Power BI vs. Tableau / Qlik vs. Aspire / GRIN / Modash — Where This Fits
| Feature | Influencer Campaign Dashboard in Power BI | Tableau / Qlik Sense | Aspire / GRIN / Modash |
|---|---|---|---|
| Cost | $17.99 one-time | $70–$115 / user / month | $200–1000+ / month |
| Platform | Power BI Desktop (free) | Requires paid license | Cloud SaaS |
| Setup time | Under 10 minutes | Days to weeks | 1–3 weeks (CSM-led) |
| Influencer-specific KPIs | ✅ 5 cards + 16 visuals | Build from scratch | ✅ Included |
| Customizable visuals | ✅ Full Power BI access | ✅ Yes | ⚠️ Vendor-locked |
| Tier & niche analysis | ✅ Built-in pages | Manual build required | ✅ Partial |
| No subscription | ✅ One-time | ❌ Monthly required | ❌ Annual contract |
| Year-1 cost (5 users) | $17.99 total | $4,200–$6,900 | $2,400–$60,000+ |
For brand and agency teams that want enterprise-grade campaign analytics without the enterprise price tag, the Influencer Campaign Dashboard in Power BI sits in the sweet spot.
👥 Who This Template Is For — and Who It’s Not For
✅ This template is built for:
- In-house brand marketers running 5–200 influencer campaigns per quarter who need a single ROI view.
- Boutique influencer agencies delivering monthly client reports without paying for enterprise SaaS.
- DTC and e-commerce teams already standardizing on Power BI for marketing analytics.
- Solo founders and consultants priced out of $200+/month influencer marketing platforms.
❌ This template is NOT for:
- Teams that need automatic creator discovery, outreach, or contract signing — those are SaaS-only features.
- Anyone who refuses to open Power BI Desktop or learn basic data connections.
- Teams requiring real-time API integrations with TikTok, Instagram, or YouTube data feeds.
⚙️ How to Use the Influencer Campaign Dashboard in Power BI
- Download the .pbix file and open it in Power BI Desktop (free from Microsoft).
- Connect your campaign data — replace the sample data source with your Excel, CSV, or database connection.
- Click Refresh on the Home ribbon — every visual, KPI card, and slicer updates automatically.
- Use the slicers at the top of each page to filter by platform, region, tier, niche, content type, or status.
- Publish to Power BI Service if you have a Pro license, or export pages as PDF for monthly client reports.
- Save snapshots monthly to compare year-over-year performance.
💼 Real-World Use Cases
Mia runs influencer marketing at a 40-person beauty DTC brand. Every Friday she pulls campaign data from her creator platform export and Shopify revenue feed, refreshes the .pbix, and presents the Overview page in the Monday standup — saving her team $600/month in SaaS fees and locking down a single source of truth for ROI.
Daniel manages a boutique influencer agency with eight brand clients. He duplicates the dashboard for each client, plugs in their campaign data, and ships a monthly Power BI report. What used to take half a day in PowerPoint now takes 45 minutes — and the Influencer Performance page makes contract-renewal calls obvious.
Priya is a solo SaaS founder running her first 12 creator partnerships. Instead of $300/month for a dedicated SaaS tool, she paid $17.99 once and uses the Tier and Niche pages to figure out where to invest her next $10K in influencer spend.
❓ Frequently Asked Questions
What KPIs does the Influencer Campaign Dashboard in Power BI track?
The Influencer Campaign Dashboard in Power BI tracks 5 primary KPIs — Total Campaigns, Total Revenue, Total Conversions, Total Impressions, and Total Influencer Fee — plus engagement rate, conversion rate, and ROI across 16 visuals on Platform, Niche, Influencer, and Trend pages.
Do I need a paid Power BI license to use this dashboard?
No paid license is required. The Influencer Campaign Dashboard in Power BI runs on Power BI Desktop, which Microsoft offers as a free download. You only need Power BI Pro or Premium if you want to publish and share reports through the Power BI Service cloud.
How long does setup take?
Setup takes under 10 minutes. Open the .pbix in Power BI Desktop, point the data model at your campaign source (Excel, CSV, SQL, or any connector), click Refresh, and all five pages and 16 visuals update automatically across the report.
How does this compare to Aspire, GRIN, or Modash?
Aspire, GRIN, and Modash cost $200–1000+ per month and add creator discovery, outreach, and contracts. The Influencer Campaign Dashboard in Power BI is a one-time $17.99 purchase focused purely on campaign analytics — the same KPI and ROI views, with zero recurring cost.
Can I add my own visuals or measures?
Yes. The Influencer Campaign Dashboard in Power BI is fully editable. Add new DAX measures, build extra visuals on any report page, rename KPI cards, swap brand colors, and extend the data model with new metric columns — the file is a standard .pbix with full Power BI access.
Does it work with Excel data?
Yes. The Influencer Campaign Dashboard in Power BI connects to Excel files (.xlsx) as a primary source. You can also wire it to CSVs, SharePoint lists, SQL databases, or any of the 100+ data connectors Power BI supports out of the box.
What if I prefer Excel or Google Sheets instead?
The same dashboard is also available as the Influencer Campaign Dashboard in Excel and Influencer Campaign Dashboard in Google Sheets. The KPI structure and pages match — pick the platform your team already uses.
👤 About the Author
Built by PK — Microsoft Certified Professional with 15+ years of Excel, Google Sheets, and Power BI experience. Founder of NextGenTemplates, reaching 300K+ subscribers across YouTube channels (@PK-AnExcelExpert, @NextGenTemplates, @NeoTechNavigators). Every template is hand-built and tested before release.
🔗 Explore Related Templates
Also available as: Influencer Campaign Dashboard in Excel · Influencer Campaign Dashboard in Google Sheets
- Multi-Platform Social Media Calendar in Excel — the planning companion to this analytics dashboard.
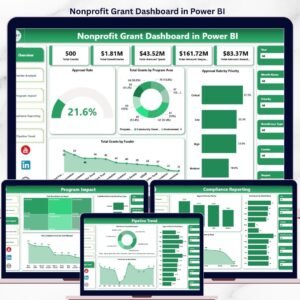
- Nonprofit Grant Dashboard in Power BI — same .pbix architecture for nonprofit grant tracking.
Browse more Power BI Dashboards in our library.
📖 Click here to read the Detailed Blog Post
🎥 Visit our YouTube channel for step-by-step video tutorials
👉 YouTube.com/@NextGenTemplates
Watch the step-by-step video tutorial:
YouTube


Reviews
There are no reviews yet.