


Managing parking in offices has always been a logistical challenge. Employees arrive at different times, vehicles vary in type, and demand for limited parking often causes inefficiency, frustration, and wasted time. Without a structured system, organizations risk underutilized spaces, conflicts, and dissatisfied employees.
The Office Parking Utilization Dashboard in Power BI is the perfect solution. Designed as a ready-to-use, interactive, and customizable dashboard, it transforms parking data into visual insights and actionable intelligence. From monitoring daily usage to forecasting future needs, this tool empowers facilities managers, HR teams, and operations leaders to manage parking resources efficiently.
🚗 What Is the Office Parking Utilization Dashboard in Power BI?
It is a data visualization tool built in Microsoft Power BI that consolidates parking utilization data into an easy-to-understand format.
Instead of juggling manual spreadsheets or guesswork, managers can now:
Track occupied vs. vacant spaces in real time.
Identify department-wise utilization.
Monitor overstays and high-category vehicle usage.
Compare monthly trends to forecast demand.
The dashboard connects seamlessly with Excel or other data sources, converting raw data into structured visuals with just a few clicks.
🌟 Key Features of the Dashboard
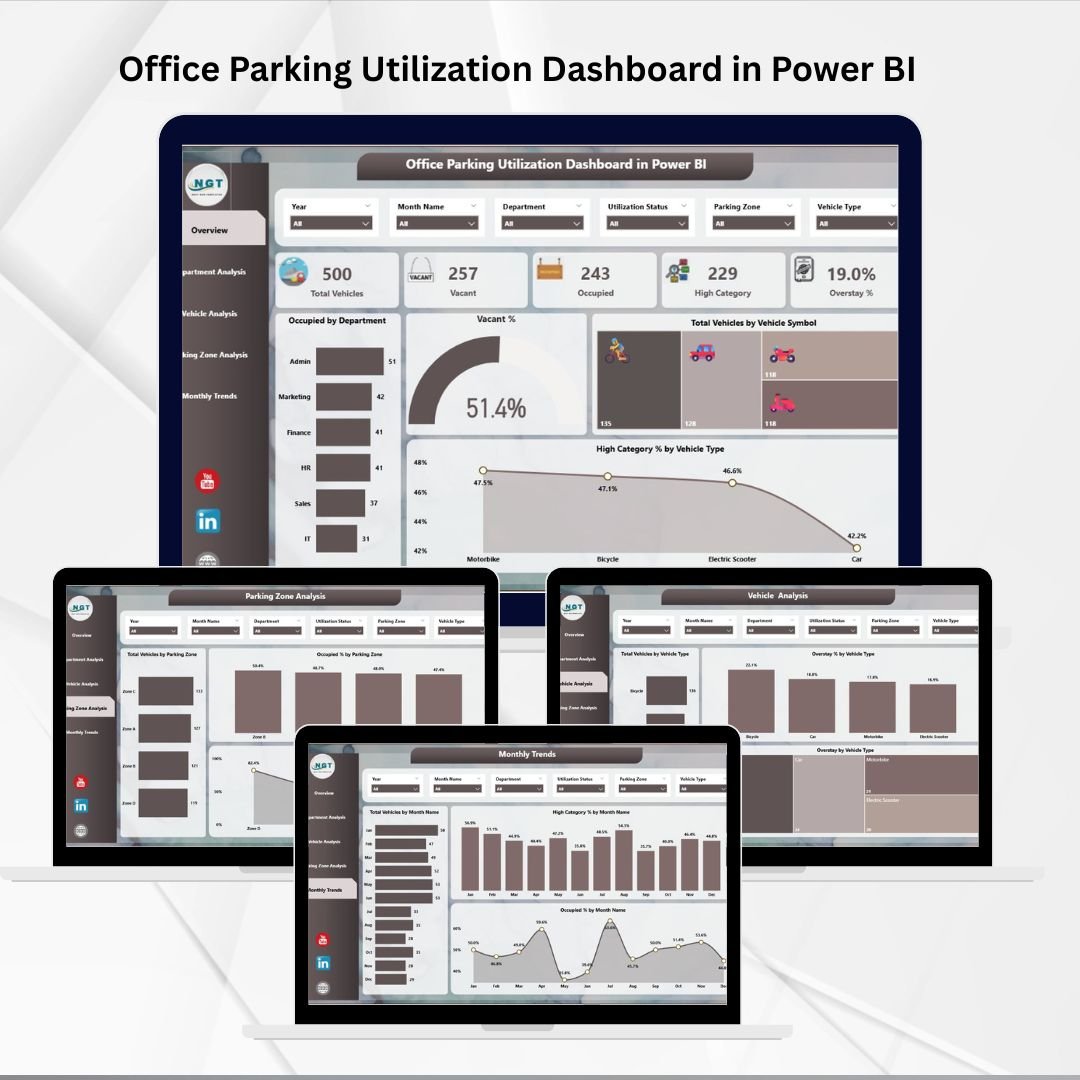
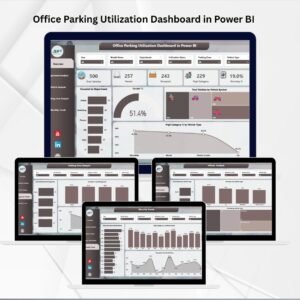
The Office Parking Utilization Dashboard is structured into five analytical pages, each with unique insights:
1. Overview Page
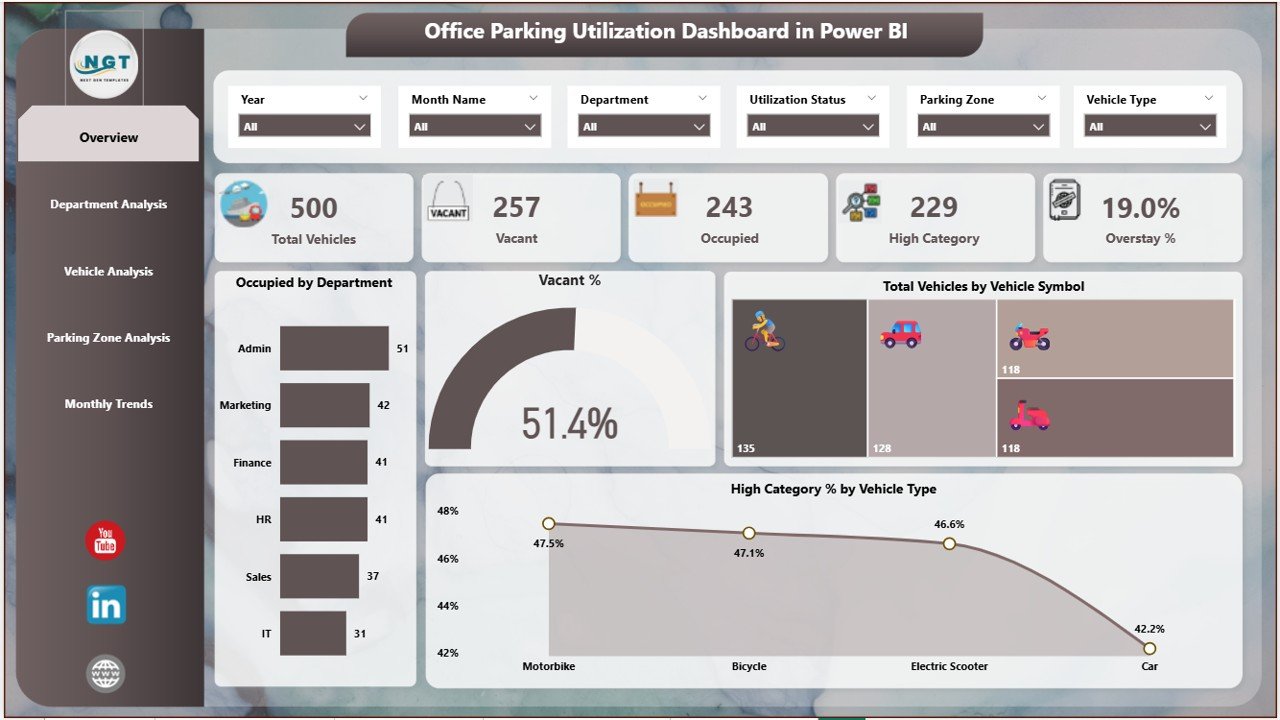
Six slicers for filtering by department, vehicle type, or parking zone.
Five KPI cards showing: total vehicles, occupied %, vacant %, overstays, and high-category utilization.
Four charts for quick insights:
Occupied by Department
Vacant %
Total Vehicles by Vehicle Symbol
High Category % by Vehicle Type
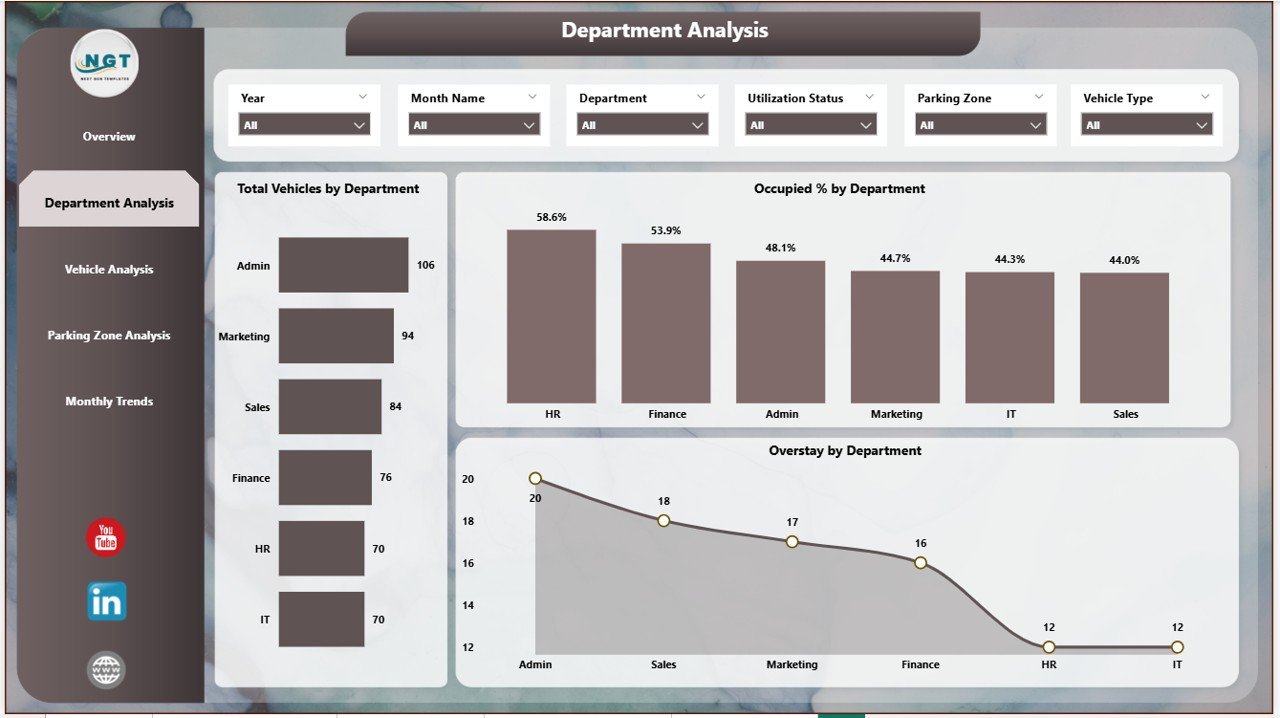
2. Department Analysis Page
Highlights utilization by department.
Charts include:
Total Vehicles by Department
Occupied % by Department
Overstay by Department
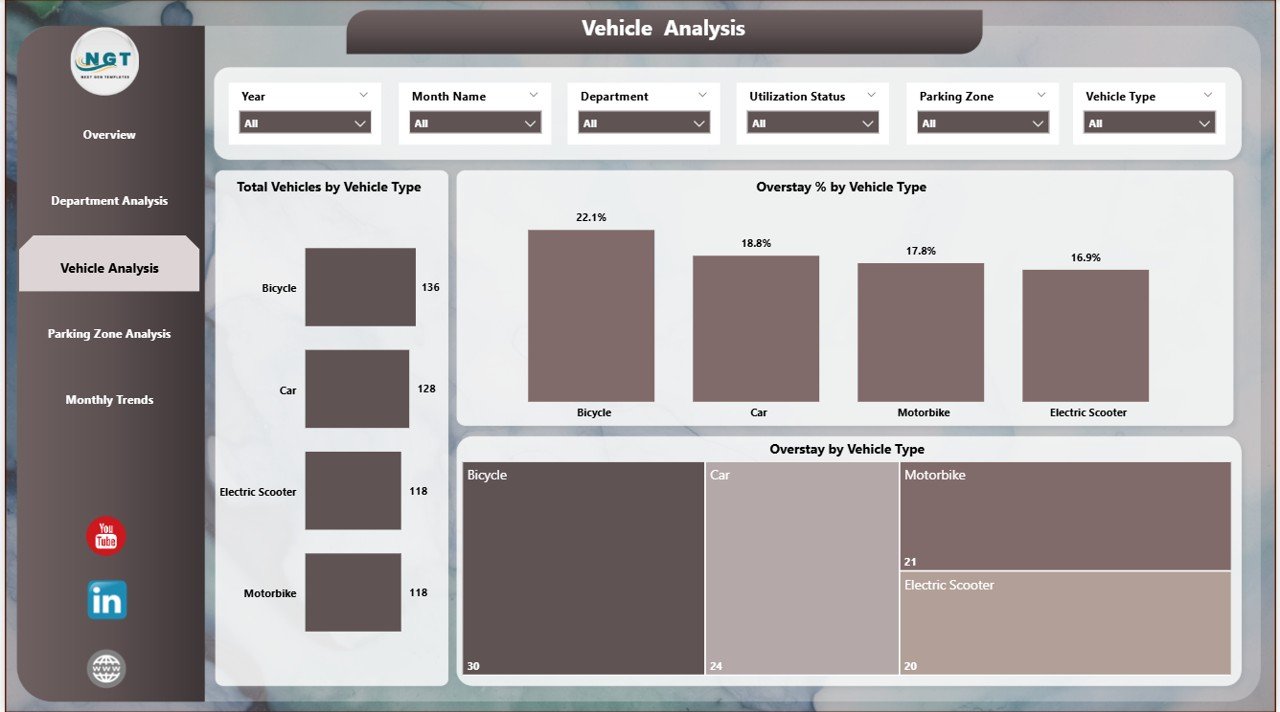
3. Vehicle Analysis Page
Focuses on vehicle-type data.
Charts include:
Total Vehicles by Vehicle Type
Overstay % by Vehicle Type
Overstay by Vehicle Type
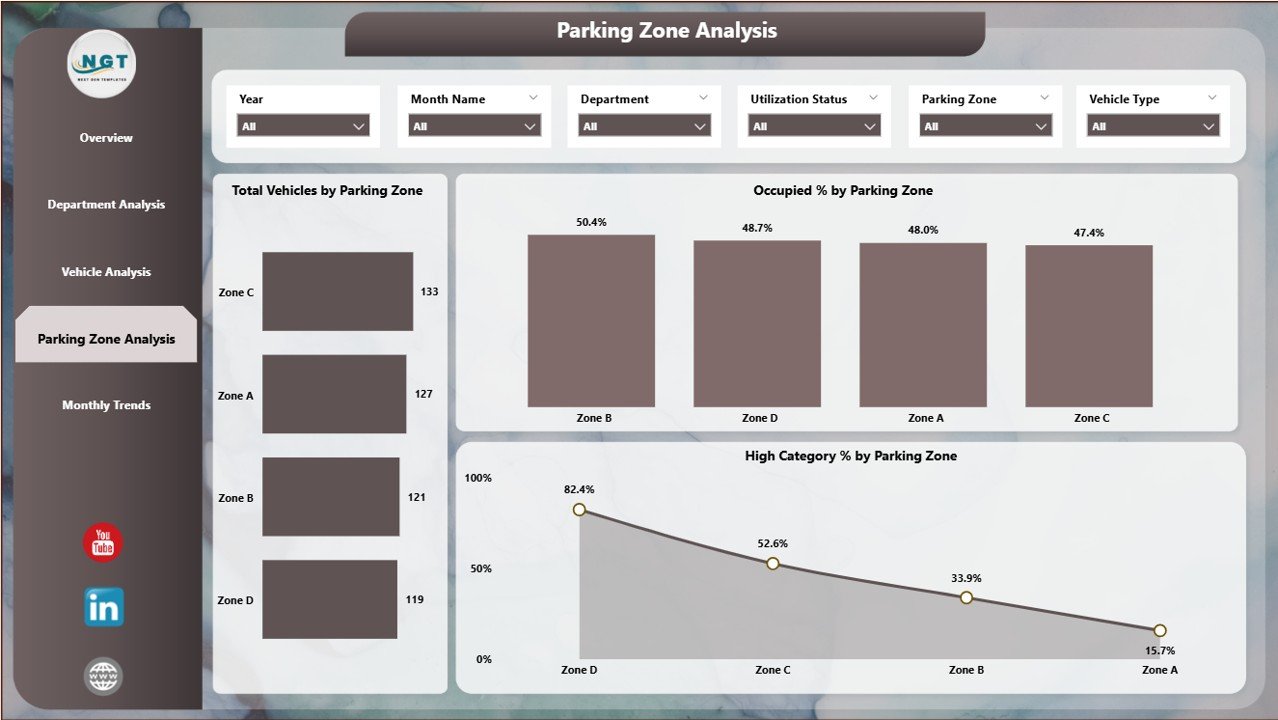
4. Parking Zone Analysis Page
Reveals utilization patterns across zones.
Charts include:
Total Vehicles by Parking Zone
Occupied % by Parking Zone
High Category % by Parking Zone
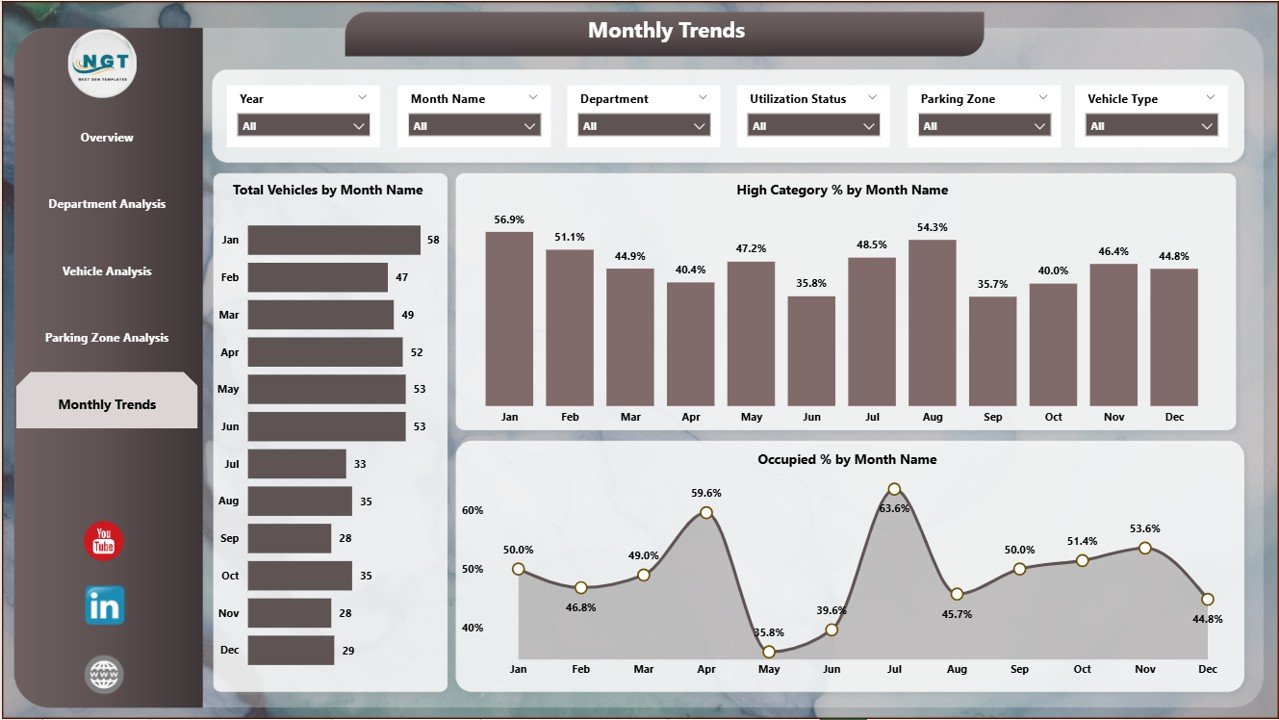
5. Monthly Trends Page
Tracks long-term performance.
Charts include:
Total Vehicles by Month
High Category % by Month
Occupied % by Month
✅ Advantages of the Office Parking Utilization Dashboard
🚀 Real-Time Insights – See updated utilization instantly.
📊 Better Space Management – Optimize slot allocation by department, vehicle type, or zone.
😀 Improved Employee Satisfaction – Reduce conflicts and frustrations.
🛡 Risk & Overstay Management – Track extended stays and enforce policies.
💲 Cost Savings – Maximize current resources before considering expansion.
🌍 Sustainability Support – Monitor EVs, carpooling, or vehicle mix for green initiatives.
🔧 Opportunities for Improvement
While powerful, organizations can enhance the dashboard further with:
IoT sensor integration for live space detection.
Mobile-friendly versions for employees to view slot availability.
Automated alerts for overstays or congestion.
AI-driven forecasting to predict peak periods.
Role-based access for department-specific reporting.
📌 Best Practices for Using the Dashboard
Keep data sources updated regularly.
Use slicers to filter insights by vehicle type, department, or zone.
Monitor overstays closely and enforce policies.
Analyze monthly trends to forecast demand.
Share insights with HR and facilities teams for collaborative improvement.
🎯 How It Supports Decision-Making
This dashboard goes beyond reporting—it enables strategic planning:
Helps HR assign parking quotas fairly.
Supports facilities managers in planning expansions or reallocating zones.
Encourages sustainability by tracking EVs and carpool usage.
Provides leadership with cost insights for infrastructure decisions.
📌 Conclusion
The Office Parking Utilization Dashboard in Power BI is more than just a monitoring tool—it is a strategic solution for smarter parking management. With real-time insights, interactive visuals, and detailed analytics, organizations can reduce inefficiencies, improve employee satisfaction, and optimize resource use.
Visit our YouTube channel to learn step-by-step video tutorials
🔗 Click here to read the Detailed blog post
Watch the step-by-step video tutorial:
Compatibility and Requirements
- Opens in Power BI Desktop, which is free from Microsoft. See Get Power BI Desktop.
- Load your parking records from Excel or another data source, then refresh the report.
Frequently Asked Questions
Which pages are in the dashboard?
There are five pages: Overview, Department Analysis, Vehicle Analysis, Parking Zone Analysis and Monthly Trends.
What do the KPI cards show?
Five cards show total vehicles, occupied %, vacant %, overstays and high-category utilization.
Can I filter by department or parking zone?
Yes. The Overview page has six slicers, including department, vehicle type and parking zone.
Who is this dashboard for?
Facilities managers, HR teams and operations leaders who plan parking space, quotas and zone allocation.
Can I track overstays?
Yes. Overstays appear as a KPI card and in charts by department and vehicle type.
Related Parking and Facility Templates
- Office Parking Utilization Dashboard in Excel: the same dashboard built in Excel
- Office Parking Utilization Report in Excel: a printable parking report
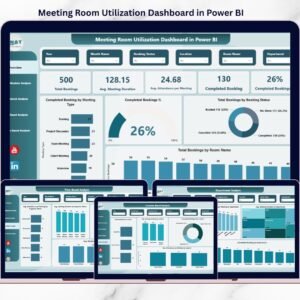
- Meeting Room Utilization Dashboard in Power BI: tracks how office rooms are used
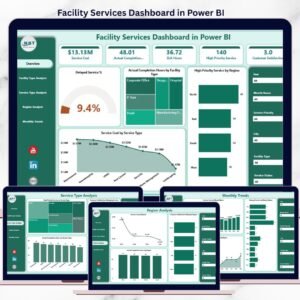
- Facility Services Dashboard in Power BI: covers wider facility operations
- Power BI Dashboard Mega Collection: 15 Power BI templates in one bundle
Browse all Power BI dashboards or the Power BI templates.






























Reviews
There are no reviews yet.