Managing workplace incidents should not feel chaotic, slow, or reactive. Yet many organizations still depend on emails, paper forms, and scattered spreadsheets to track incidents. This results in delayed responses, hidden safety risks, and compliance challenges.
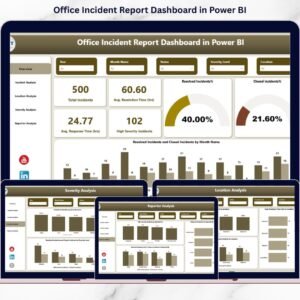
The Office Incident Report Dashboard in Power BI is a ready-to-use, professional analytics solution designed to convert raw incident data into clear, actionable safety insights. Instead of guessing where risks exist, you gain instant visibility into incidents, response times, severity levels, and location-wise trends — all in one interactive dashboard.
This dashboard empowers safety teams and leadership to act faster, reduce risks, and build a safer workplace culture using data-driven decisions.
🚀 Key Features of Office Incident Report Dashboard in Power BI
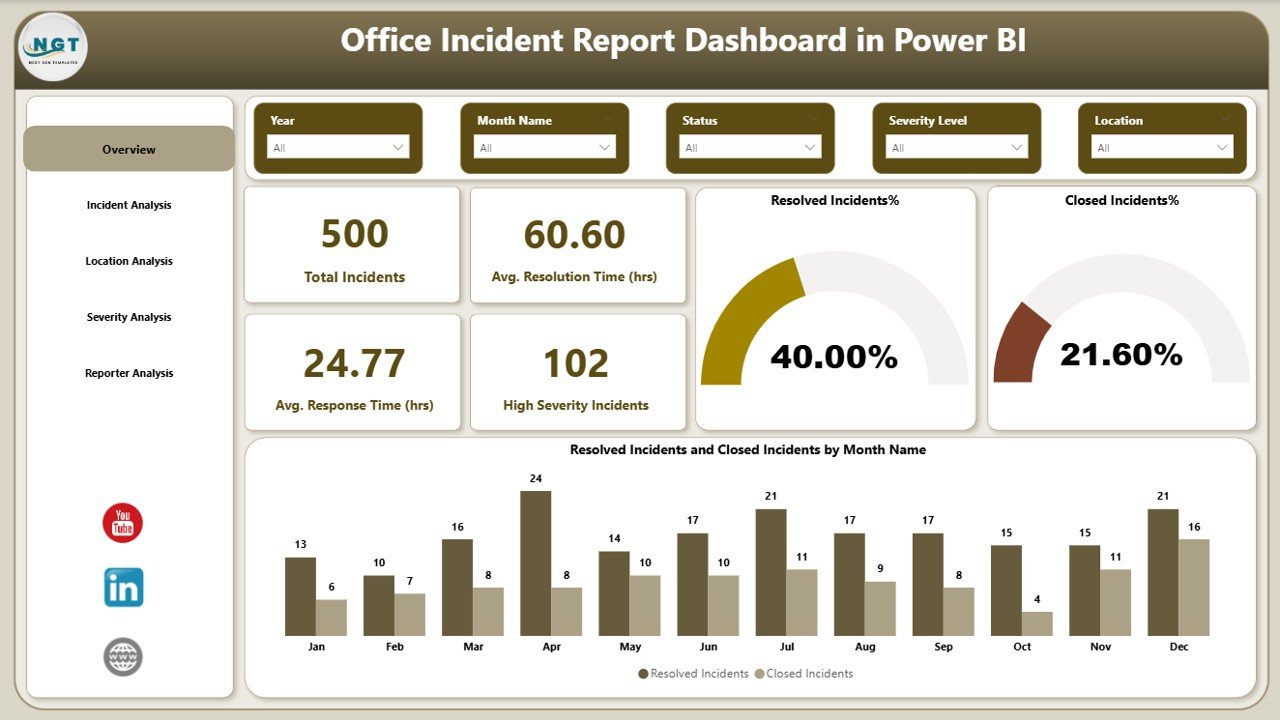
✅ Interactive KPI Cards to track total incidents, response time, resolution time, and high-severity cases
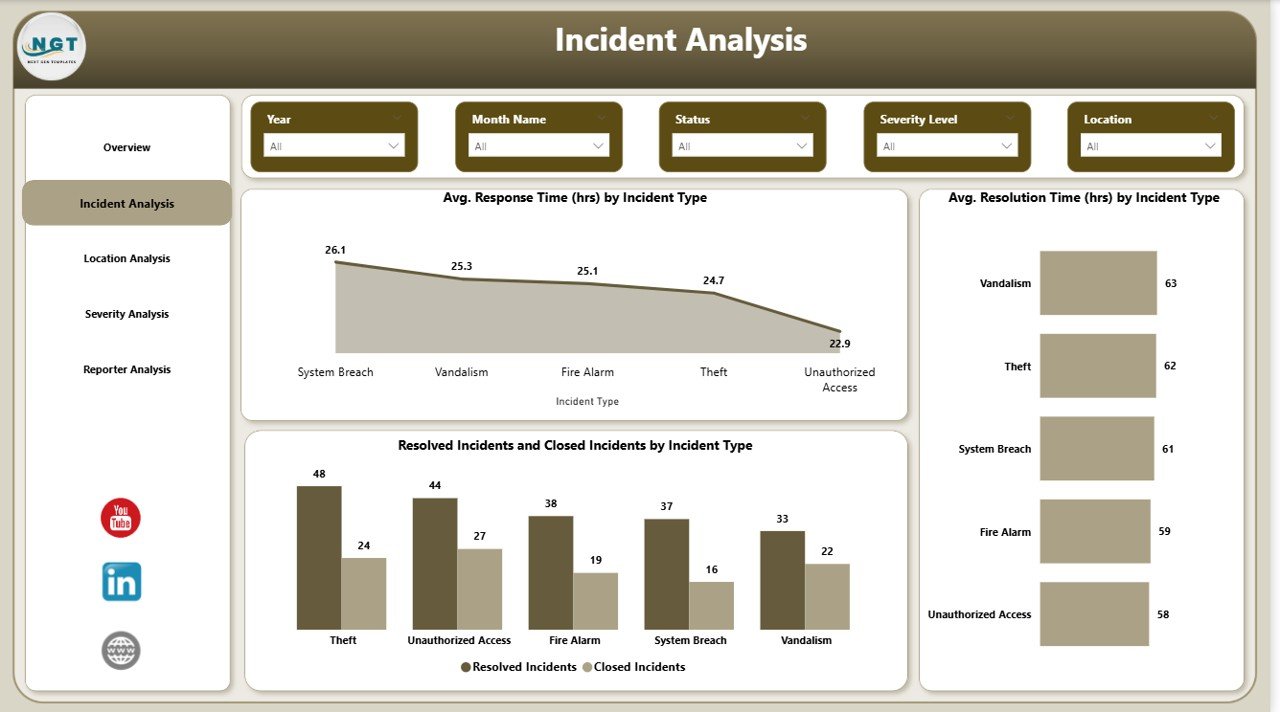
✅ Incident Type Analysis to identify problem areas requiring immediate attention
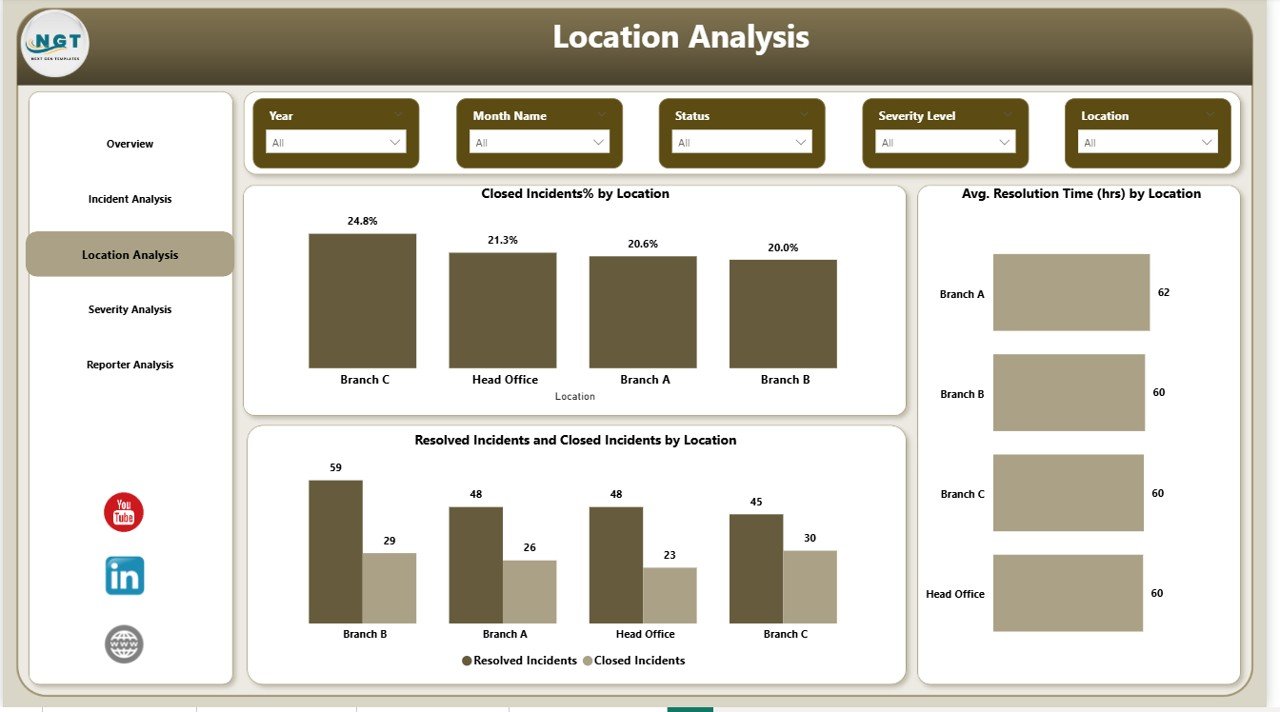
✅ Location-Wise Risk Analysis to compare safety performance across offices
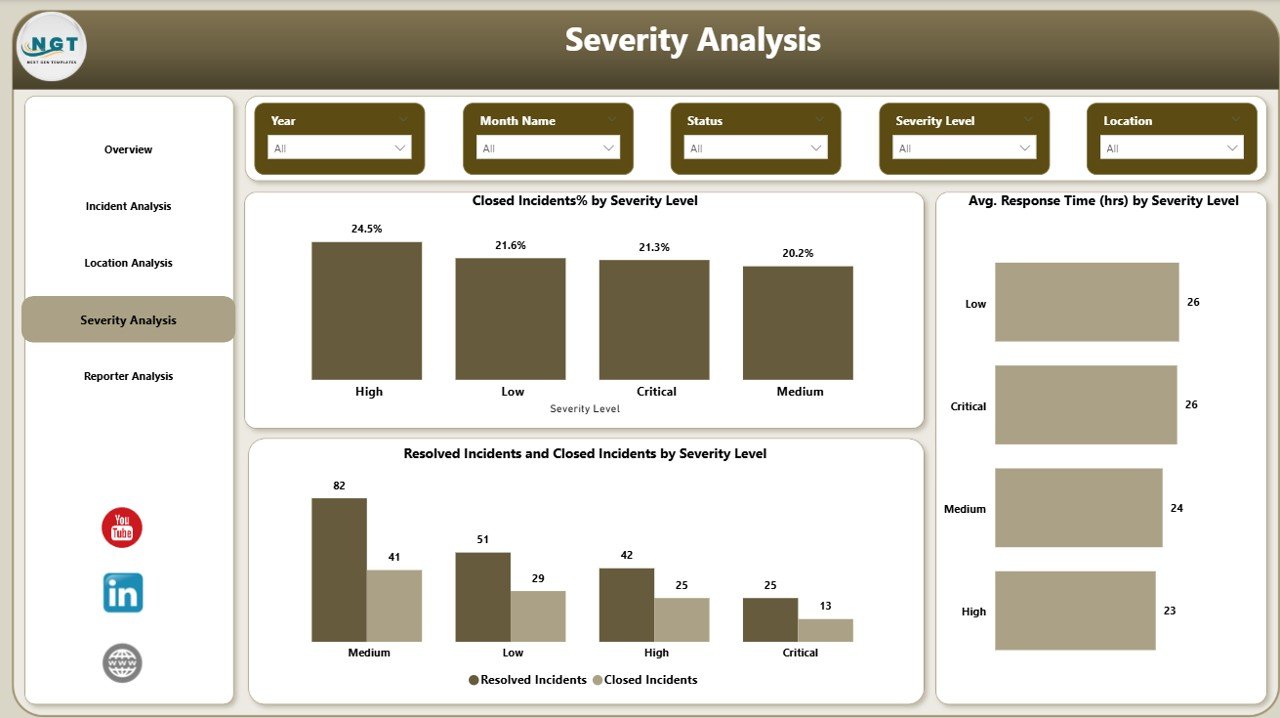
✅ Severity-Based Insights to prioritize critical incidents effectively
✅ Monthly Trend Analysis to monitor long-term safety improvements
✅ Dynamic Slicers & Filters for deep, flexible analysis
✅ Clean & Professional Visuals built for leadership-level reporting
✅ Automated Calculations that update instantly with new data
📂 What’s Inside the Office Incident Report Dashboard
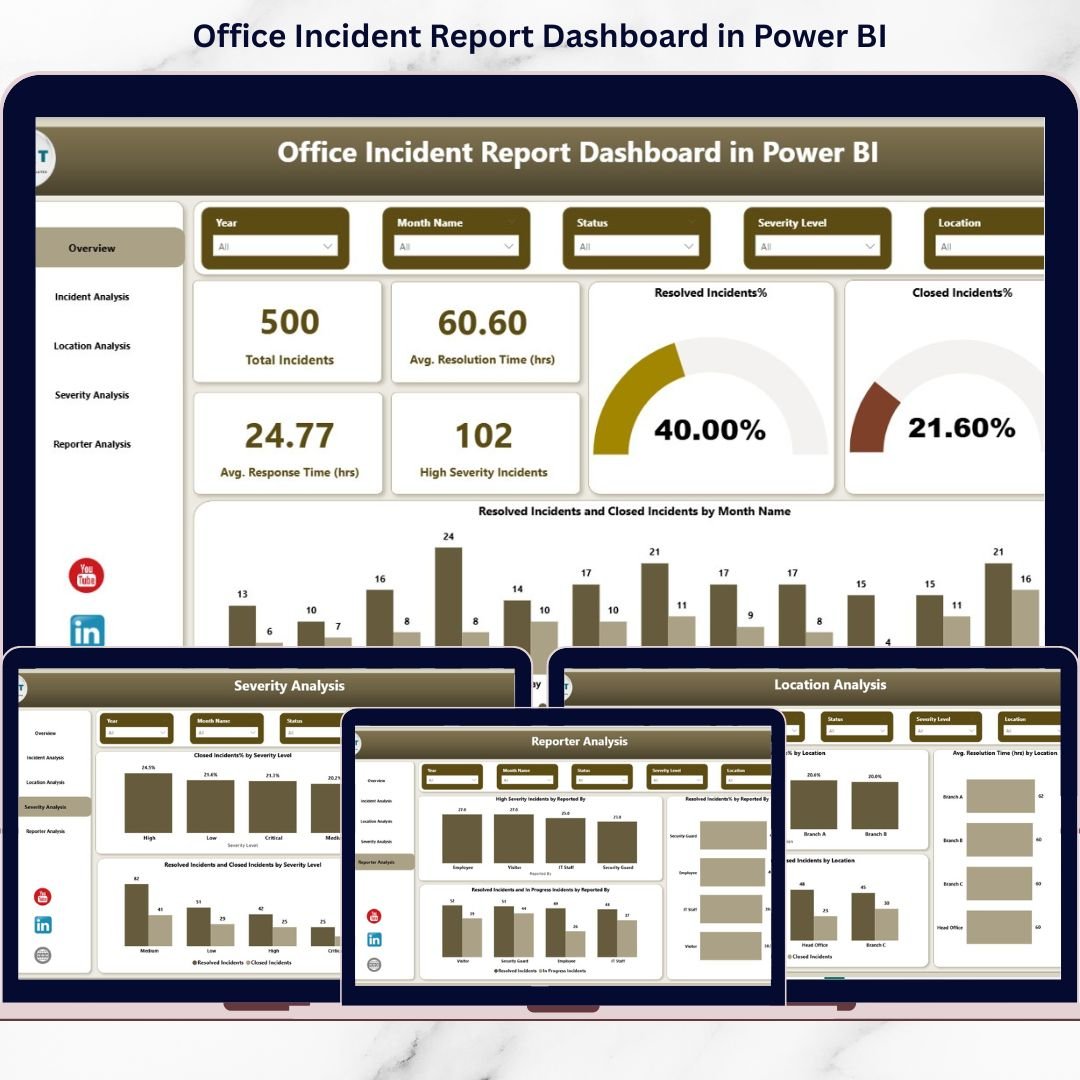
📌 Overview Page
Get a high-level snapshot of workplace safety with KPI cards and slicers for time, location, and severity.
📌 Incident Analysis Page
Analyze response and resolution time by incident type to uncover process gaps.
📌 Location Analysis Page
Compare closed incidents, resolution efficiency, and risk levels across office locations.
📌 Severity Analysis Page
Ensure high-severity incidents receive immediate attention and faster escalation.
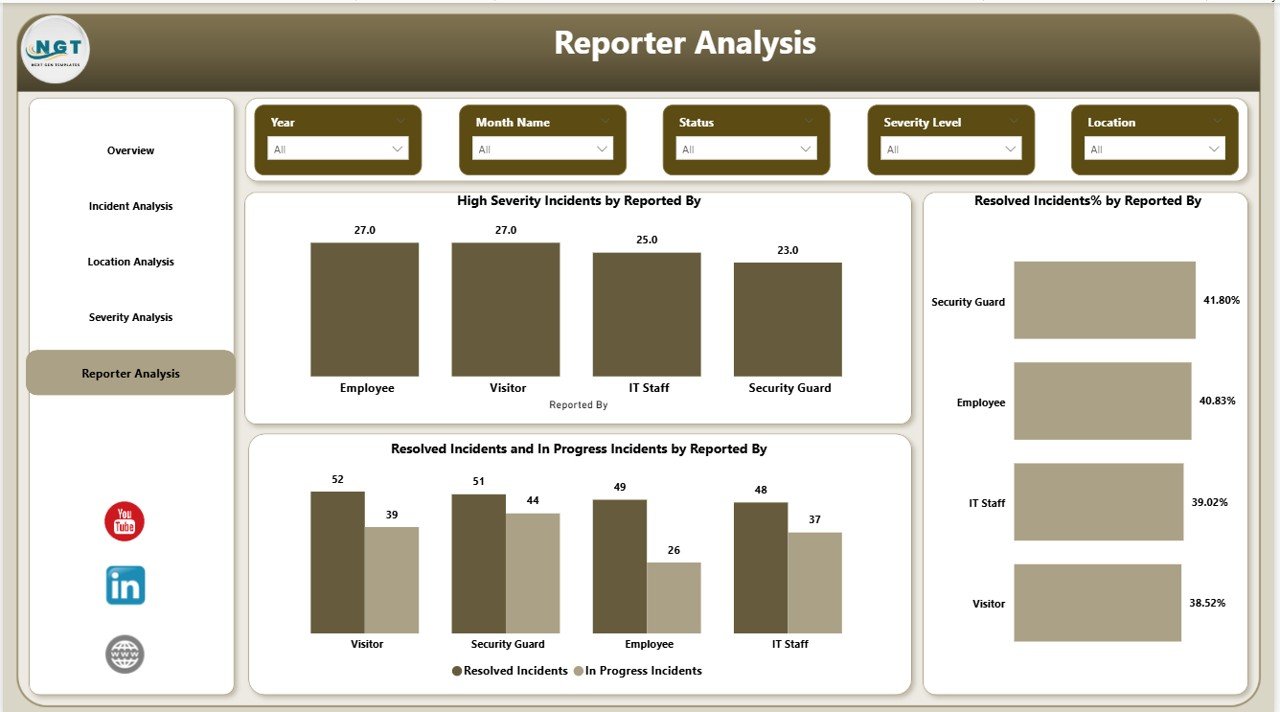
📌 Monthly Trends Page
Track incident patterns, reporting behavior, and safety improvements over time.
Each page is designed to answer real business safety questions, not just show charts.
🛠️ How to Use the Office Incident Report Dashboard
1️⃣ Enter or connect your structured incident data (Excel or other sources)
2️⃣ Refresh the Power BI dashboard
3️⃣ Use slicers to filter by date, location, severity, or department
4️⃣ Monitor KPIs and visual trends instantly
5️⃣ Identify risks, delays, and high-impact incident types
6️⃣ Take corrective actions backed by real data
No complex setup. No manual calculations. Just clear insights in a few clicks.
🎯 Who Can Benefit from This Office Incident Report Dashboard
👷 Safety Officers – Identify risks early and reduce workplace incidents
🧑💼 HR Teams – Improve employee safety and reporting transparency
🏢 Facility Managers – Track location-wise safety performance
📋 Compliance Managers – Simplify audits and regulatory reporting
📊 Operations Teams – Improve response and resolution workflows
👔 Senior Management – Make confident, data-driven safety decisions
Whether you manage one office or multiple locations, this dashboard scales effortlessly.
Click here to read the Detailed blog post
Watch the step-by-step video tutorial: