



Clear and effective communication is the backbone of every successful organization. Miscommunication or delays in response can cost time, money, and productivity. That’s why the Office Communication Dashboard in Excel was created—to provide a ready-to-use, interactive solution that helps you track messages, analyze response times, and monitor communication trends across your teams.
This Excel-based tool consolidates all communication data in one place, offering visual insights into key metrics such as total messages, urgency levels, departmental interactions, and channel effectiveness. Whether you are a manager, HR leader, or team lead, this dashboard will give you actionable insights to improve workplace collaboration and accountability.

✨ Key Features of the Office Communication Dashboard
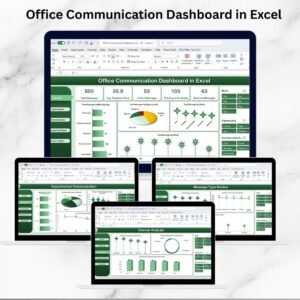
Overview Sheet: High-level cards and charts for total messages, response times, critical messages, and monthly trends.
Departmental Communication Insights: Track responsiveness and bottlenecks between departments.
Channel Analysis: Measure communication efficiency across Email, Chat, Calls, or other channels.
Message Type Review: Monitor critical, pending, and escalated messages by type.
Sender Insights: Evaluate individual employee communication performance.
Data Sheet Automation: Input once, and the entire dashboard updates instantly.
Customizable Setup: Add new message types, departments, or communication channels as per your organization’s needs.
Scalable: Handles small teams to large enterprises with ease using Excel’s pivot-powered structure.
📂 What’s Inside the Dashboard
The Office Communication Dashboard is structured into six worksheet tabs, each focusing on specific communication aspects:
Overview Sheet Tab
Cards for Total Messages, Avg. Response Time, Critical Messages, Pending/Escalated Messages, and Resolved Messages
Charts for Message Type, Urgency, Status, and Monthly Trends
Departmental Communication
Compare departments on response times, escalations, and critical message handling
Identify which teams respond efficiently and where bottlenecks occur
Channel Analysis
Charts for Total Messages, Critical Messages, and Avg. Response Time by Channel
Optimize communication channels for urgent or high-priority tasks
Message Type Review
Monitor communication performance by message type
Spot delays or recurring escalation patterns
Sender Insights
Individual-level breakdown of total messages, critical communications, and pending responses
Build accountability at the employee level
Data Sheet Tab
Centralized input area for Sender, Recipient, Message Type, Channel, Urgency, Status, and Response Time
Updates flow automatically into all dashboards
🛠️ How to Use the Office Communication Dashboard
Download and open the Excel file.
Input your messaging data into the Data Sheet.
Switch to the Overview Sheet for a big-picture summary.
Use Departmental, Channel, and Message Type tabs for deeper analysis.
Leverage the Sender Insights sheet for employee-level performance.
Refresh data regularly to ensure accuracy and real-time monitoring.
👥 Who Can Benefit from This Dashboard
Team Leaders – Monitor responsiveness and accountability across employees.
HR & Operations Teams – Track inter-departmental communication efficiency.
Business Leaders – Gain visibility into organizational communication bottlenecks.
Small Businesses – Cost-effective tool to ensure efficient communication without expensive software.
Large Enterprises – Manage high-volume message flows across multiple departments.
✅ Advantages of Using the Dashboard
Centralized Insights – All communication data in one structured file.
Improved Response Times – Spot delays and implement workflow changes.
Channel Effectiveness – Optimize the use of chat, email, or calls.
Departmental Transparency – Hold teams accountable with clear trends.
Individual Accountability – Track sender performance easily.
Customizable & Scalable – Works across industries and team sizes.
🔑 Best Practices
Update message records daily or weekly for accurate trends.
Segment analysis by department, channel, or message type.
Focus on critical and escalated messages to minimize risks.
Track monthly response time patterns to improve policies.
Use filters and slicers for quick, actionable insights.
📖 Click here to read the detailed blog post
Watch the step-by-step video Demo:
📺 Visit our YouTube channel for step-by-step video tutorials
Compatibility and Requirements
- Works in Microsoft Excel desktop (Excel 2016 or later, or Microsoft 365).
- The dashboard is built on pivot-powered sheets, so the charts update from the Data Sheet. Microsoft explains how they work in Create a PivotTable to analyze worksheet data.
Frequently Asked Questions
Which sheets are included?
Six sheets: Overview, Departmental Communication, Channel Analysis, Message Type Review, Sender Insights and the Data Sheet.
What do I enter in the Data Sheet?
Enter the sender, recipient, message type, channel, urgency, status and response time for each message. The other sheets update from this data.
Can I compare departments?
Yes. The Departmental Communication sheet compares departments on response times, escalations and critical message handling, so you can see where delays happen.
Can I add my own departments, message types or channels?
Yes. You can add new message types, departments or communication channels to match your organization.
Is there a Google Sheets or Power BI version?
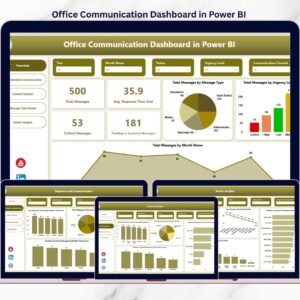
Yes. See the Office Communication Dashboard in Google Sheets and the Office Communication Dashboard in Power BI.
Related Office Templates
- Office Communication Report in Excel: a report view of the same communication data
- Office Communication Dashboard in Google Sheets: the Google Sheets edition
- Office Communication Dashboard in Power BI: the Power BI edition
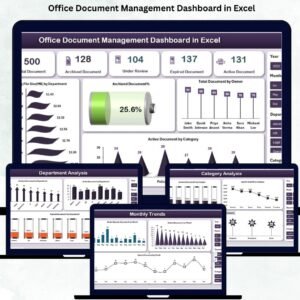
- Office Document Management Dashboard in Excel: another office operations dashboard
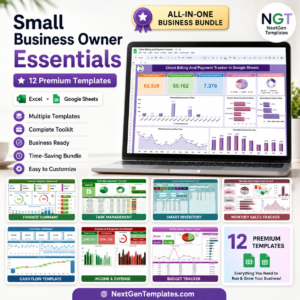
- Small Business Owner Essentials: 12 templates for owners in one download
Browse all Excel dashboards.



























Reviews
There are no reviews yet.