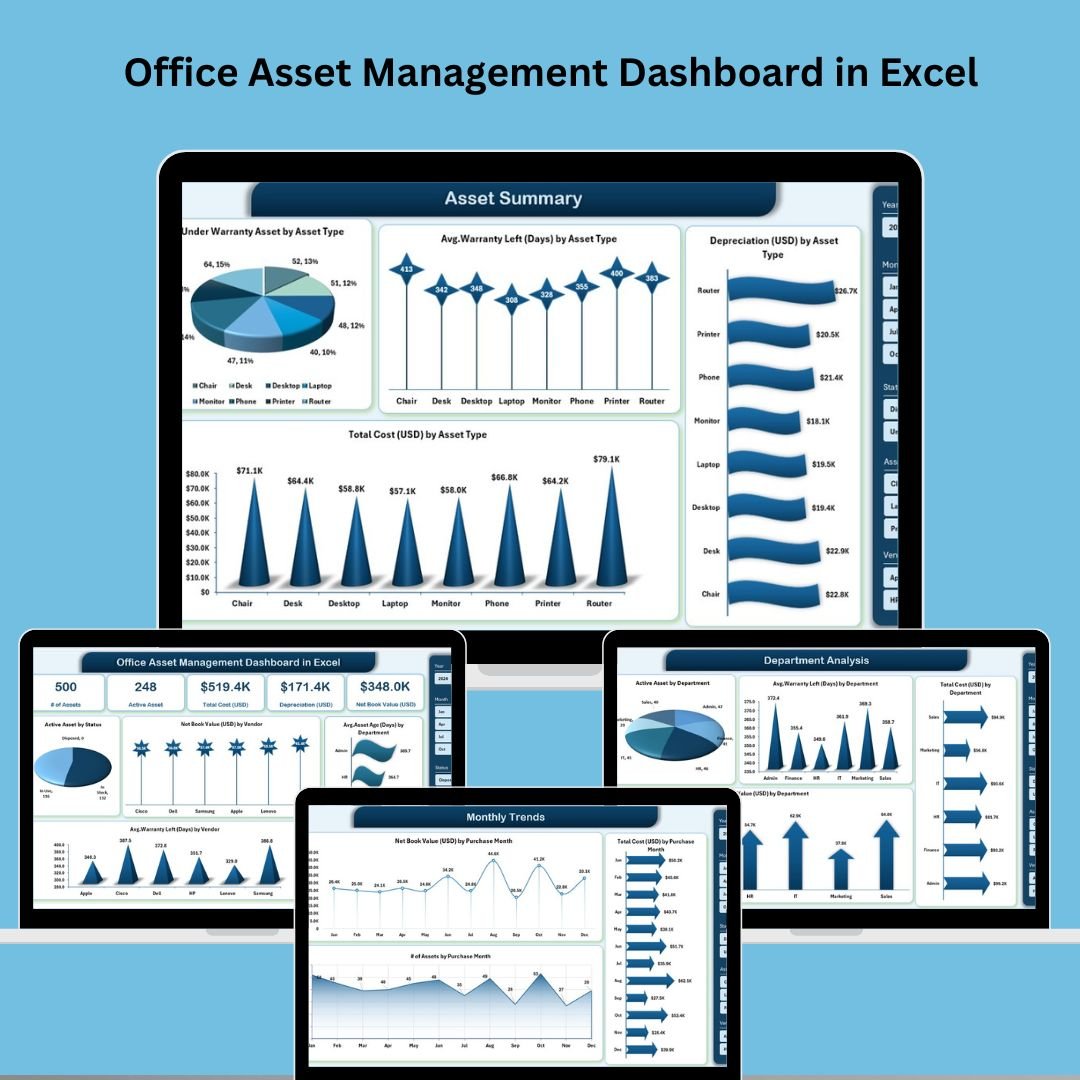
In the modern business landscape, effective asset management is more than just tracking inventory—it’s about making smarter decisions, maximizing ROI, and staying organized. That’s where the Office Asset Management Dashboard in Excel comes in. 📊
This all-in-one Excel dashboard provides your team with powerful visuals and insights into asset lifecycles, depreciation, warranties, and departmental budgets—all without needing complex software or expensive subscriptions. Whether you manage 50 or 5,000 assets, this tool makes your life easier. 💼
🔧 Key Features of the Office Asset Management Dashboard
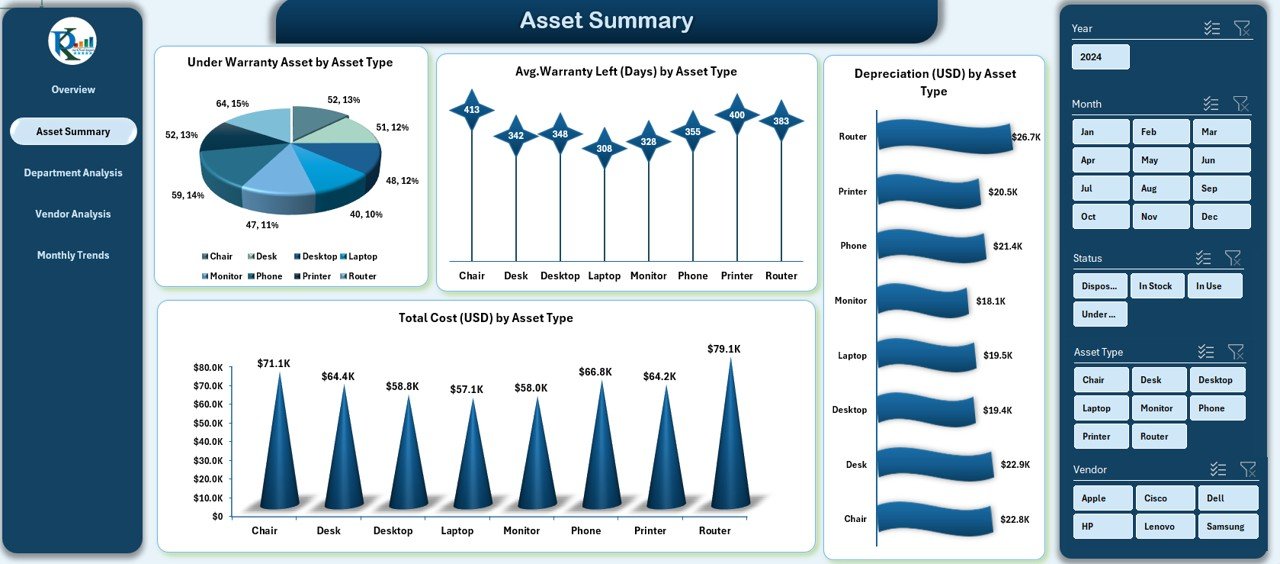
🧭 Page Navigator for Smooth Access
Use the sidebar navigator to instantly jump between:
-
Overview
-
Asset Summary
-
Department Analysis
-
Vendor Analysis
-
Monthly Trends
No scrolling. No confusion. Just instant insights. ⚡
📊 Overview Page – Big Picture in One View
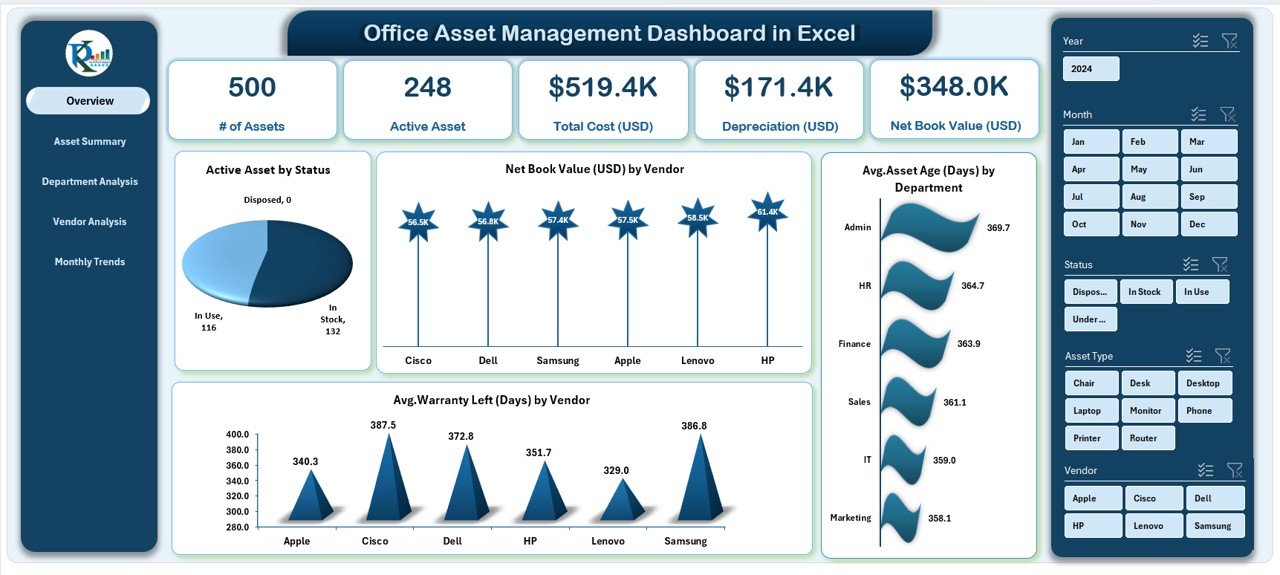
Visualize the most important KPIs using:
-
5 Key Metric Cards (Assets, Cost, Warranty, Depreciation)
-
Charts:
-
Active Assets by Status
-
Net Book Value by Vendor
-
Avg. Asset Age by Department
-
Avg. Warranty Left by Vendor
-
📁 Asset Summary – Centralized Asset Breakdown
Get a macro view of all your office assets:
-
Visuals for asset performance
-
Department-wise and vendor-wise summary metrics
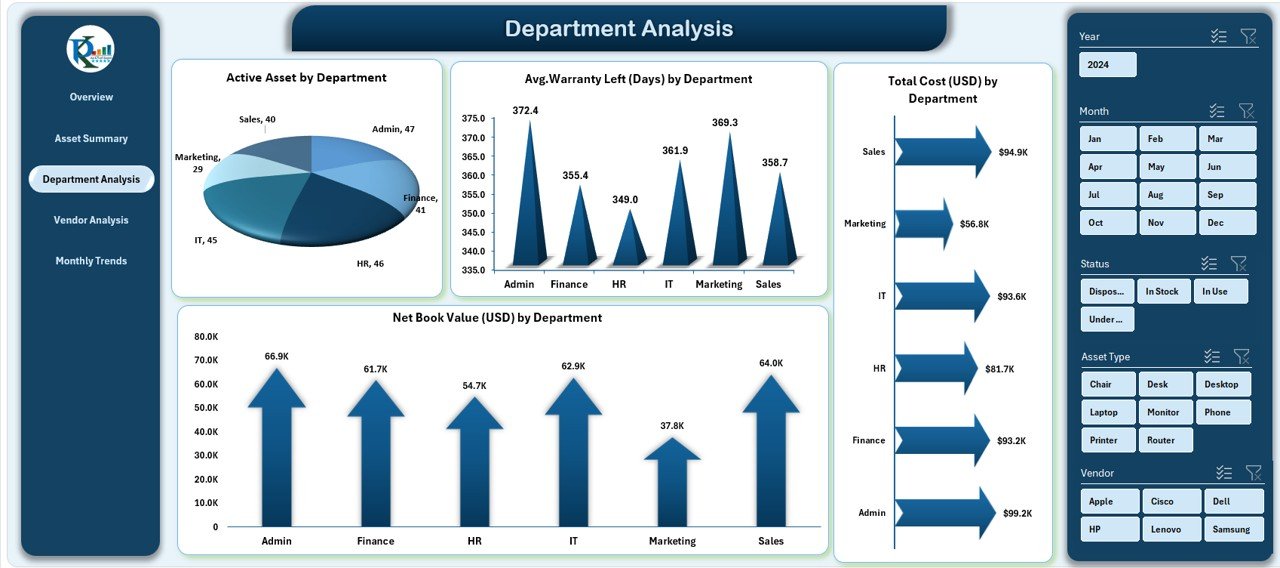
🏢 Department Analysis – Optimize Team Budgets
Drill into data by department:
-
Total Cost by Department
-
Warranty Days Left by Department
-
Net Book Value & Asset Counts by Department
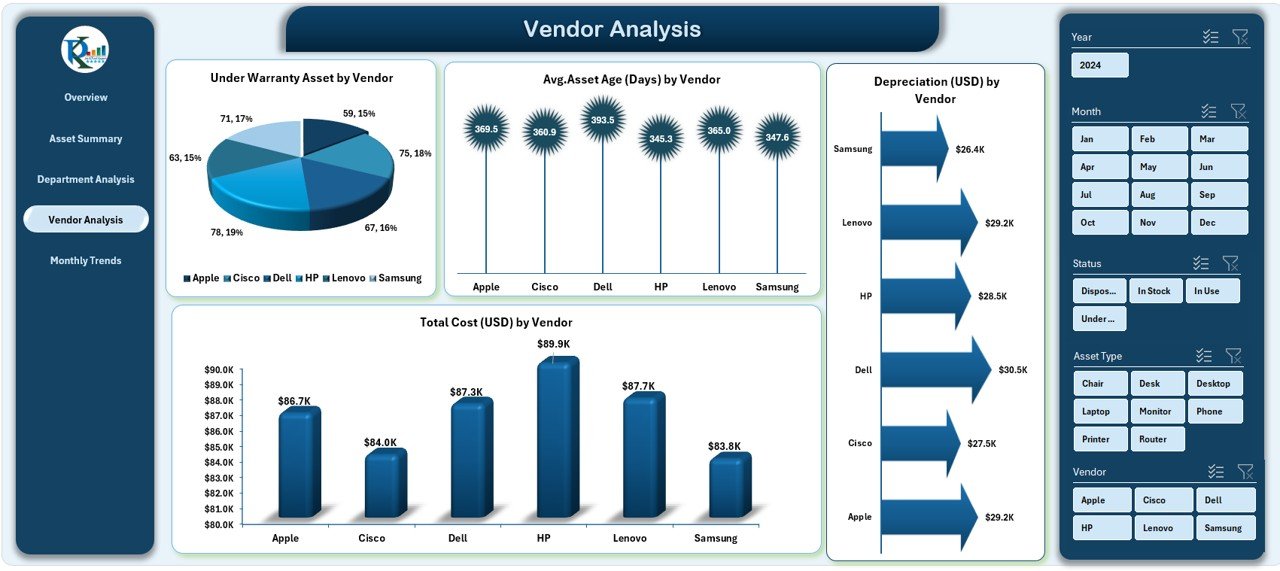
🏷️ Vendor Analysis – Manage Supplier Efficiency
Monitor vendor-specific metrics:
-
Depreciation by Vendor
-
Under-Warranty Assets
-
Total Costs & Avg. Age by Vendor
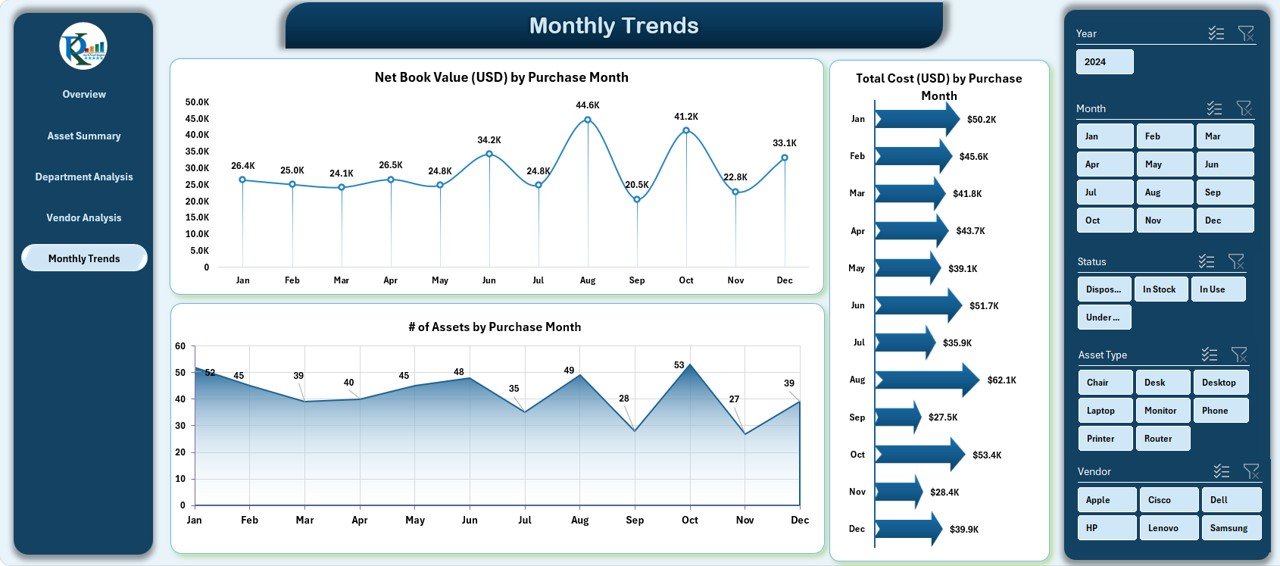
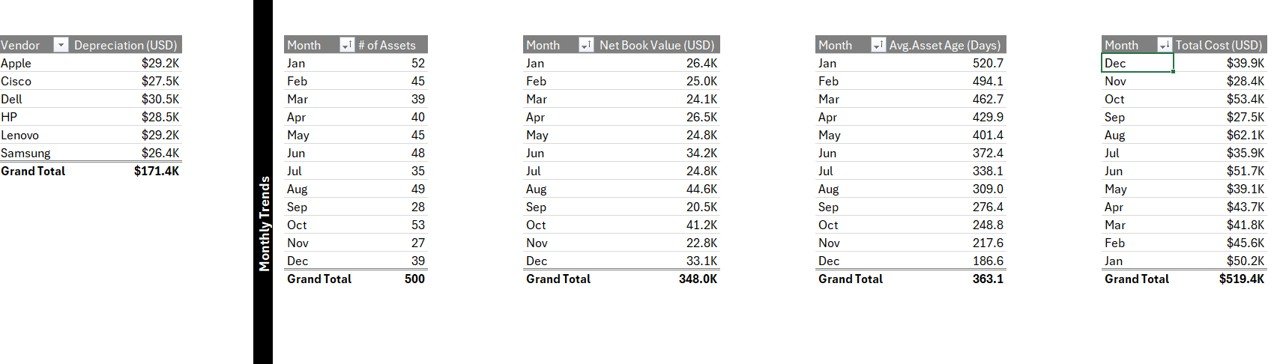
📈 Monthly Trends – Track Purchases Over Time
Spot seasonal buying habits and plan budgets:
-
Total Cost by Purchase Month
-
Net Book Value by Month
-
Asset Counts by Month
📂 What’s Inside the Dashboard Template
When you download this Excel template, you’ll receive:
✅ A fully formatted, editable Excel file
✅ 5 detailed data analysis pages
✅ Page navigator with instant access buttons
✅ Charts that update dynamically as data changes
✅ KPI cards that summarize the key numbers
✅ Departmental and vendor-wise cost insights
✅ Warranty and depreciation calculations
✅ Trend tracking for long-term planning
Everything is prebuilt—you just plug in your asset data!
🛠️ How to Use the Dashboard
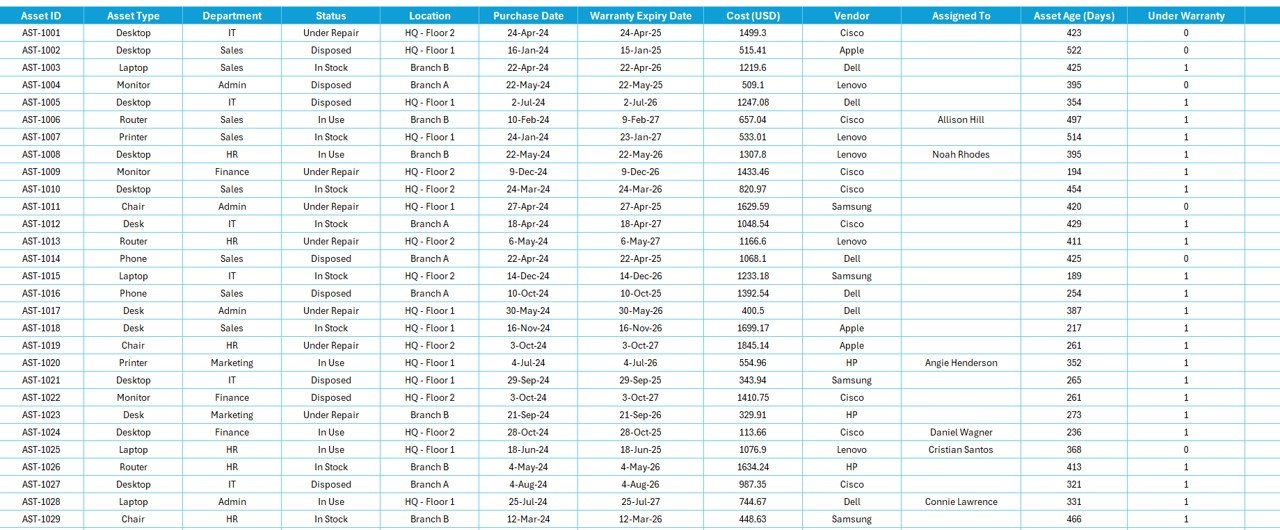
📁 Step 1: Input Asset Data
Fill in purchase dates, costs, vendors, departments, and warranty details in the master data sheet.
🔄 Step 2: Refresh Calculations
The dashboard auto-updates charts and KPIs based on your data entries.
📊 Step 3: Navigate Views
Use the sidebar navigator to switch between pages like Department Analysis and Monthly Trends.
💸 Step 4: Monitor Costs & Depreciation
Visuals help you track financial trends, depreciation, and asset value instantly.
🛠️ Step 5: Customize as Needed
Update chart titles, add slicers, or modify color schemes—it’s Excel, so it’s all flexible!
👥 Who Can Benefit from This Dashboard?
This dashboard is perfect for:
🏢 Facility Managers – Keep track of everything from desks to air conditioners
💰 Finance Teams – Manage asset depreciation and budgeting
🛠️ IT Departments – Monitor equipment age, warranties, and replacements
📦 Procurement Teams – See trends in purchases and vendor costs
👩💼 Operations Leaders – Get a 360° view of office asset distribution and usage
From small startups to large enterprises, this dashboard scales with you.
✅ Click here to read the Detailed blog post
🔗 Visit our YouTube channel to learn step-by-step video tutorials


Reviews
There are no reviews yet.