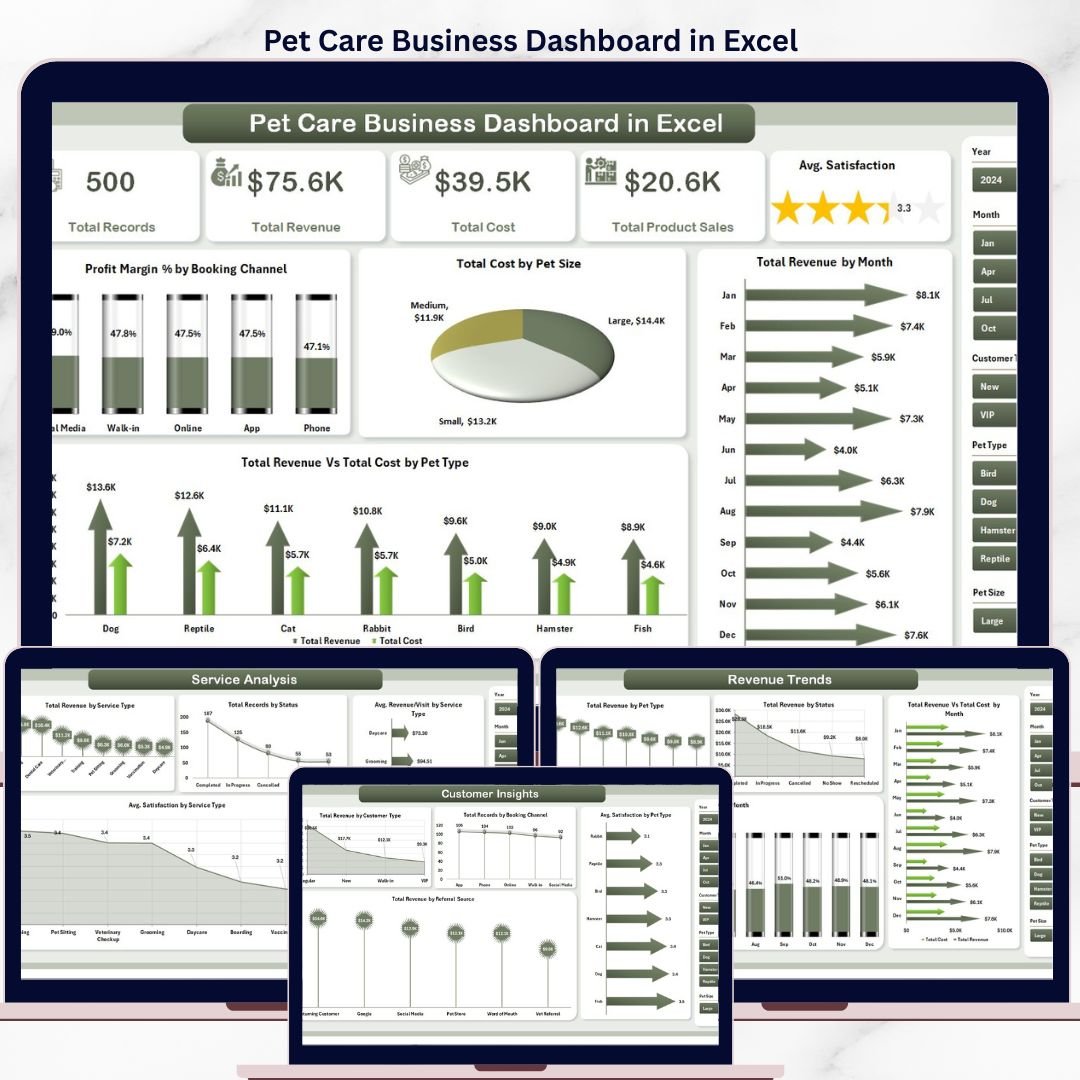

The Pet Care Business Dashboard in Excel tracks 5 KPIs across 5 interactive pages, with 16 pre-built charts, multiple slicers for one-click filtering, and a pivot-driven Support sheet for automatic data refresh. Setup takes under 10 minutes — just open the .xlsx file, replace the sample data, click Refresh All, and every chart and card updates automatically.
🌍 Join 8,400+ teams in 40+ countries using Nextgen Templates to replace paid SaaS tools with one-time-purchase Excel, Google Sheets, Power BI, and HTML templates.
✅ Instant download · One-time payment · No subscription · No per-user fees · Lifetime access
🔑 Key Features of Pet Care Business Dashboard in Excel
📊 Five-Page Interactive Dashboard — The Pet Care Business Dashboard in Excel delivers 5 dedicated analysis pages covering Overview, Service Analysis, Customer Insights, Staff & Location, and Revenue Trends. Every page is wired to a single pivot-driven Support sheet — change the data, click Refresh All, and all 16 charts rebuild in seconds.
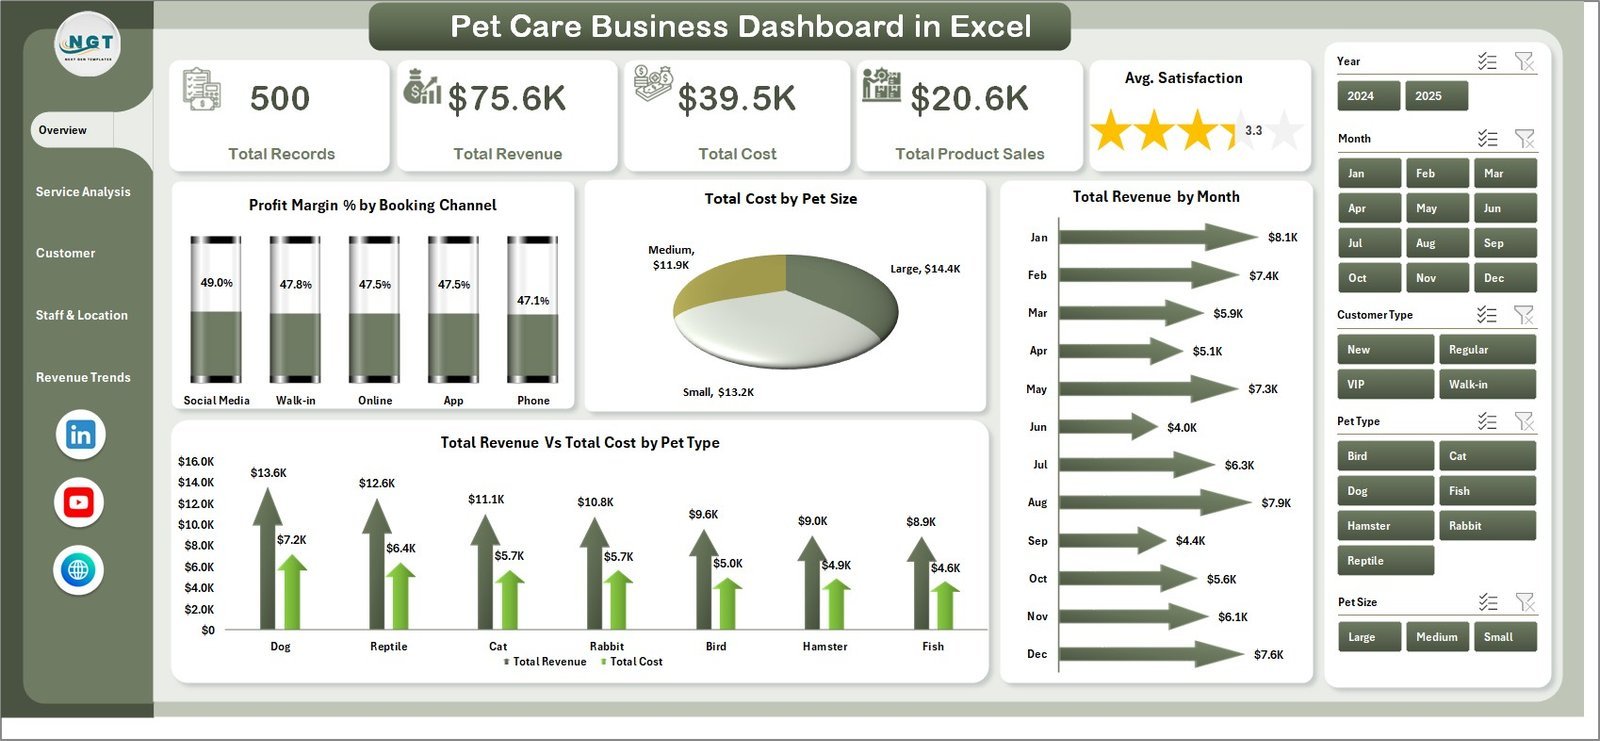
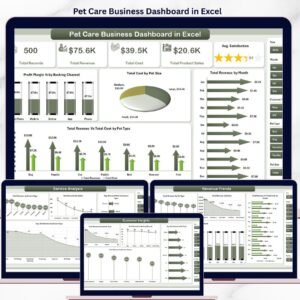
📈 5 KPI Cards on the Overview Page — Track Total Records, Total Revenue, Total Cost, Total Product Sales, and Avg. Satisfaction at a glance. These definitive headline metrics give pet grooming salon owners, boarding operators, and veterinary-adjacent service businesses an instant performance snapshot without opening a single raw data row.
🎛️ Multiple Slicers for Instant Filtering — The Overview page includes slicers for Booking Channel, Pet Size, Pet Type, and more — click any slicer value and every KPI card and chart on the page updates immediately. No formulas to edit, no manual chart-source repointing.
📋 Structured Data Sheet + Support Sheet — All data enters through the pre-formatted Data Sheet. The hidden Support Sheet holds all pivot tables that feed every chart. Go to Data → Refresh All after updating data; the entire dashboard rebuilds in one click.
🐾 Pet-Care-Specific Analytics — Charts are built for pet service businesses: Revenue by Booking Channel, Cost by Pet Size, Revenue vs Cost by Pet Type, Profit Margin % by Booking Channel, Avg. Satisfaction by Service Type, Revenue by Referral Source, Revenue by Top 5 Staff Member, Completion % by Location, and more. These 16 charts cover the exact dimensions pet care operators track to grow revenue and manage costs.
📦 What’s Inside the Pet Care Business Dashboard in Excel
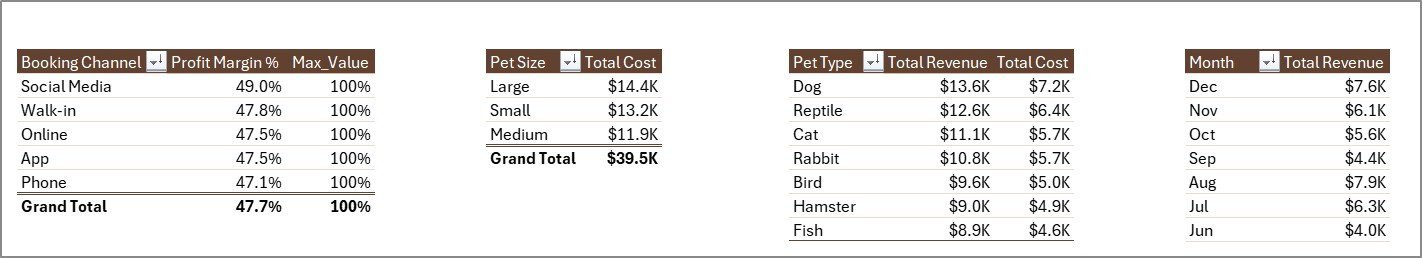
📌 Page 1 — Overview: 5 KPI cards (Total Records, Total Revenue, Total Cost, Total Product Sales, Avg. Satisfaction) plus 4 charts: Profit Margin % by Booking Channel reveals which booking channels deliver the best margins; Total Cost by Pet Size shows where service costs concentrate across small, medium, and large pets; Total Revenue by Month surfaces seasonal booking patterns; Total Revenue vs Total Cost by Pet Type compares income against cost across dogs, cats, birds, and other species. Slicers on this page filter the entire dashboard instantly.
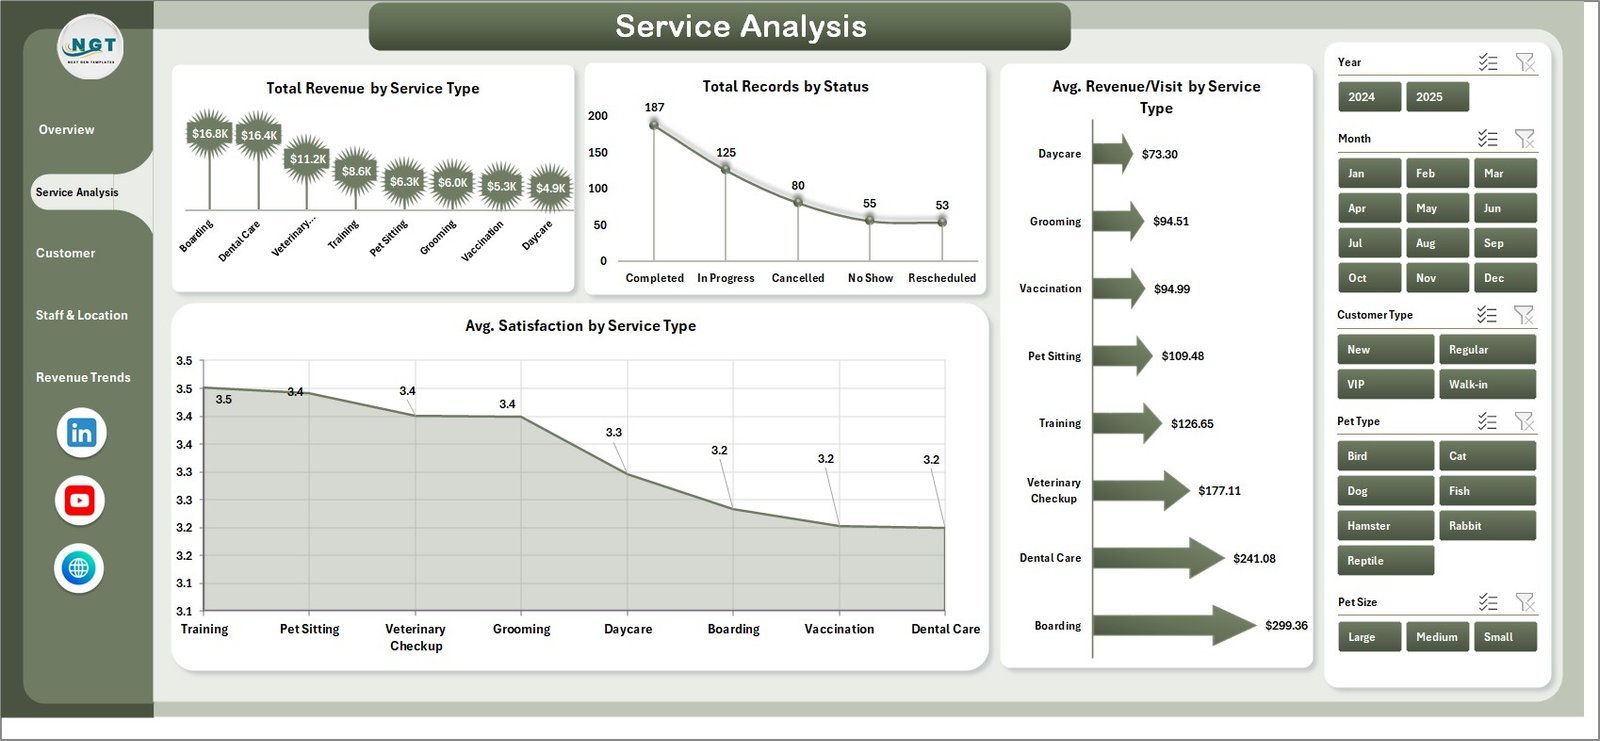
📌 Page 2 — Service Analysis: 4 charts focused on service performance: Total Revenue by Service Type shows which services (grooming, boarding, vet check, training) earn the most; Total Records by Status tracks completed vs pending vs cancelled appointments; Avg. Revenue/Visit by Service Type benchmarks revenue efficiency per appointment category; Avg. Satisfaction by Service Type identifies which services deliver the highest client experience scores.
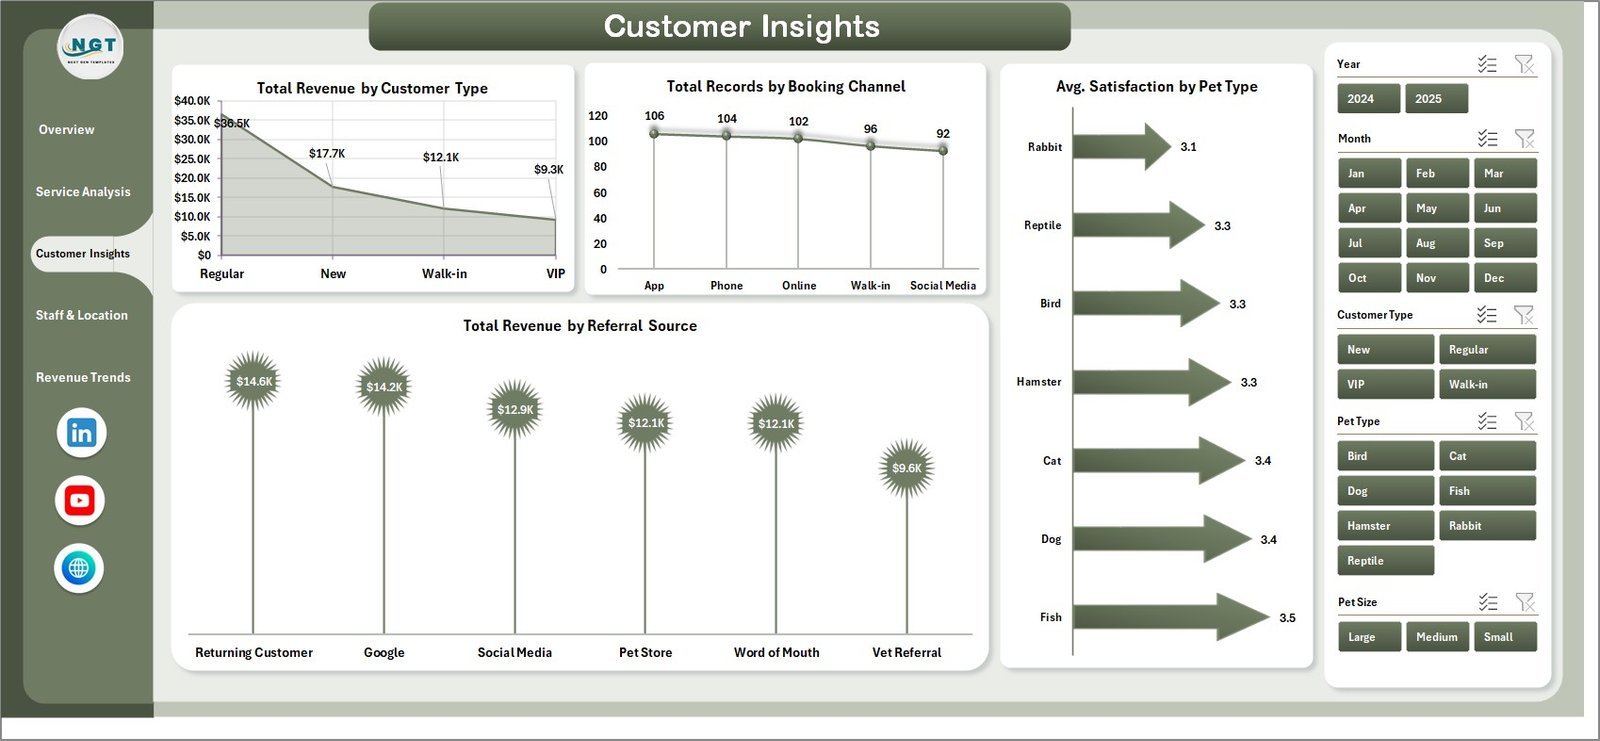
📌 Page 3 — Customer Insights: 4 charts covering client demographics and acquisition: Total Revenue by Customer Type segments revenue by new vs returning clients; Total Records by Booking Channel compares in-store, online, phone, and app booking volumes; Avg. Satisfaction by Pet Type surfaces which animal categories receive the highest and lowest satisfaction scores; Total Revenue by Referral Source identifies which marketing channels drive the most bookings.
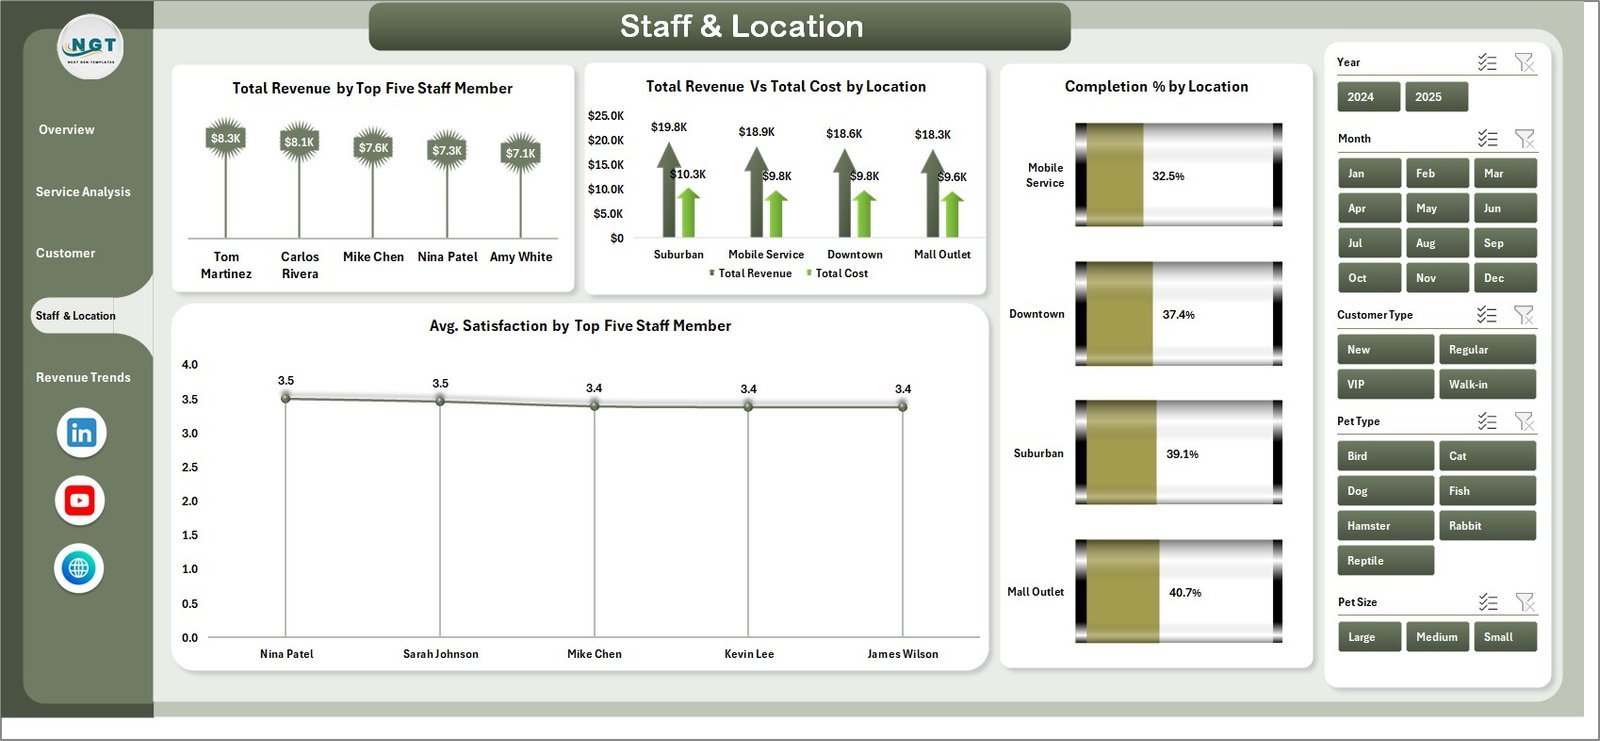
📌 Page 4 — Staff & Location: 4 charts for operational performance: Total Revenue by Top Five Staff Member ranks your highest-earning groomers and handlers; Total Revenue vs Total Cost by Location compares profitability across branches; Completion % by Location tracks appointment completion rates per outlet; Avg. Satisfaction by Top Five Staff Member identifies which team members deliver the best client experience.
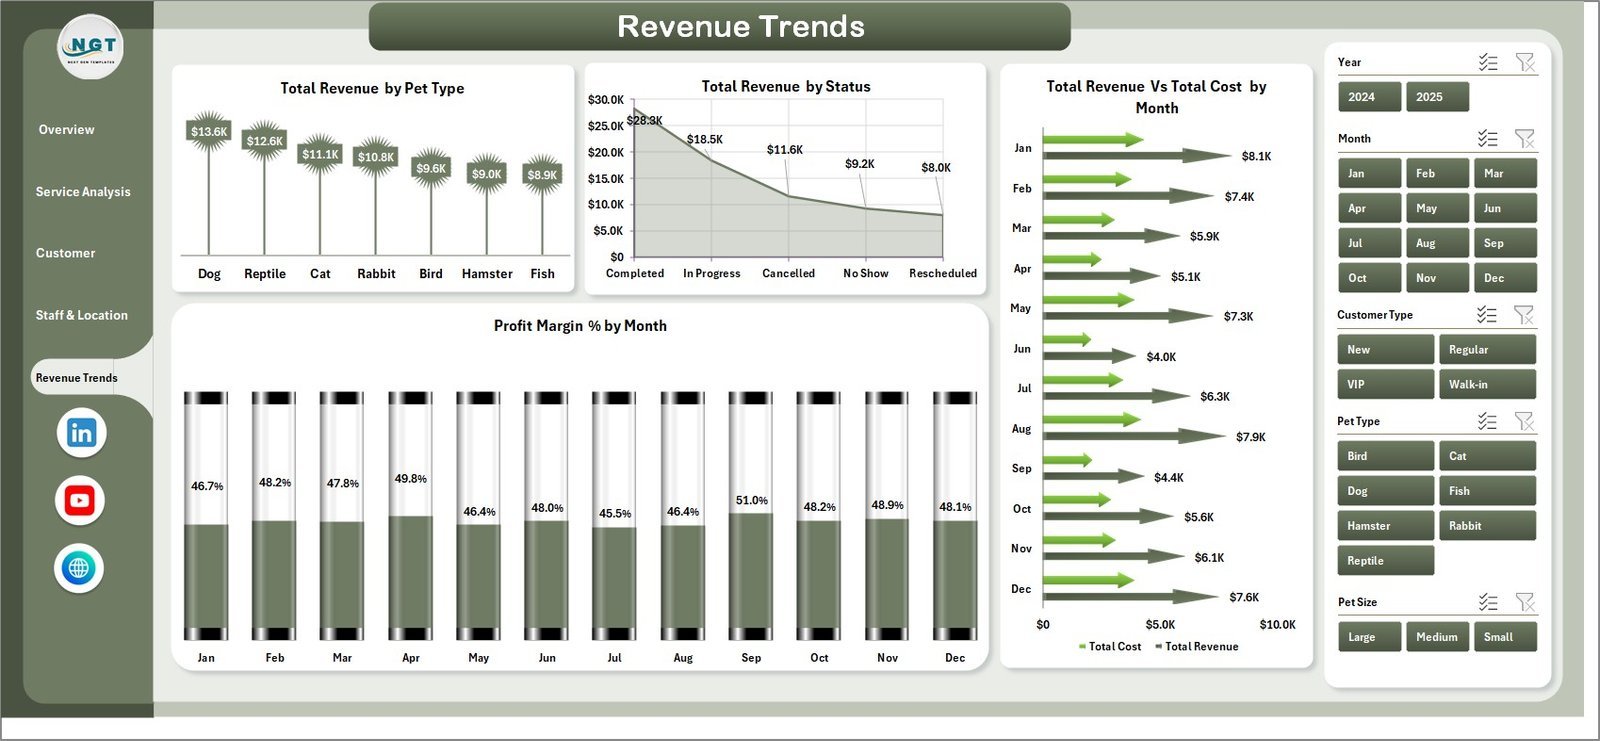
📌 Page 5 — Revenue Trends: 4 financial trend charts: Total Revenue by Pet Type for cross-species revenue comparison; Total Revenue by Status separates completed, cancelled, and pending revenue impact; Total Revenue vs Total Cost by Month tracks margin trends month by month; Profit Margin % by Month spots seasonal margin dips before they hurt cash flow.
📌 Data Sheet: Pre-formatted table where you enter all pet care business records — Date, Service Type, Pet Type, Pet Size, Booking Channel, Staff Member, Location, Revenue, Cost, Status, Satisfaction Score, and more. Replace the sample data and all dashboard pages update after one Refresh All click.
📌 Support Sheet: The hidden pivot-table engine that powers all 16 charts. After updating the Data Sheet, go to the Excel Ribbon → Data → Refresh All. Every pivot, KPI card, and chart across all 5 pages rebuilds automatically. Keep this sheet hidden for end users.
📊 Pet Care Business Dashboard in Excel vs. Google Sheets vs. Pet Desk / Ginger — Where This Fits
| Feature | Pet Care Business Dashboard in Excel | Google Sheets Dashboard | PetDesk / Gingr (SaaS) |
|---|---|---|---|
| Cost | $17.99 one-time | $9.99 one-time | $99–249 / month |
| Platform | Microsoft Excel (desktop) | Google Sheets (browser) | Cloud SaaS app |
| Setup Time | Under 10 minutes | Under 10 minutes | 1–2 weeks onboarding |
| Works Offline | ✅ Full offline support | ❌ Requires internet | ❌ Cloud-only |
| Slicers & Filters | ✅ Excel native slicers | ✅ Filter menus | ✅ Dashboard filters |
| Customizable Fields | ✅ Fully editable pivot model | ✅ Fully editable | ❌ Vendor-locked |
| Works on Mac | ✅ Excel for Mac | ✅ Any browser | ✅ Web app |
| Year-1 Cost at 5 Users | $17.99 total | $9.99 total | $5,940–17,940 |
| 16 Pet-Specific Charts | ✅ Built-in | 15+ charts | ✅ Vendor templates |
For pet grooming salons, boarding facilities, and multi-service pet care centers that want 16 pre-built analytics charts without paying $99–249/month, the Pet Care Business Dashboard in Excel sits in the sweet spot.
👥 Who This Template Is For — and Who It’s Not For
✅ This template is built for:
- Pet grooming salon owners with 1–5 staff members tracking service revenue, satisfaction scores, and booking channels in Excel
- Dog and cat boarding facilities monitoring location-level profitability and staff performance across multiple outlets
- Multi-service pet care centers offering grooming, boarding, vet checks, and training — needing revenue visibility across all service types
- Pet business consultants building monthly performance reports for salon or daycare clients
❌ This template is NOT for:
- Large veterinary hospital chains needing EMR/EHR integration and HIPAA-compliant record management
- Businesses that need real-time appointment booking automation — this is an analytics dashboard, not a scheduling tool
- Teams needing multi-user cloud collaboration in real time — use the Pet Care Business Dashboard in Google Sheets instead
⚙️ How to Use the Pet Care Business Dashboard in Excel
- Download and open the .xlsx file in Microsoft Excel (2016 or later, including Microsoft 365 and Excel for Mac).
- Go to the Data Sheet and replace the sample records with your own pet care business data — keep the column headers intact.
- Click Data → Refresh All on the Excel Ribbon. All pivot tables in the Support Sheet rebuild instantly.
- Open the Overview page and use the slicers to filter by Booking Channel, Pet Type, Pet Size, or time period for targeted views.
- Explore the 4 analysis pages — Service Analysis, Customer Insights, Staff & Location, and Revenue Trends — for deeper operational and financial breakdowns.
💼 Real-World Use Cases
Sarah owns a 3-location pet grooming salon in Dallas. She uses the Pet Care Business Dashboard in Excel to compare revenue by staff member across locations, spot which booking channels generate the highest-margin appointments, and track monthly profit margins — without paying $200/month for Pet Desk. Her Excel file runs offline at each salon and syncs when staff export their data weekly.
Mark manages a boarding and daycare facility in London. The Staff & Location page lets him identify that one branch consistently has a 78% completion rate while the other hits 92% — a gap he traced to scheduling gaps during peak weekend hours. That single insight saved him from losing 14% of potential revenue at Branch 2.
Dr. Aisha runs a boutique veterinary wellness center offering grooming, vet checks, and nutrition consultations. The Customer Insights page shows her that referral-source revenue from social media outpaces walk-in bookings 2:1, leading her to double her Instagram ad spend — a decision backed directly by dashboard data rather than gut feel.
❓ Frequently Asked Questions
What KPIs does the Pet Care Business Dashboard in Excel track?
The Pet Care Business Dashboard in Excel tracks 5 headline KPIs: Total Records, Total Revenue, Total Cost, Total Product Sales, and Avg. Satisfaction. These KPI cards sit on the Overview page and update automatically when you refresh the pivot tables after entering new data.
How many charts are included in this dashboard?
The Pet Care Business Dashboard in Excel includes 16 pre-built charts across 5 pages — covering booking channel profitability, service revenue, pet type cost analysis, staff performance, location completion rates, monthly revenue trends, and profit margin trends by month.
How long does setup take?
Setup takes under 10 minutes. Open the .xlsx file, go to the Data Sheet, paste your pet care records into the same column structure, then click Data → Refresh All. All 5 dashboard pages rebuild automatically — no formula edits or chart repointing needed.
Does this work on Mac?
Yes. The Pet Care Business Dashboard in Excel works in Microsoft Excel for Mac (2019+). Slicers, pivot tables, and Refresh All behave the same as on Windows. There are no VBA macros, so there’s no security prompt to clear on Mac.
How does this compare to PetDesk or Gingr?
Pet Desk starts at $99/month and Ginger at $249/month — both include scheduling and client communication features. This dashboard costs $17.99 one-time and focuses entirely on analytics: 16 charts covering revenue, costs, satisfaction, and staff performance. For teams that already use a booking tool and just need data visibility, this dashboard eliminates the need for a separate BI subscription.
Can I add new service types or staff members?
Yes. Add new rows to the Data Sheet with your service types, staff names, or locations. Click Data → Refresh All and the slicers, pivot charts, and KPI cards automatically include the new values — no structural changes needed.
Is there a Google Sheets version?
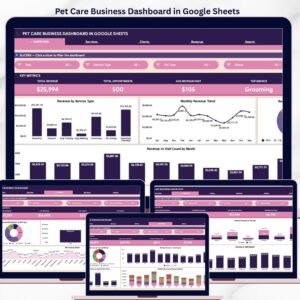
Yes. The Pet Care Business Dashboard in Google Sheets is available for teams that prefer cloud-based, browser-accessible analytics with real-time collaboration.
👤 About the Author
Built by PK — Microsoft Certified Professional with 15+ years of Excel, Google Sheets, and Power BI experience. Founder of Nextgen Templates, reaching 300K+ subscribers across YouTube channels (@PK-AnExcelExpert, @NextGenTemplates, @NeoTechNavigators). Every template is hand-built and tested before release. Browse all Excel Dashboard Templates.
🔗 Explore Related Templates
📄 Pet Care Business Dashboard in Google Sheets — Cloud-based version with 6 interactive pages, Search Sheet, and real-time collaboration.
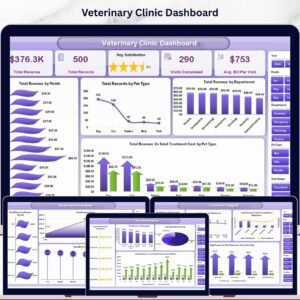
📄 Veterinary Clinic Dashboard in Excel — Full clinic analytics with 5 analysis pages covering patient, financial, and service insights.
📄 Veterinary Clinic Dashboard in Power BI — Advanced interactive analytics with DAX-powered visuals and drill-through pages.
📖 Click here to read the Detailed Blog Post
🎥 Visit our YouTube channel for step-by-step video tutorials
👉 YouTube.com/@NextGenTemplates
📅 Last updated: May 2026
Watch the step-by-step video tutorial:
YouTube


Reviews
There are no reviews yet.