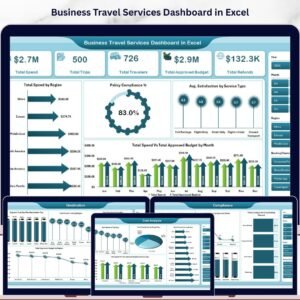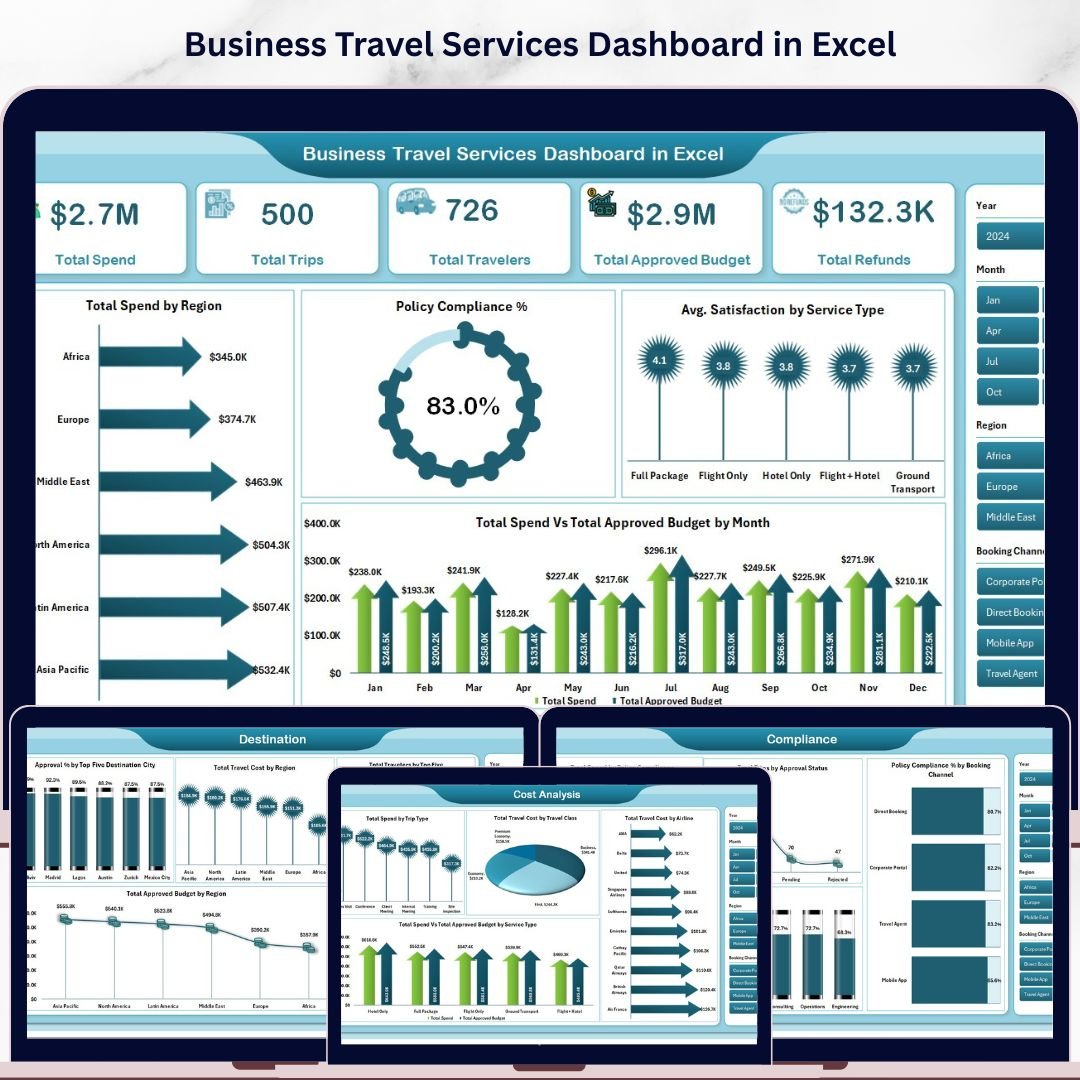
The Business Travel Services Dashboard in Excel tracks 5 core KPIs across 5 interactive dashboard pages, with 14 pre-built pivot-driven charts and multi-dimensional slicers covering spend, compliance, destinations, and trends. Setup takes under 10 minutes — replace the sample data in the Data sheet, hit Data → Refresh All, and every chart and KPI card updates automatically.
🌍 Join 8,400+ teams in 40+ countries using NextGenTemplates to replace paid SaaS tools with one-time-purchase Excel, Google Sheets, Power BI, and HTML templates.
✅ Instant download · One-time payment · No subscription · No per-user fees · Lifetime access
🔑 Key Features of the Business Travel Services Dashboard in Excel
This dashboard tracks 5 high-level KPIs — Total Spend, Total Trips, Total Travelers, Total Approved Budget, and Total Refunds — giving finance and operations teams an at-a-glance view of their entire corporate travel program. All metrics are powered by pivot tables and update automatically when you refresh.
🔹 14 pre-built charts — covering spend by region, policy compliance %, average satisfaction by service type, monthly spend vs budget, cost breakdown by trip type, travel class, and airline, destination city rankings, trend lines for trips and refunds, and booking channel analysis.
🔹 Multi-dimensional slicers on the Overview page let you filter the entire dashboard by any dimension — instantly see filtered results without writing a single formula.
🔹 Policy Compliance % tracking by booking channel and department — essential for audit-ready reporting and identifying rogue spend before it escalates.
🔹 Pivot-based architecture in the Support sheet means all 14 charts refresh with one click via Data → Refresh All. No manual recalculation required.
📦 What’s Inside the Business Travel Services Dashboard in Excel
The template ships with 7 sheets covering 5 analysis pages, a structured data entry sheet, and a hidden pivot support sheet.
1 — Overview Page
High-level KPI cards for Total Spend, Total Trips, Total Travelers, Total Approved Budget, and Total Refunds. Charts include: Total Spend by Region, Policy Compliance %, Avg. Satisfaction by Service Type, and Total Spend vs Total Approved Budget by Month. Slicers let you slice the entire view instantly.
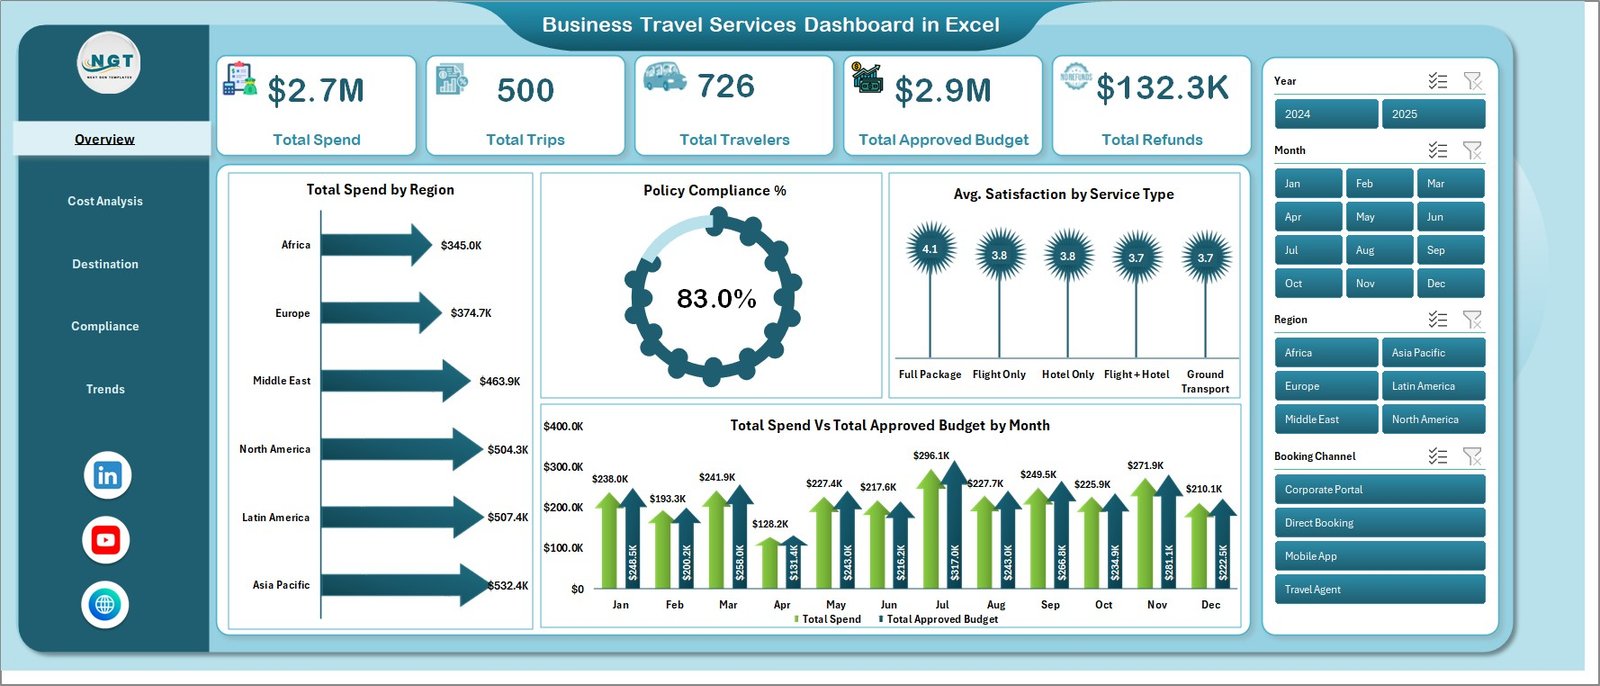
Overview Page
2 — Cost Analysis
Four focused cost breakdowns: Total Spend by Trip Type, Total Travel Cost by Travel Class, Total Travel Cost by Airline, and Total Spend vs Total Approved Budget by Service Type. Ideal for identifying overspend categories.
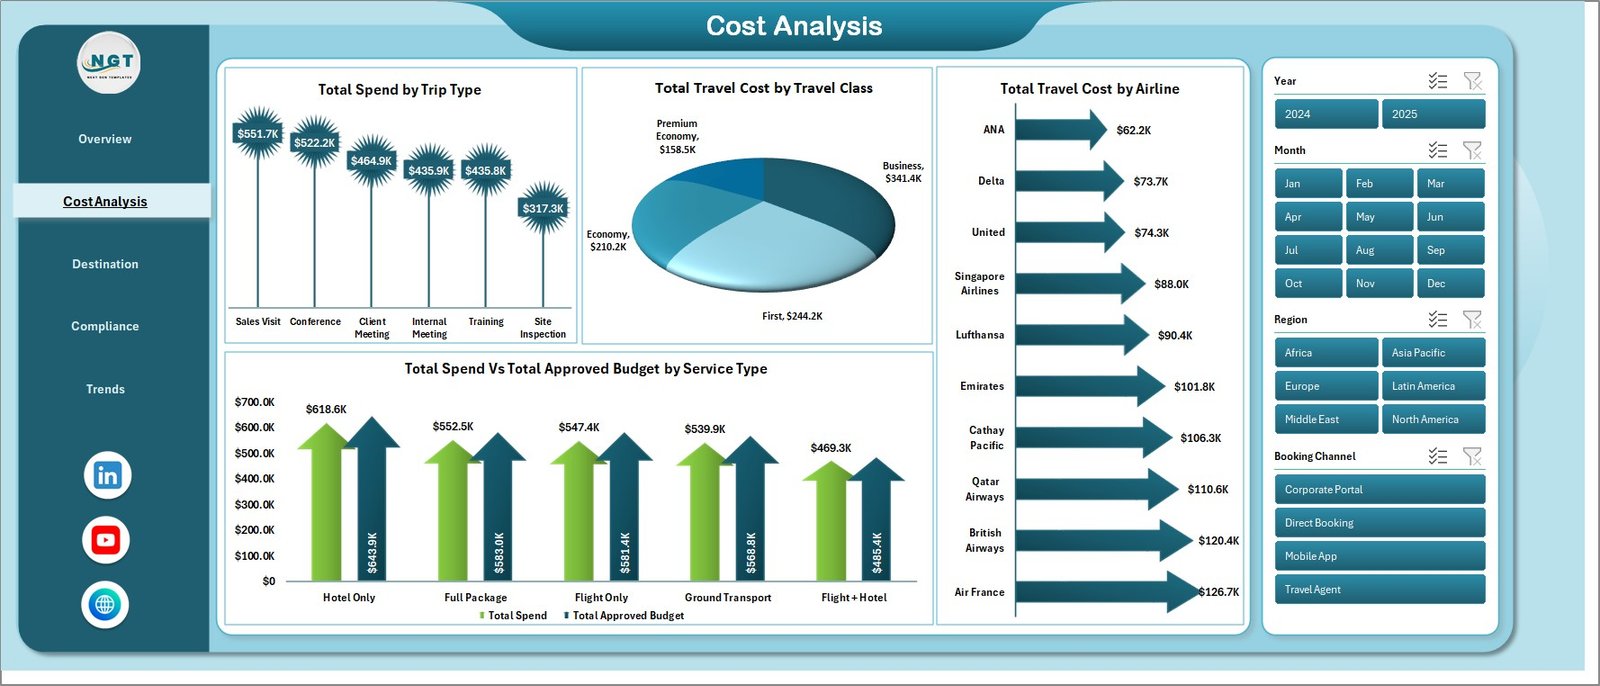
Cost Analysis
3 — Destination
Destination intelligence across four views: Approval % by Top 5 Destination City, Total Travel Cost by Region, Total Travelers by Top 5 Destination City, and Total Approved Budget by Region.
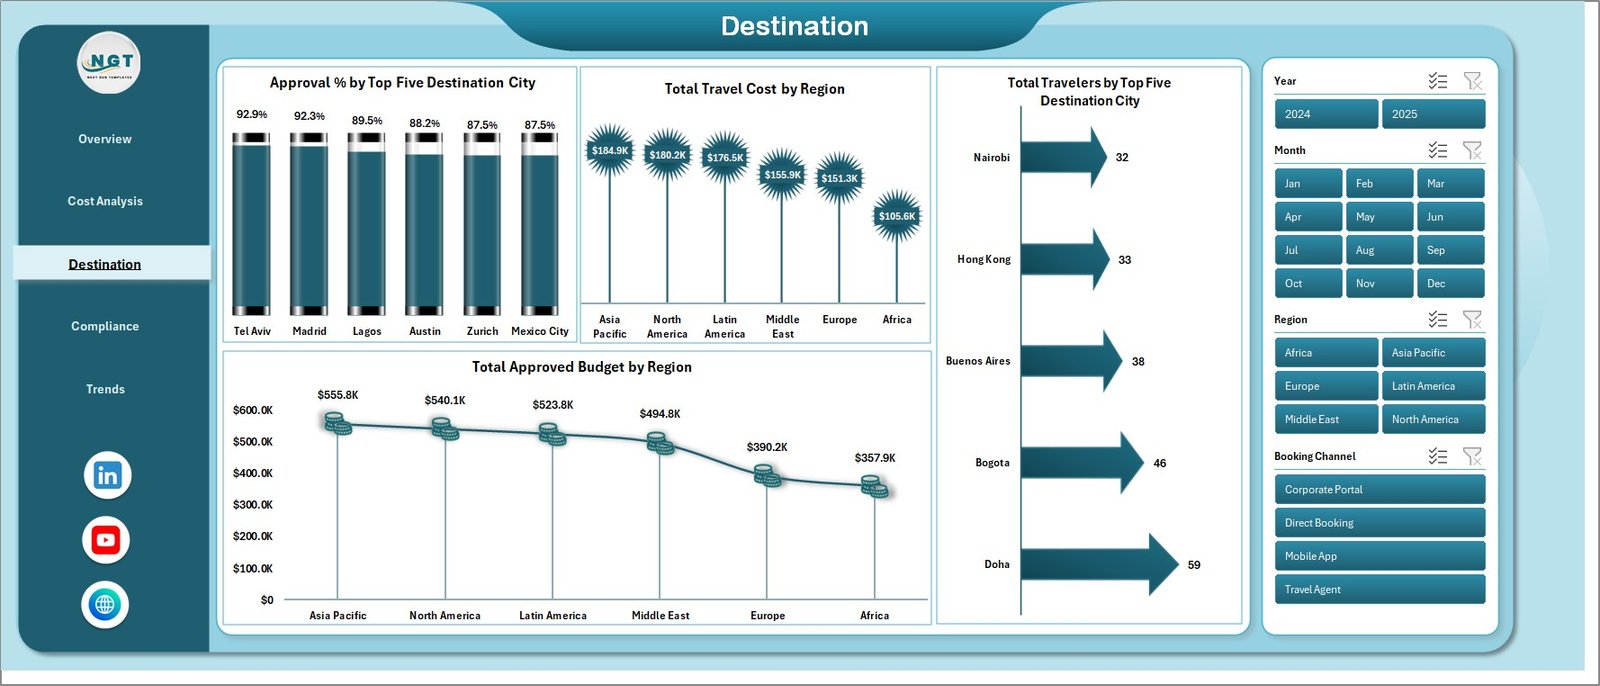
Destination Analysis
4 — Compliance
Four compliance-focused views: Total Spend by Policy Compliance, Total Trips by Approval Status, Policy Compliance % by Booking Channel, and Approval % by Department. Perfect for travel managers running quarterly audits.
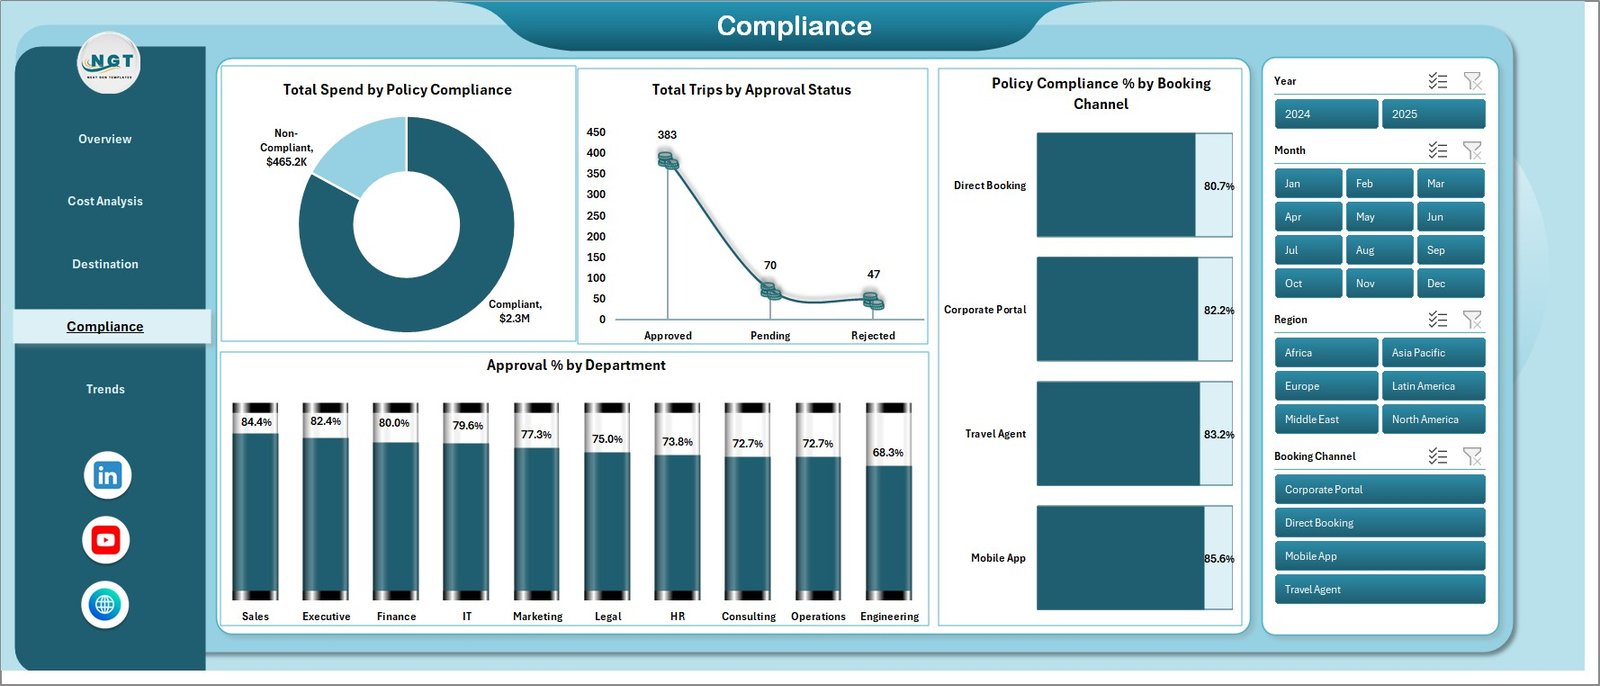
Compliance
5 — Trends
Three trend views over time: Total Trips by Month, Total Refunds by Month, and Total Spend vs Approved Budget by Booking Channel. Use this page to spot seasonal travel patterns and budget drift.
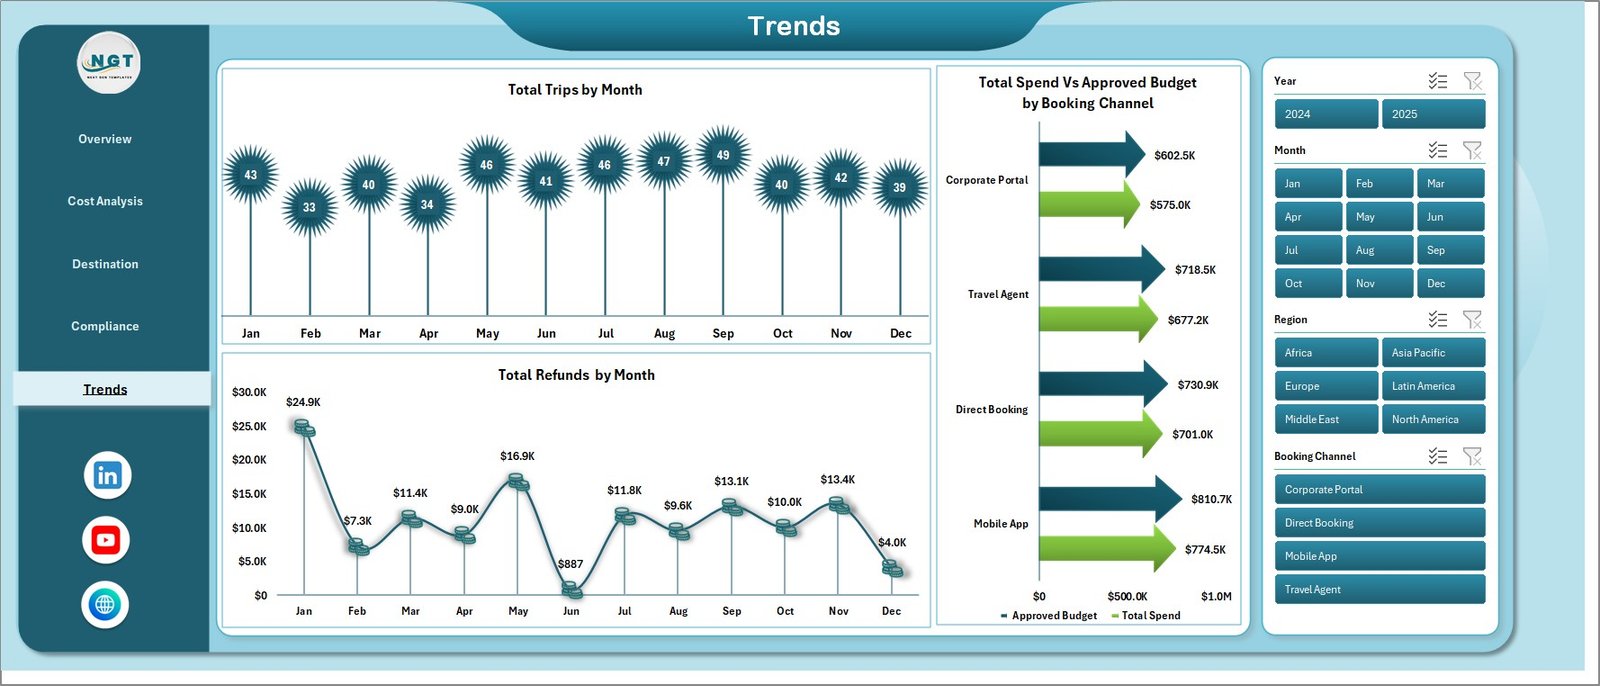
Trends
6 — Data Sheet
The structured data entry sheet. Add or paste your travel records in the defined column format. All pivot tables and charts read from this sheet.

Data Sheet Tab
7 — Support Sheet
Contains all pivot tables powering the dashboard charts. After updating the Data sheet, click Data → Refresh All in the Excel Ribbon to refresh all pivots simultaneously. This sheet can be hidden in production.
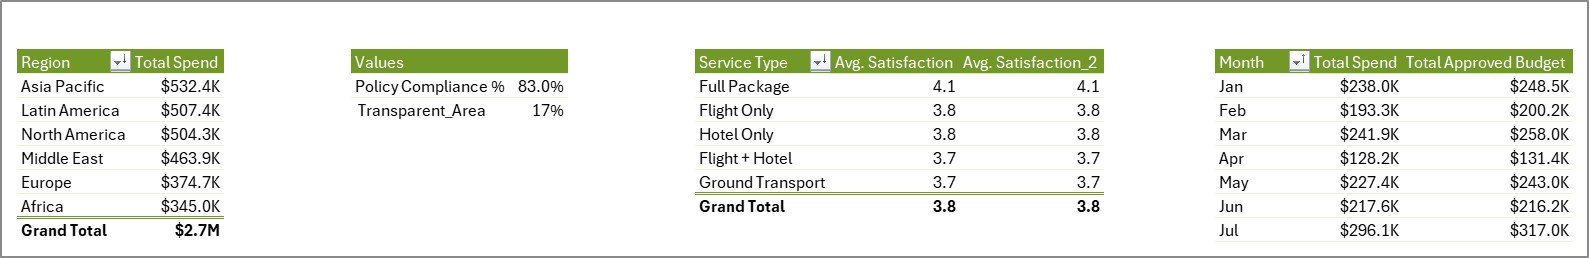
Support Sheet Tab
📊 Business Travel Services Dashboard in Excel vs. Google Sheets vs. Paid Travel SaaS — Where This Fits
| Feature | Business Travel Services Dashboard (Excel) | Google Sheets Dashboard | Concur / TripActions (Paid SaaS) |
|---|---|---|---|
| Cost | $17.99 one-time ✅ | Free (manual build) | $50–$150 / user / month |
| Platform | Microsoft Excel ✅ | Google Sheets (browser) | Cloud SaaS |
| Setup Time | <10 minutes ✅ | Hours (build from scratch) | Days (IT + SSO setup) |
| Works Offline | Yes ✅ | Limited | No |
| Pivot-Driven Refresh | One-click Refresh All ✅ | Manual formula updates | Auto (but locked) |
| Policy Compliance Tracking | Yes — 4 views ✅ | Manual formula build | Yes (at $$$) |
| Customizable Fields | Full Excel control ✅ | Yes | Limited / vendor-locked |
| Year-1 Cost at 10 Users | $17.99 total ✅ | $0 (self-built) | $6,000–$18,000 |
For travel managers who need real analytics without a SaaS contract, the Business Travel Services Dashboard in Excel sits in the sweet spot between free and over-engineered.
👥 Who This Template Is For — and Who It’s Not For
✅ This template is built for:
- Corporate travel managers at SMEs (10–500 employees) tracking spend and policy compliance
- Finance teams reporting quarterly travel budgets vs actuals to leadership
- Operations and HR managers running department-level travel cost reviews
- Business analysts who need a ready-made travel reporting framework without building from scratch
❌ This template is NOT for:
- Enterprise teams requiring live booking integration with Concur, Amex GBT, or Navan
- Users needing automatic data syncs from travel booking platforms
- Teams that don’t use Microsoft Excel (use the Google Sheets dashboard instead)
⚙️ How to Use the Business Travel Services Dashboard in Excel
- Download and open the .zip file and launch the Excel workbook.
- Go to the Data sheet and replace or paste your own travel records in the existing column format.
- Click Data → Refresh All in the Excel Ribbon to refresh all pivot tables simultaneously.
- Navigate to any dashboard page — Overview, Cost Analysis, Destination, Compliance, or Trends — to view updated charts.
- Use the slicers on the Overview page to filter the dashboard by date range, department, region, or any other dimension.
- Hide the Support sheet when sharing with stakeholders to keep the file clean.
💼 Real-World Use Cases
Priya manages travel operations at a 120-person consulting firm. She uses the Business Travel Services Dashboard in Excel to submit monthly travel spend reports to the CFO, broken down by department, region, and airline. Instead of spending hours on manual spreadsheets, she updates the Data sheet and clicks Refresh All — the full report is ready in minutes.
Marcus is a finance analyst at a mid-size tech company. He tracks policy compliance across 4 booking channels and flags departments with below-threshold approval rates using the Compliance page. The dashboard’s Policy Compliance % by Booking Channel chart saves him an entire day of manual analysis each quarter.
Elena leads HR at a manufacturing group with offices in 3 regions. She uses the Destination and Trends pages to identify which cities are driving the highest travel costs and which months have unexplained refund spikes — insights that feed directly into her annual travel policy review.
❓ Frequently Asked Questions
What KPIs does the Business Travel Services Dashboard in Excel track?
The dashboard tracks 5 core KPIs: Total Spend, Total Trips, Total Travelers, Total Approved Budget, and Total Refunds. It also calculates Policy Compliance % and Average Satisfaction by Service Type across 5 interactive analysis pages with 14 pre-built charts.
How do I update the dashboard with my own data?
Go to the Data sheet tab and replace the sample data with your own travel records in the same column format. Then click Data → Refresh All in the Excel Ribbon. All pivot tables and charts update automatically — no formula editing required.
Does this dashboard work without macros?
Yes. The Business Travel Services Dashboard in Excel is built entirely on pivot tables and standard Excel charts — no VBA or macros required. It works in Excel 2016, Excel 2019, Excel 2021, and Microsoft 365.
How does this compare to Concur or TripActions?
Concur and TripActions cost $50–$150 per user per month and require IT setup, SSO, and booking integration. This dashboard costs $17.99 one time, installs in 10 minutes, and gives you the same analytical depth for teams that manage data manually in Excel.
Can I customize the KPIs and charts?
Yes. Because the dashboard is built on Excel pivot tables, you can extend the data columns, add new pivot fields, and create additional charts using standard Excel tools. The Support sheet contains all underlying pivots — modify them directly to add new dimensions.
How many users can use this file?
The file is a standard Excel workbook — you can share it with your entire team at no extra cost. Unlike SaaS tools, there are no per-user fees or seat limits. One purchase covers your whole organization.
Is there a Google Sheets version available?
Yes — explore our Google Sheets Dashboard Templates for browser-based versions of similar travel and operations dashboards.
👤 About the Author
Built by PK — Microsoft Certified Professional with 15+ years of Excel, Google Sheets, and Power BI experience. Founder of NextGenTemplates, reaching 300K+ subscribers across YouTube channels (@PK-AnExcelExpert, @NextGenTemplates, @NeoTechNavigators). Every template is hand-built and tested before release.
🔗 Explore Related Templates
Looking for more operations and analytics dashboards? Explore our Excel Dashboard Templates — or check these related templates:
- Fleet Management Dashboard in Excel
- Expense Tracking Dashboard in Excel
- Supply Chain Operations Dashboard in Excel
📖 Click here to read the Detailed Blog Post
🎥 Visit our YouTube channel for step-by-step video tutorials
👉 YouTube.com/@NextGenTemplates
📅 Last updated: May 2026
Watch the step-by-step video tutorial:
YouTube