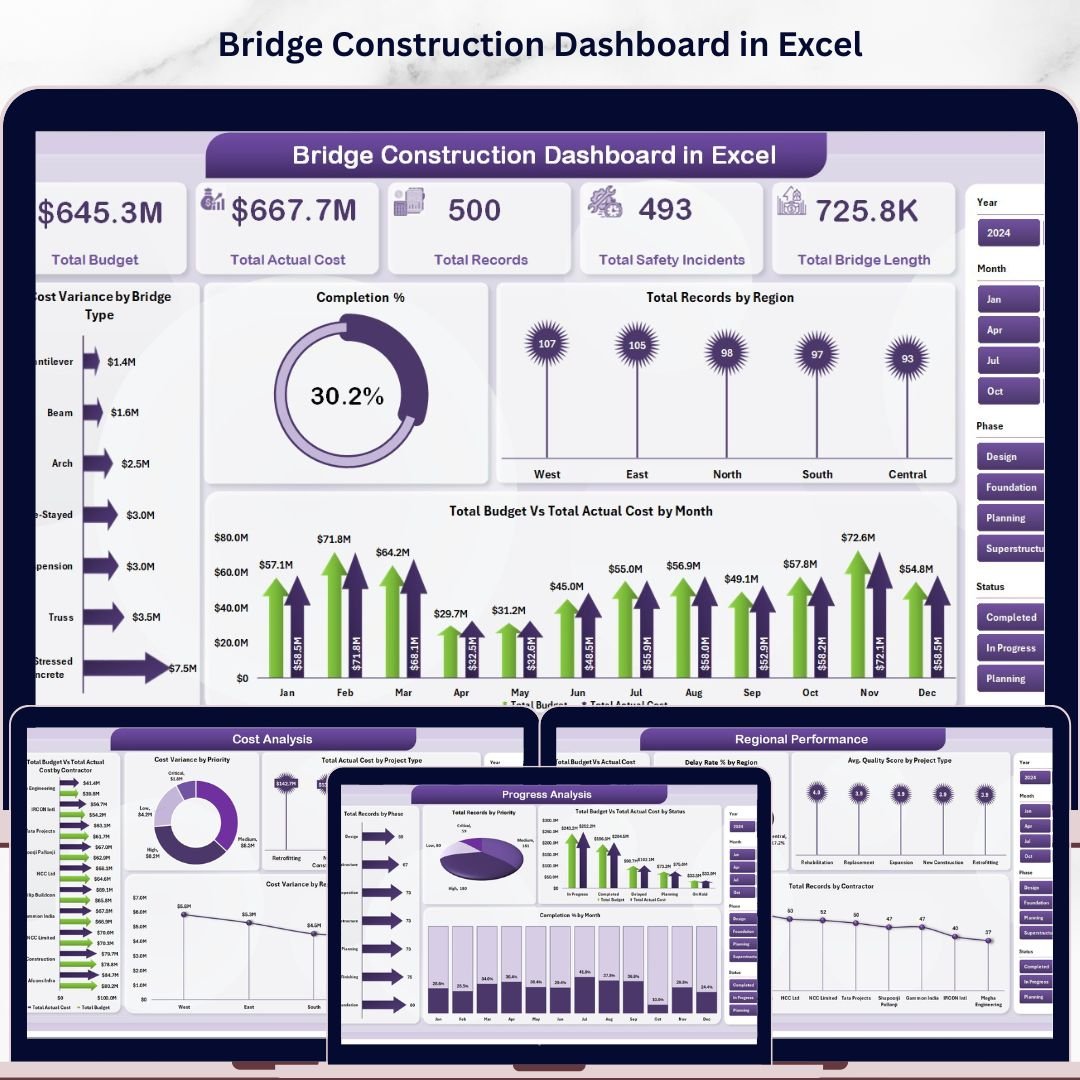
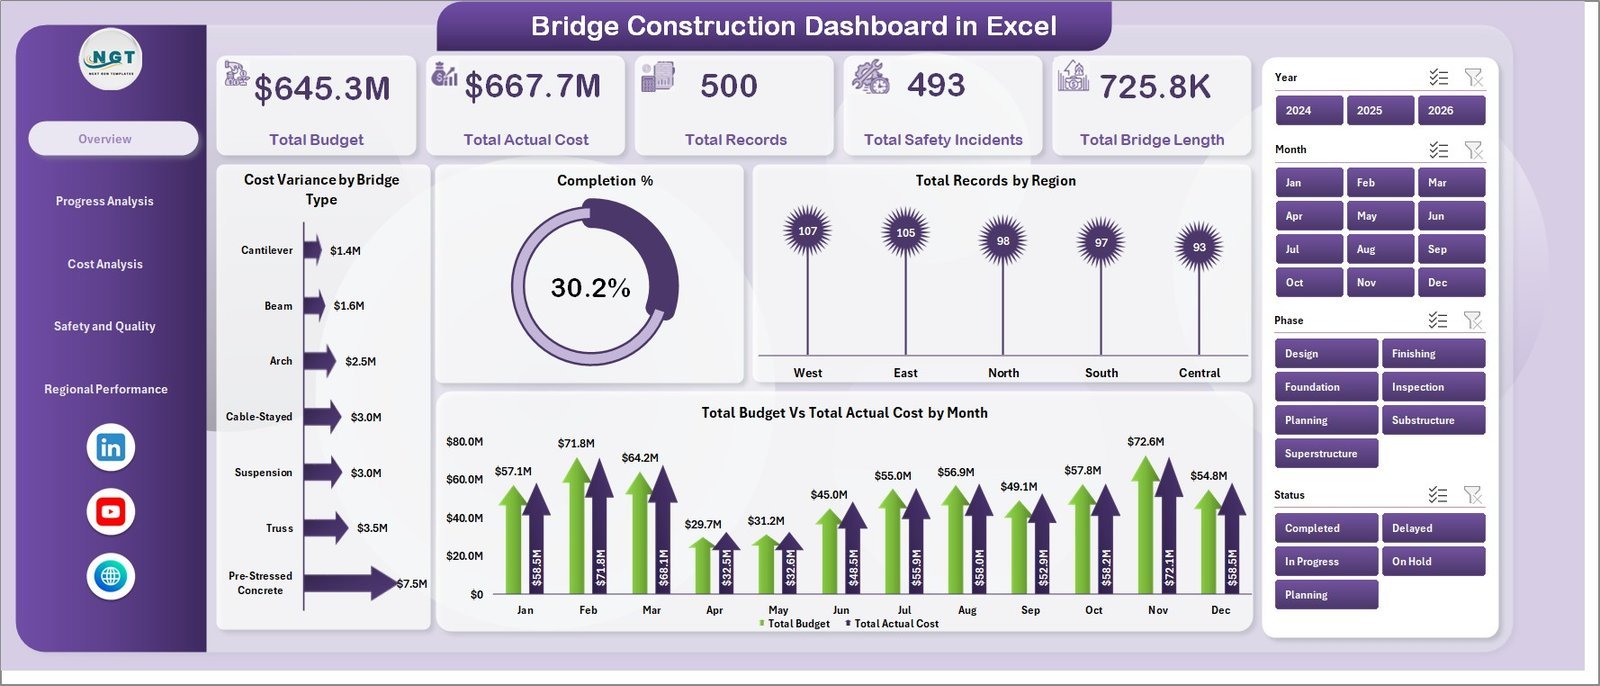
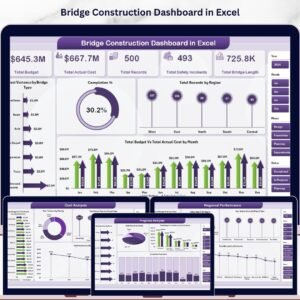
The Bridge Construction Dashboard in Excel tracks 5 headline KPIs across 5 interactive pages — Total Budget, Total Actual Cost, Total Records, Total Safety Incidents, and Total Bridge Length — with 19 pre-built charts covering cost variance, completion rate, safety incidents, and regional performance. Setup takes under 10 minutes: replace the sample data in the Data sheet, press Data → Refresh All, and every chart and KPI card updates automatically.
🌍 Join 8,400+ teams in 40+ countries using Nextgen Templates to replace paid SaaS tools with one-time-purchase Excel, Google Sheets, Power BI, and HTML templates.
✅ Instant download · One-time payment · No subscription · No per-user fees · Lifetime access
🔑 Key Features of the Bridge Construction Dashboard in Excel
📊 5 KPI cards on the Overview page — Total Budget, Total Actual Cost, Total Records, Total Safety Incidents, and Total Bridge Length give project managers an at-a-glance view of portfolio health. All cards connect to your data and refresh automatically when you update the Data sheet and hit Refresh All.
📊 Cost variance monitoring across four dimensions — The dashboard tracks budget vs. actual cost by Bridge Type, Contractor, Priority, and Region. This lets you pinpoint exactly where overruns are happening before they escalate — whether it’s a specific contractor, a priority-tier, or a geographic area.
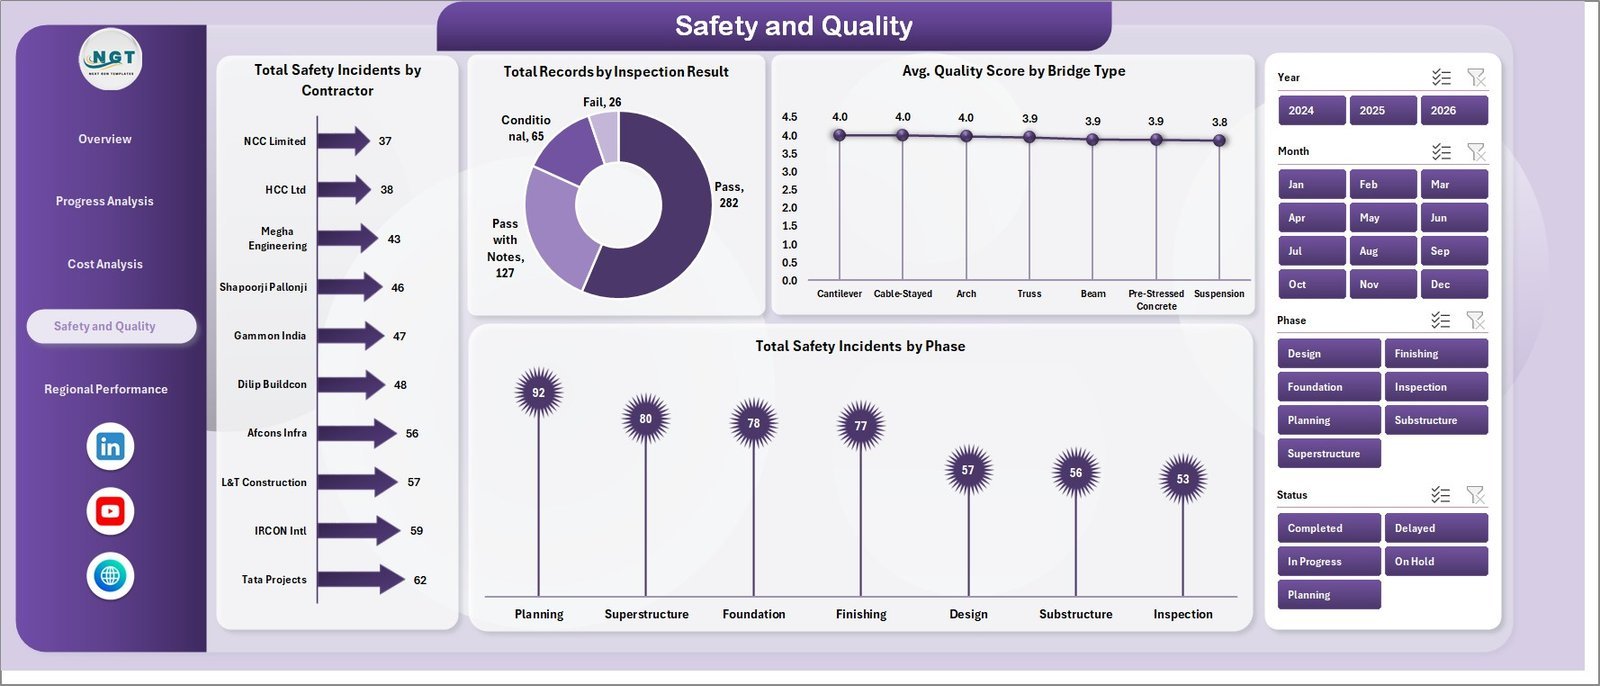
📊 Safety and quality tracking in one view — The Safety and Quality page covers Total Safety Incidents by Contractor, Total Records by Inspection Result, Avg. Quality Score by Bridge Type, and Total Safety Incidents by Phase. Infrastructure managers can use this page to meet compliance reporting requirements and flag high-risk phases early.
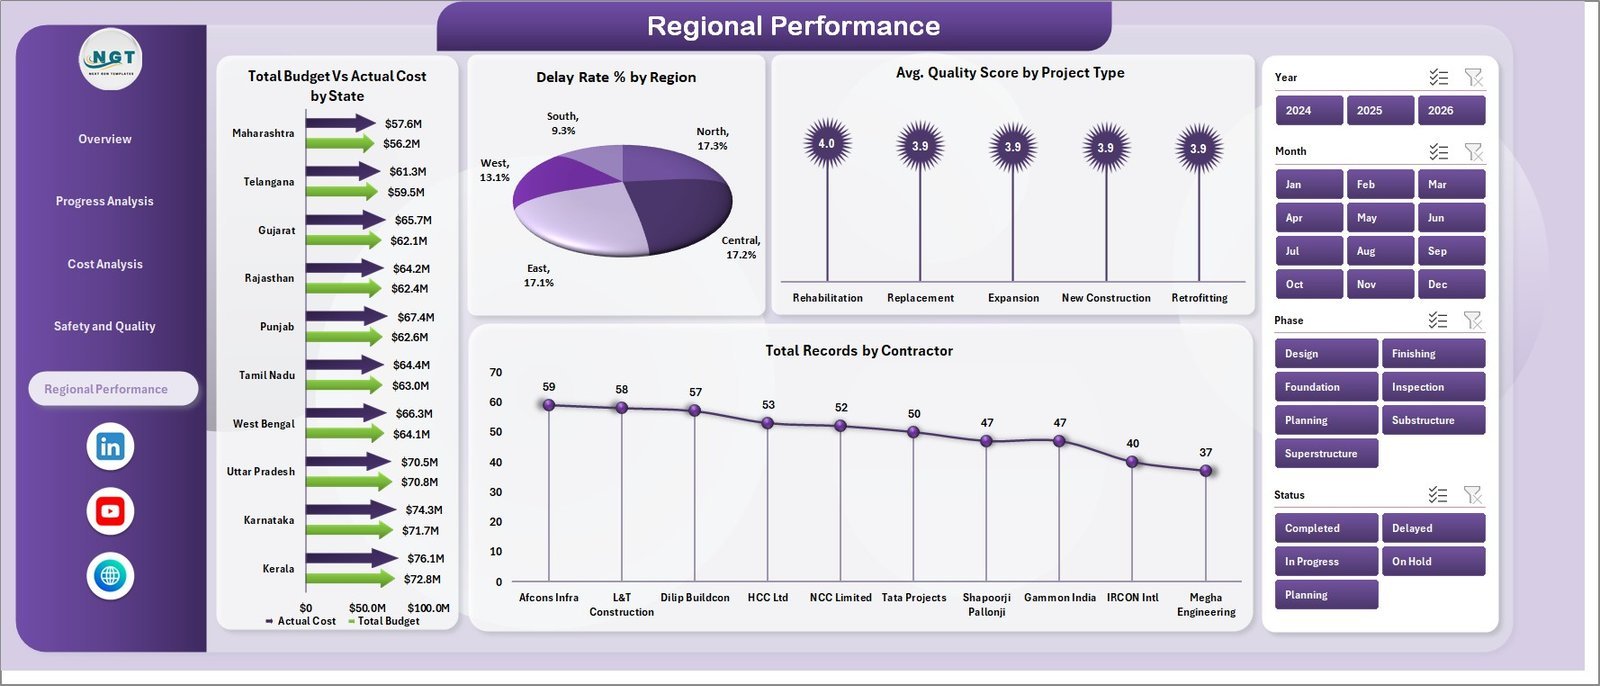
📊 Regional performance with state-level breakdown — Total Budget vs. Actual Cost by State, Delay Rate % by Region, Avg. Quality Score by Project Type, and Total Records by Contractor are all on a single Regional Performance page — ideal for regional directors managing bridge portfolios across multiple geographies.
📊 Multiple slicers on every page — Apply filters by bridge type, region, contractor, priority, and status. All slicers connect to every chart on the page, so every visual refreshes simultaneously in one click — no manual filtering across separate reports.
📊 Pivot-driven architecture with one-click refresh — All charts are built on Excel pivot tables stored in the Support sheet. After entering updated data, go to Data → Refresh All and the entire dashboard updates. No formulas to edit, no chart rebuilding required.
📦 What’s Inside the Bridge Construction Dashboard in Excel
📌 Overview Page — 5 KPI cards plus charts for Cost Variance by Bridge Type, Completion %, Total Records by Region, and Total Budget vs. Total Actual Cost by Month. Multiple slicers allow instant filtering across all visuals.
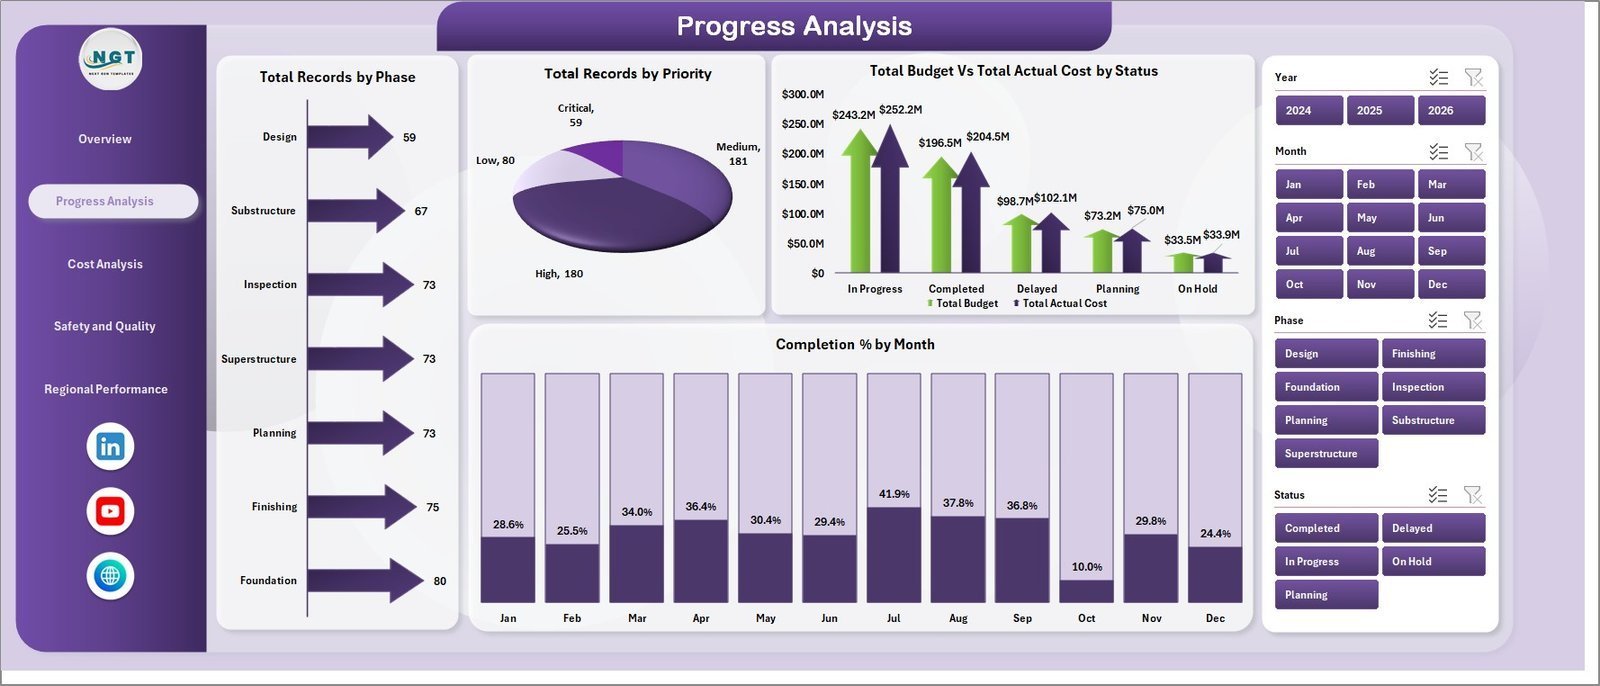
📌 Progress Analysis — Total Records by Phase, Total Records by Priority, Total Budget vs. Total Actual Cost by Status, and Completion % by Month. Use this page to identify bottlenecks and track pipeline movement across construction phases.
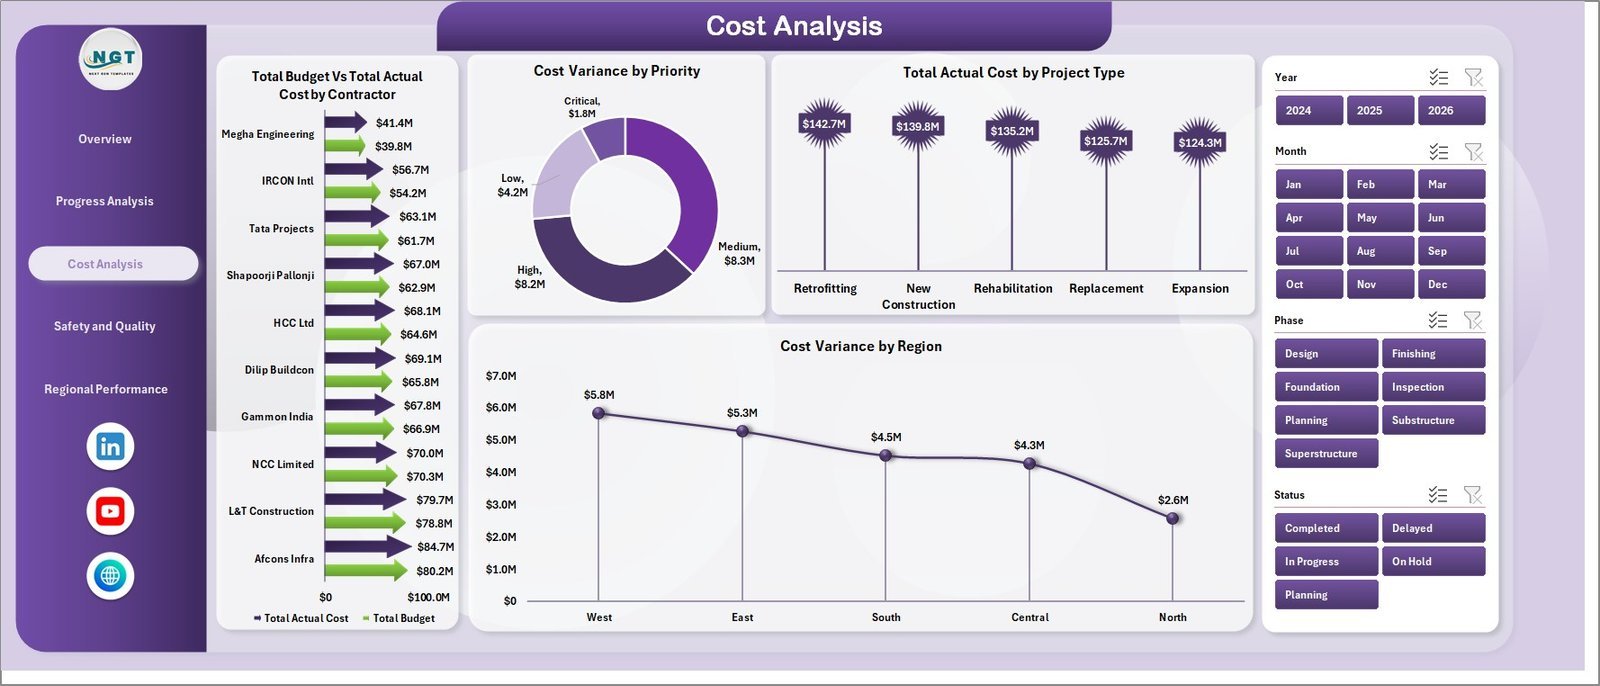
📌 Cost Analysis — Total Budget vs. Total Actual Cost by Contractor, Cost Variance by Priority, Total Actual Cost by Project Type, and Cost Variance by Region. Designed for project controllers who need contractor-level and region-level cost accountability.
📌 Safety and Quality — Total Safety Incidents by Contractor, Total Records by Inspection Result, Avg. Quality Score by Bridge Type, and Total Safety Incidents by Phase. Essential for compliance officers and site safety managers.
📌 Regional Performance — Total Budget vs. Actual Cost by State, Delay Rate % by Region, Avg. Quality Score by Project Type, and Total Records by Contractor. Built for regional managers and government infrastructure departments.
📌 Data Sheet — Enter or paste your project records here in the structured format. Each column maps directly to the dashboard KPIs and charts. No formulas to edit — just replace the sample rows with your actual project data.
📌 Support Sheet — Contains all pivot tables powering the dashboard charts. Keep it hidden during normal use. To refresh all pivots and charts after updating data, go to the Data tab in the Excel Ribbon and click Refresh All.
📊 Bridge Construction Dashboard in Excel vs. Google Sheets vs. Procore — Where This Fits
| Feature | Bridge Construction Dashboard in Excel | Google Sheets Dashboard | Procore / Autodesk |
|---|---|---|---|
| Cost | $17.99 one-time | Free (manual build) | $375–$1,200+/user/year |
| Platform | Microsoft Excel (offline) | Google Sheets (cloud) | Web/mobile SaaS |
| Setup time | Under 10 minutes | 3–8 hours | Days to weeks |
| Works offline | ✅ Yes | Limited | ❌ No |
| Cost variance by contractor & region | ✅ Built-in | Manual setup required | ✅ Yes (enterprise) |
| Safety incident tracking | ✅ Built-in | Manual setup required | ✅ Advanced |
| Regional performance by state | ✅ Built-in | Manual setup required | ✅ Yes |
| Year-1 cost at 5 users | $17.99 total | Free (time investment) | $1,875–$6,000+ |
| Subscription required | ❌ Never | ❌ Never | ✅ Annual contract |
For infrastructure teams that need contractor-level cost accountability and safety tracking without enterprise SaaS contracts, the Bridge Construction Dashboard in Excel sits in the sweet spot.
👥 Who This Template Is For — and Who It’s Not For
✅ This template is built for:
- Project managers overseeing multiple bridge and infrastructure construction projects
- Government infrastructure departments tracking regional bridge portfolio performance
- Construction contractors monitoring cost variance, delay rates, and quality scores by phase
- Safety officers and compliance teams tracking incidents by contractor and construction phase
- Finance and budget controllers who need contractor-level and priority-level cost accountability in Excel
❌ This template is NOT for:
- Teams needing real-time IoT or on-site sensor integration (requires dedicated construction SaaS)
- Enterprise organizations with 100+ concurrent users requiring role-based access controls and audit trails
- Users without Microsoft Excel 2016 or later — slicers and pivot charts require a current Excel version
⚙️ How to Use the Bridge Construction Dashboard in Excel
- Download the ZIP file and open the Excel workbook in Microsoft Excel 2016 or later.
- Go to the Data Sheet tab and replace the sample rows with your actual bridge project records.
- Click Data → Refresh All in the Excel Ribbon to update all pivot tables and charts.
- Use the slicers on any dashboard page to filter by bridge type, region, contractor, priority, or status.
- Review each page: Overview for executive summary, Progress Analysis for pipeline status, Cost Analysis for financial accountability, Safety & Quality for compliance, Regional Performance for geographic insights.
- Keep the Support Sheet hidden — it contains the pivot tables and does not need direct editing.
💼 Real-World Use Cases
Marcus manages a regional infrastructure portfolio for a state DOT. Each month, he pastes updated project records into the Data sheet and shares the refreshed dashboard with his director. The Regional Performance page shows delay rates by region and budget vs. actual by state — giving leadership the geographic breakdown needed for budget allocation, without requesting custom IT reports.
A mid-size construction contractor uses the Cost Analysis page for contractor accountability. The Cost Variance by Contractor chart immediately flags which subcontractors are running over budget each month, letting the project controller address overruns before the next billing cycle — saving an estimated 8–12% in uncontrolled cost escalation.
A site safety officer at a civil engineering firm reviews the Safety & Quality page weekly. She tracks Total Safety Incidents by Phase to identify which construction phases carry the highest risk, and uses Avg. Quality Score by Bridge Type to prioritize inspection resources — turning compliance reporting from a quarterly scramble into a weekly routine.
❓ Frequently Asked Questions
What KPIs does the Bridge Construction Dashboard in Excel track?
The Bridge Construction Dashboard in Excel tracks 5 headline KPIs — Total Budget, Total Actual Cost, Total Records, Total Safety Incidents, and Total Bridge Length — plus 19 charts covering cost variance by bridge type and contractor, completion rate by month, safety incidents by phase, regional performance by state, and quality scores by bridge type and project type.
How long does setup take?
Setup takes under 10 minutes. Open the file in Microsoft Excel, paste your project records into the Data sheet in the same format as the sample data, then click Data → Refresh All. Every KPI card, chart, and slicer updates automatically from your data without any formula editing or chart rebuilding.
Do I need any special Excel add-ins or macros?
No. The Bridge Construction Dashboard in Excel uses only standard Excel features — pivot tables, pivot charts, and slicers. No add-ins, macros, or VBA code are required. It works with Excel 2016 or later on Windows or Mac, including Excel included in Microsoft 365 subscriptions.
How does this compare to Procore or Autodesk Construction Cloud?
Procore and Autodesk Construction Cloud cost $375–$1,200+ per user per year and require implementation time measured in weeks. The Bridge Construction Dashboard in Excel is a $17.99 one-time purchase covering cost variance, safety tracking, progress analysis, and regional performance — with no subscription fees, no per-user charges, and no vendor lock-in.
Is this available for Google Sheets or Power BI?
The Bridge Construction Dashboard is currently available in Excel. For related infrastructure templates, explore the Bridge Construction KPI Dashboard in Power BI for a Power BI version, or the Construction Dashboard in HTML for a browser-based interactive dashboard that requires no Excel installation.
👤 About the Author
Built by PK — Microsoft Certified Professional with 15+ years of Excel, Google Sheets, and Power BI experience. Founder of NextGenTemplates, reaching 300K+ subscribers across YouTube channels (@PK-AnExcelExpert, @NextGenTemplates, @NeoTechNavigators). Every template is hand-built and tested before release.
🔗 Explore Related Templates
Looking for more construction and infrastructure analytics? Explore these from our Excel Dashboard Templates collection:
- 📋 Bridge Maintenance Dashboard in Excel — Track bridge maintenance records, inspection status, and repair costs.
- 🌐 Construction Dashboard in HTML — Browser-based interactive dashboard; no Excel installation required.
- 📐 Architecture & Design Report in Excel — Structured project reporting for design and architecture firms.
📖 Click here to read the Detailed Blog Post
🎥 Visit our YouTube channel for step-by-step video tutorials
👉 YouTube.com/@NextGenTemplates
📅 Last updated: May 2026
Watch the step-by-step video tutorial:
YouTube


Reviews
There are no reviews yet.