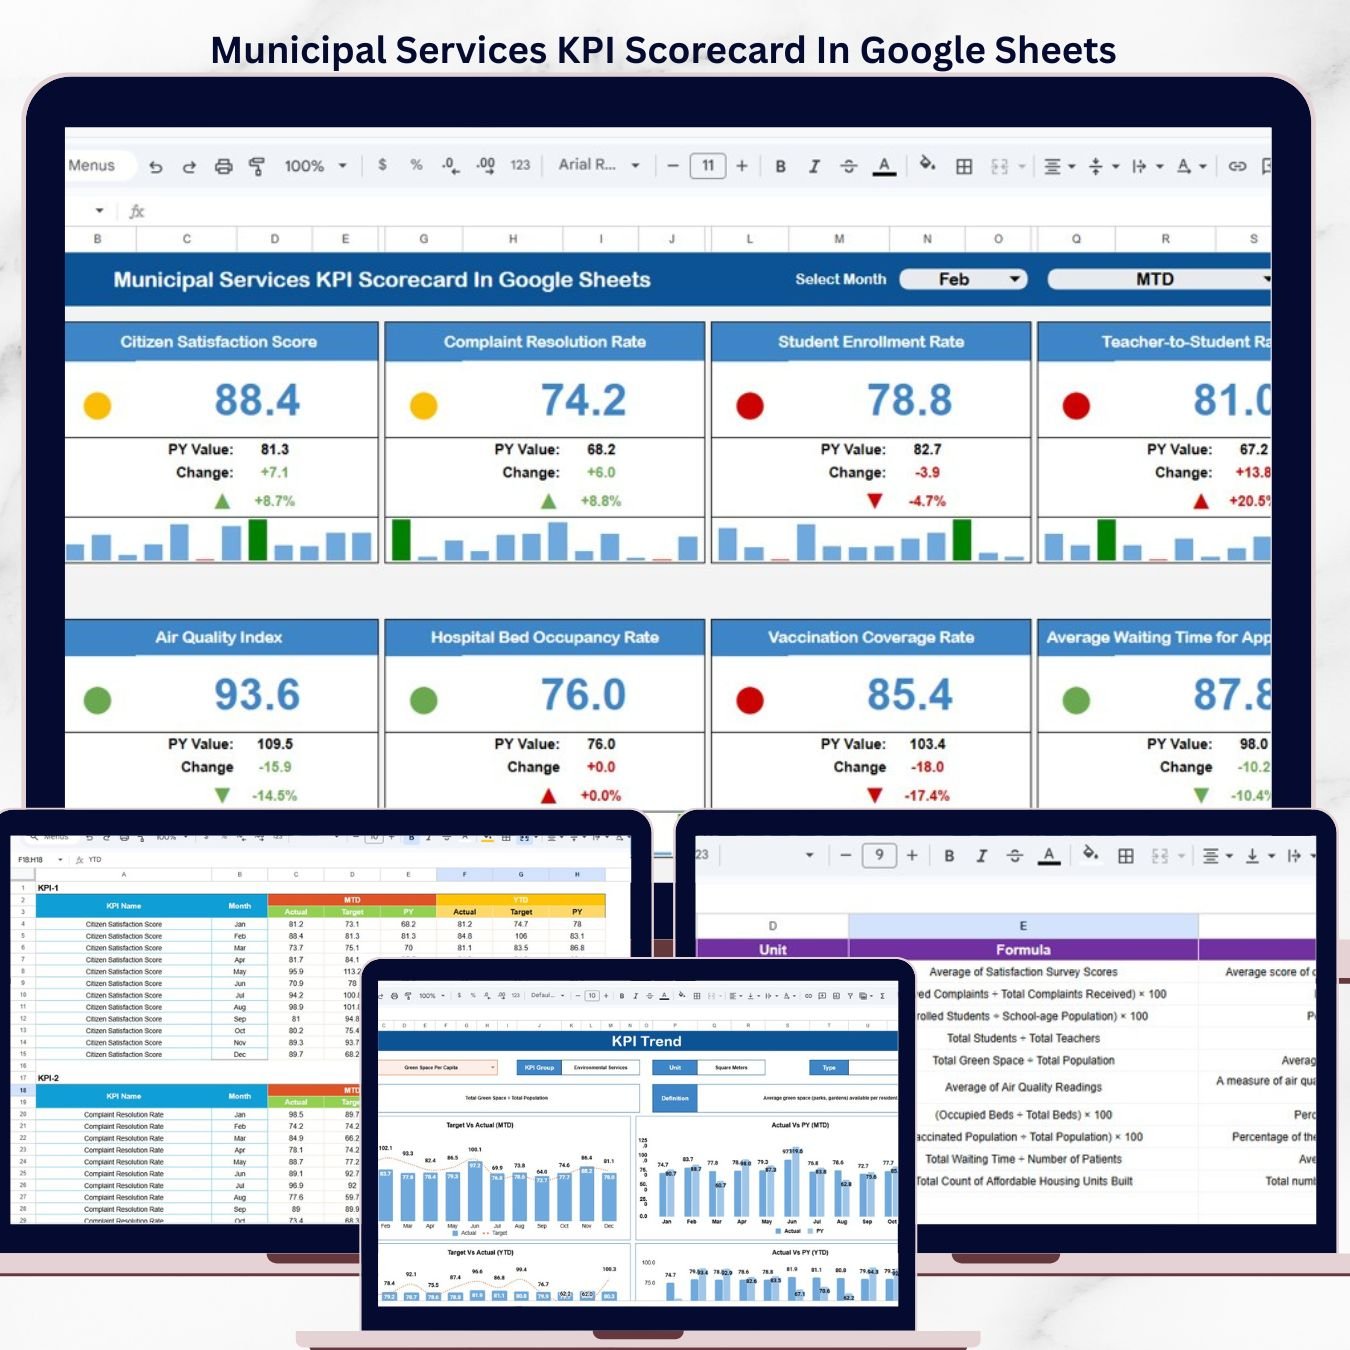
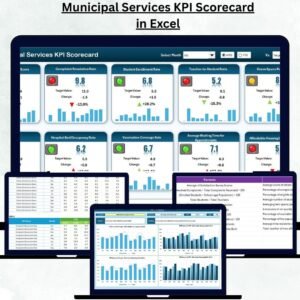
The Municipal Services KPI Scorecard in Google Sheets tracks 15+ municipal performance indicators across 4 structured worksheets, with MTD and YTD comparisons, trend charts, and color-coded conditional formatting. According to the International City/County Management Association (ICMA), municipalities that track service delivery KPIs see 18-25% faster issue resolution compared to those relying on ad-hoc reporting.
This ready-to-use Google Sheets scorecard gives city administrators, municipal planners, and public service managers a structured way to monitor departmental performance — from waste collection and water supply to road maintenance and citizen satisfaction — without paying for monthly government analytics software. Replace the sample data with your own numbers and every chart, indicator, and summary updates automatically in under 10 minutes.
🌍 Join 8,400+ teams in 40+ countries using NextGenTemplates to replace paid SaaS tools with one-time-purchase Excel, Google Sheets, Power BI, and HTML templates.
✅ Instant download · One-time payment · No subscription · No per-user fees · Lifetime access
Municipal Services KPI Scorecard In Google Sheets
🔑 Key Features of Municipal Services KPI Scorecard In Google Sheets
The Municipal Services KPI Scorecard in Google Sheets includes 4 dedicated worksheets: Scorecard, KPI Trend, Input Data, and KPI Definition. It tracks 15+ pre-built KPIs including waste collection efficiency, water quality compliance, streetlight uptime, emergency response time, road maintenance completion rate, revenue collection rate, citizen satisfaction score, and public safety metrics.
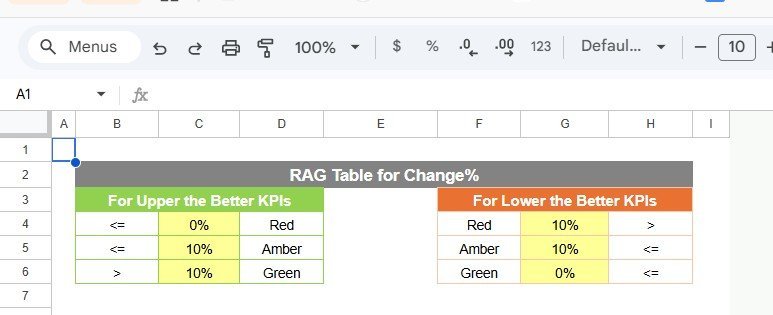
Each KPI is classified as “Upper the Better” or “Lower the Better” to ensure correct benchmarking. The scorecard uses conditional formatting with traffic-light color coding — green for on-track, red for below-target — so managers identify underperforming areas at a glance. Dropdown menus let you toggle between any month and switch between MTD and YTD views without modifying formulas.
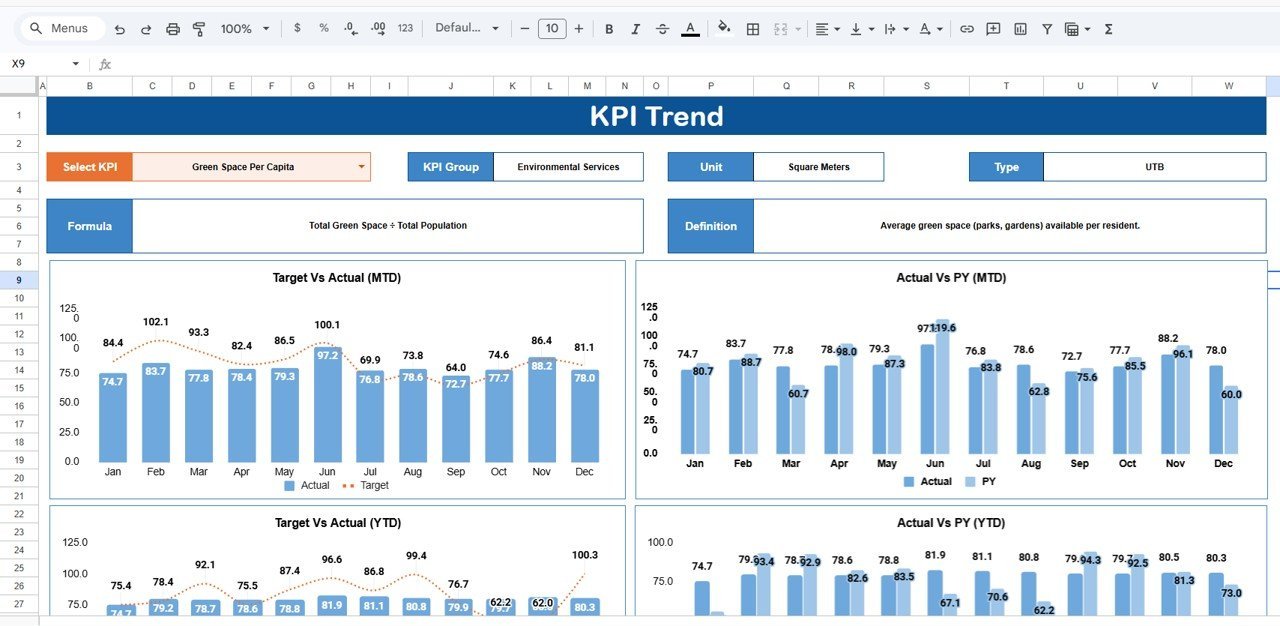
The KPI Trend sheet generates visual charts comparing Actual vs Target vs Prior Year data for any selected metric. This year-over-year trend analysis is commonly requested by city councils and oversight boards when reviewing quarterly performance reports.
Because this template runs in Google Sheets, multiple team members across departments can access and update data simultaneously from any device — no desktop installation needed.
📦 What’s Inside the Municipal Services KPI Scorecard In Google Sheets
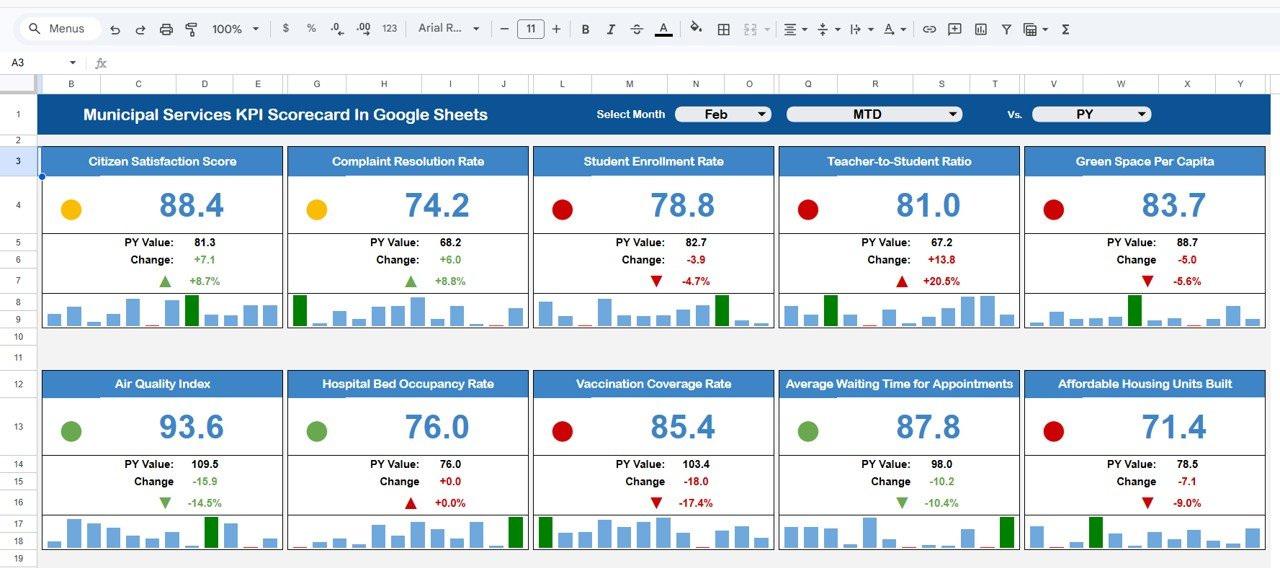
📊 Scorecard Sheet — Main dashboard displaying all KPIs with traffic light indicators, performance arrows, and MTD/YTD comparisons. Includes dropdown menus for month selection and period toggle.
📈 KPI Trend Sheet — Select any KPI from the dropdown to view its group, unit, formula, definition, and type. MTD and YTD trend charts plot Actual, Target, and Prior Year numbers side by side.
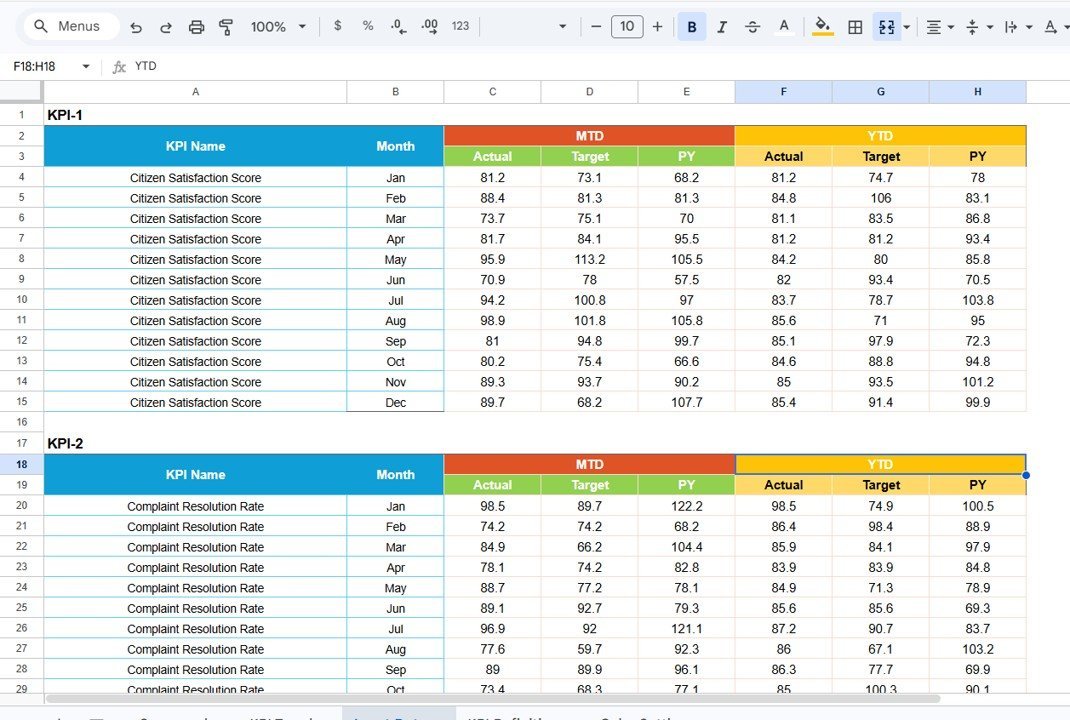
📝 Input Data Sheet — Enter actual values, targets, and prior year data for each KPI by month. One row per KPI, one column per month. All dashboards refresh automatically.
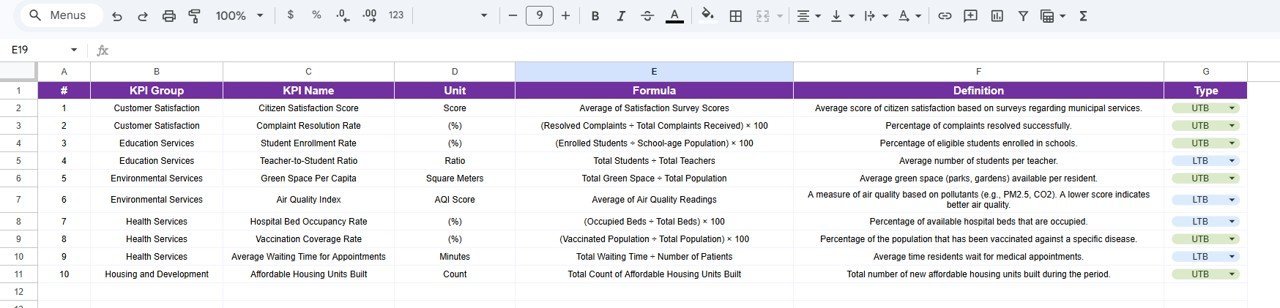
📘 KPI Definition Sheet — Document KPI Name, KPI Group, Unit, Formula, and Definition. Ensures every department uses the same metric definitions for consistent reporting.
☁️ Cloud-Based Access — Access your scorecard from any device, share with stakeholders via Google Drive, and collaborate in real time.
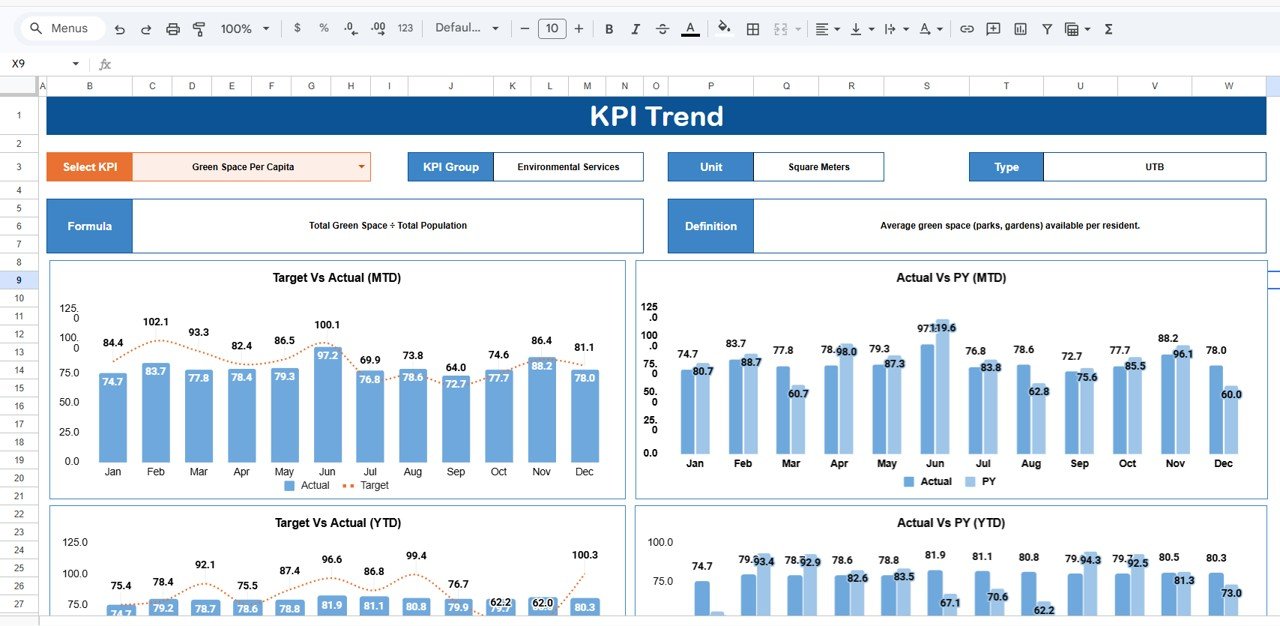
KPI Trend Sheet
📊 Municipal Services KPI Scorecard vs. Microsoft Excel Dashboard vs. Paid Government Analytics — Where This Fits
| Feature | Municipal Services KPI Scorecard (Google Sheets) | Microsoft Excel Dashboard | Paid Government Analytics (CityBase / OpenGov) |
|---|---|---|---|
| Cost | $8.99 one-time | $14.99 one-time (Excel version) | $500-2,000/month |
| Platform | Google Sheets (cloud) | Excel Desktop | Web-based SaaS |
| Setup Time | Under 10 minutes | Under 10 minutes | 2-8 weeks onboarding |
| Real-time Team Collaboration | ✅ Built-in | Limited (OneDrive) | ✅ Yes |
| Mobile Access | ✅ Any browser | Excel Mobile (limited) | ✅ Yes |
| Customizable KPIs | ✅ Fully editable | ✅ Fully editable | Requires admin setup |
| Year-1 Cost (5 users) | $8.99 total | $14.99 total | $6,000-24,000 |
| No IT Dependency | ✅ Yes | ✅ Yes | ❌ Requires IT support |
| Trend Analysis Charts | ✅ Built-in | ✅ Built-in | ✅ Advanced |
For municipal teams that want structured KPI tracking without paying $500+/month for government analytics software, the Municipal Services KPI Scorecard in Google Sheets sits in the sweet spot.
👥 Who This Template Is For — and Who It’s Not For
✅ This template is built for:
- City administrators and municipal corporation managers tracking 10-20 departmental KPIs
- Urban planners and public works directors monitoring infrastructure and service delivery
- Small-to-medium municipalities (10,000-500,000 population) needing structured performance reporting
- NGOs and development agencies tracking public service delivery in partner cities
❌ This template is NOT for:
- Large metro governments needing real-time IoT sensor integration and GIS mapping
- Organizations requiring SOC 2 compliance and enterprise-grade access controls
- Teams that need automated data feeds from SCADA or ERP systems
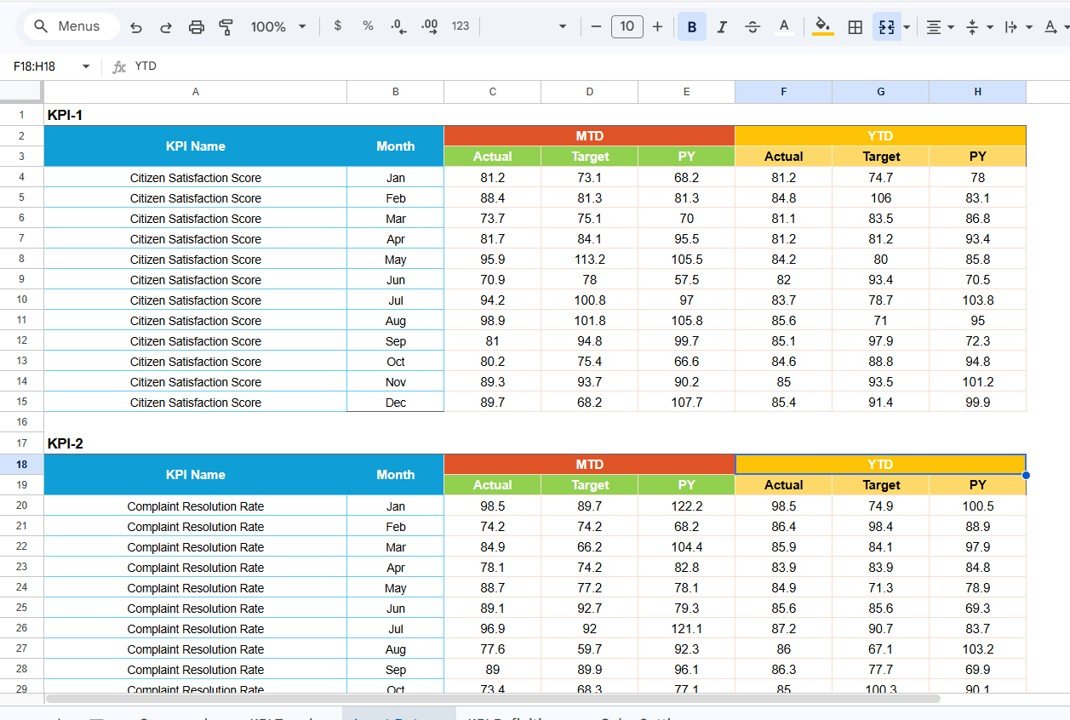
Input Data Sheet
⚙️ How to Use the Municipal Services KPI Scorecard In Google Sheets
1️⃣ Open the Google Sheets template using the copy link in the PDF guide.
2️⃣ Go to the KPI Definition sheet and customize KPI names, groups, units, and formulas for your municipality.
3️⃣ Enter monthly actual values, targets, and prior year data in the Input Data sheet.
4️⃣ Navigate to the Scorecard sheet, select the month from the dropdown, and toggle MTD or YTD.
5️⃣ Use the KPI Trend sheet to analyze individual metric performance over time.
6️⃣ Share the Google Sheet with department heads and council members for collaborative review.
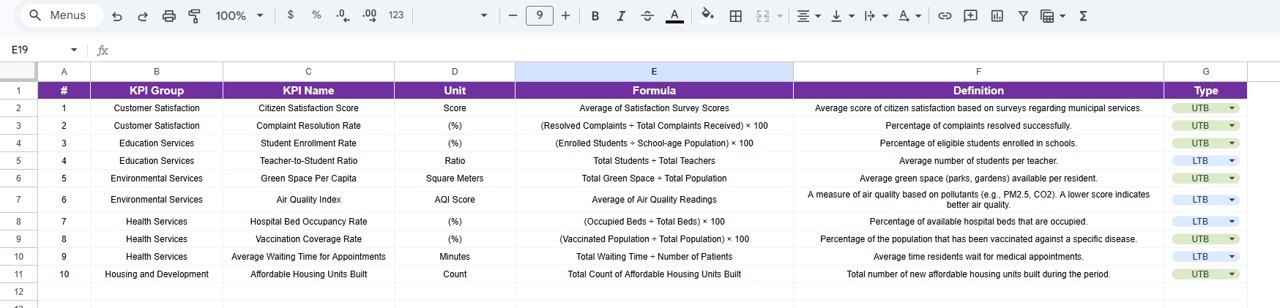
KPI Definition Sheet
💼 Real-World Use Cases
Ravi manages public works for a 150,000-population city in India. He uses the Municipal Services KPI Scorecard in Google Sheets to track road maintenance completion rates, streetlight uptime, and waste collection efficiency across 8 municipal zones. Before this template, his team spent 2 days per month compiling reports manually. Now the scorecard updates automatically, and he presents data-backed results to the city council in under 30 minutes.
Maria leads citizen services for a county government in the Philippines. She tracks 12 KPIs including emergency response time, water quality compliance, and citizen satisfaction scores. The Google Sheets format lets her share live dashboards with field supervisors on mobile devices — no software licenses needed.
David runs sustainability reporting for a mid-size European municipality. He uses the YTD trend analysis to compare recycling rates and energy consumption against annual targets, generating quarterly reports for the city’s environmental compliance board.
❓ Frequently Asked Questions
What KPIs does the Municipal Services KPI Scorecard in Google Sheets track?
The Municipal Services KPI Scorecard in Google Sheets tracks 15+ KPIs including waste collection efficiency, water quality compliance, streetlight uptime, emergency response time, road maintenance completion, revenue collection rate, and citizen satisfaction. All KPIs are fully customizable.
How long does setup take?
Setup takes under 10 minutes. Open the template via the Google Sheets copy link, replace the sample data with your own municipal data, and every chart and indicator updates automatically. No formulas to edit manually.
Can I add my own KPIs to the scorecard?
Yes. The KPI Definition sheet lets you add, rename, or remove any KPI. Enter the KPI name, group, unit, formula, and definition, and the scorecard integrates it into all dashboards and trend charts automatically.
How does this compare to paid government analytics software like OpenGov?
The Municipal Services KPI Scorecard in Google Sheets costs $8.99 one-time versus $500-2,000 per month for OpenGov or CityBase. It covers the same core KPI tracking functionality — MTD/YTD analysis, trend charts, and conditional formatting — without requiring IT setup or per-user licensing.
Does this template work on mobile devices?
Yes. Since it runs in Google Sheets, you can access the scorecard from any smartphone, tablet, or computer with a web browser. Field supervisors can view and update data on the go using the Google Sheets mobile app.
Can multiple departments use this scorecard simultaneously?
Yes. Google Sheets supports real-time collaboration. Multiple users can view and edit the scorecard simultaneously. You can also set view-only permissions for council members or external reviewers.
Is this template available in Excel?
Yes. The Municipal Services KPI Scorecard in Excel is available separately with the same structure and KPIs, designed for organizations that prefer Microsoft Excel over Google Sheets.
👤 About the Author
Built by PK — Microsoft Certified Professional with 15+ years of Excel, Google Sheets, and Power BI experience. Founder of NextGenTemplates, reaching 300K+ subscribers across YouTube channels (@PK-AnExcelExpert, @NextGenTemplates, @NeoTechNavigators). Every template is hand-built and tested before release.
🔗 Explore Related Templates
📊 Municipal Services KPI Scorecard in Excel — Same template structure in Excel format for desktop users.
📊 Water Supply KPI Scorecard in Google Sheets — Track water distribution, quality compliance, and supply interruptions.
📊 Waste Management KPI Scorecard in Google Sheets — Monitor waste collection, recycling rates, and landfill diversion.
📊 Recycling KPI Scorecard in Google Sheets — Track recycling performance and environmental sustainability metrics.
📊 Smart Cities KPI Scorecard in Excel — Monitor urban performance, infrastructure, and sustainability KPIs.
Browse all Google Sheets KPI Dashboard Templates
📖 Click here to read the Detailed Blog Post
🎥 Visit our YouTube channel for step-by-step video tutorials
👉 YouTube.com/@NextGenTemplates


Reviews
There are no reviews yet.