

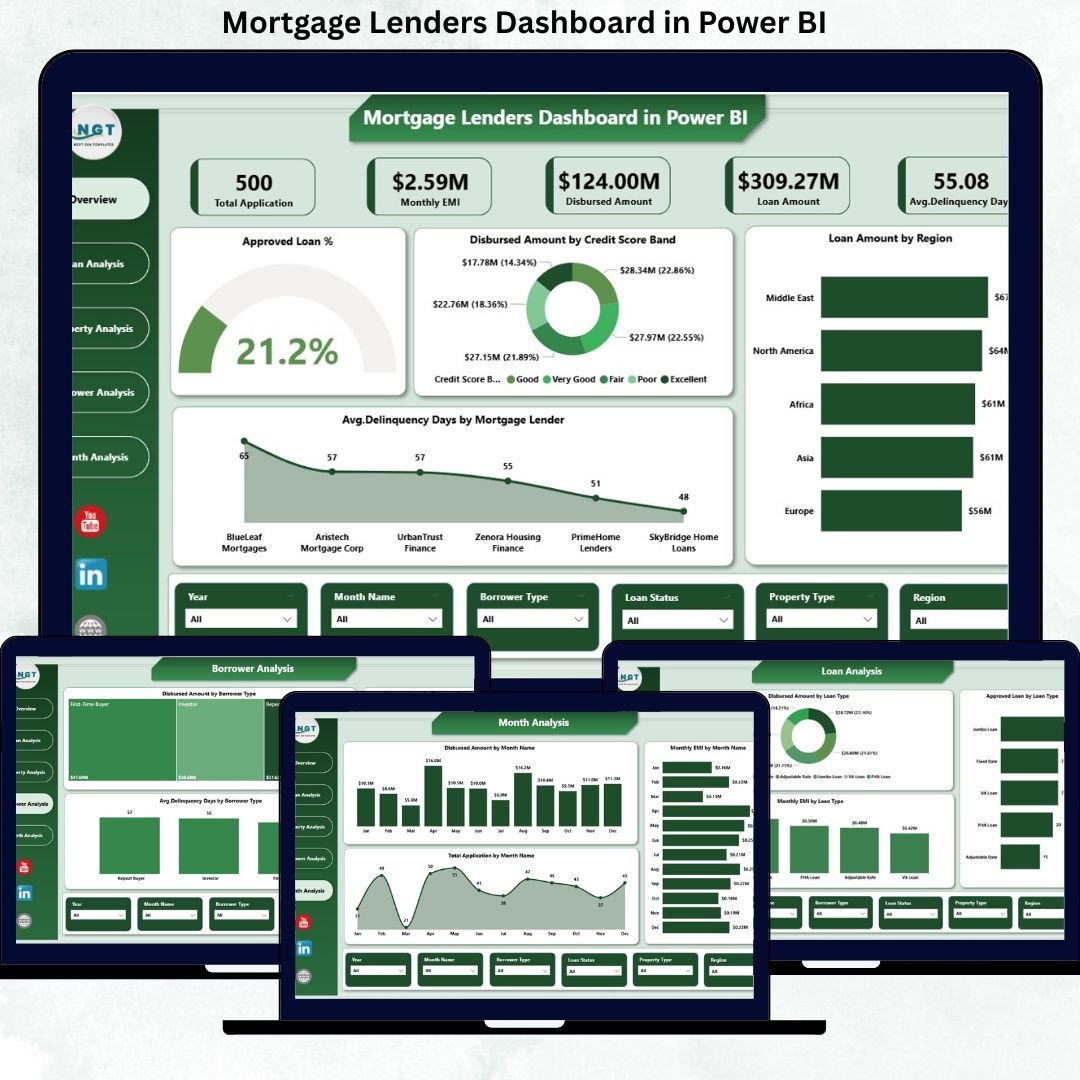

The mortgage industry moves fast—and every delay, misjudgment, or blind spot increases risk. Lenders must continuously track loan approvals, disbursements, delinquency, borrower behavior, regional performance, and monthly demand trends. However, when this information remains scattered across spreadsheets and static reports, decision-making becomes slow and reactive.
That is exactly why the Mortgage Lenders Dashboard in Power BI becomes a mission-critical analytics solution.
This ready-to-use, interactive Power BI dashboard transforms raw mortgage data into clear KPIs, visual insights, and actionable trends—all in one centralized platform. Instead of manually consolidating reports, lenders, analysts, and executives gain real-time visibility into portfolio performance, credit risk, and growth opportunities.
Built for modern mortgage operations, this dashboard helps organizations reduce risk, improve efficiency, and make smarter lending decisions—without technical complexity.
🔑 Key Features of Mortgage Lenders Dashboard in Power BI
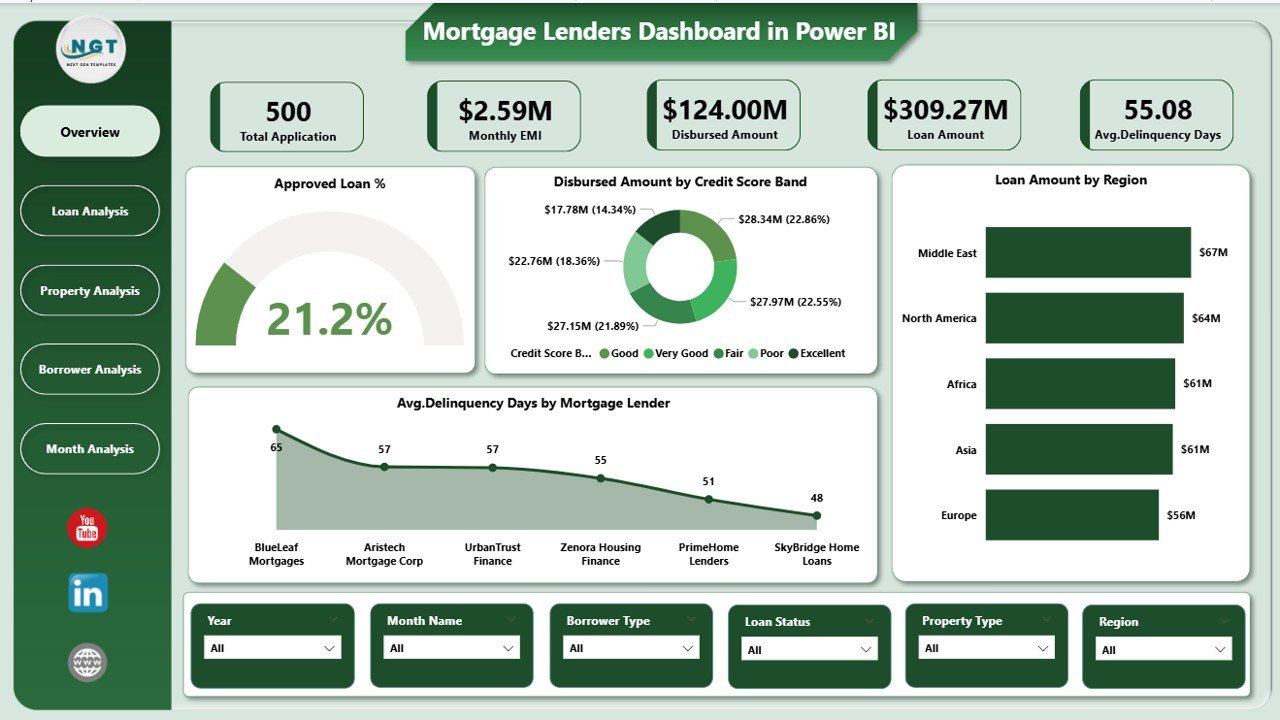
📊 Centralized Mortgage KPI Monitoring
Track approvals, disbursements, delinquency, lenders, and borrowers from one unified dashboard.
✅ Loan Approval Performance Analysis
Monitor approved loan % by lender, loan type, property type, and borrower segment.
💰 Disbursed Amount Visibility
Analyze disbursement trends by region, credit score band, loan type, and property type.
⚠️ Delinquency Risk Tracking
Identify high-risk lenders and borrower segments using average delinquency days.
👥 Borrower Behavior Insights
Understand repayment and risk patterns across borrower types.
🏘️ Property & Loan Type Analysis
Evaluate performance across residential, commercial, and other property categories.
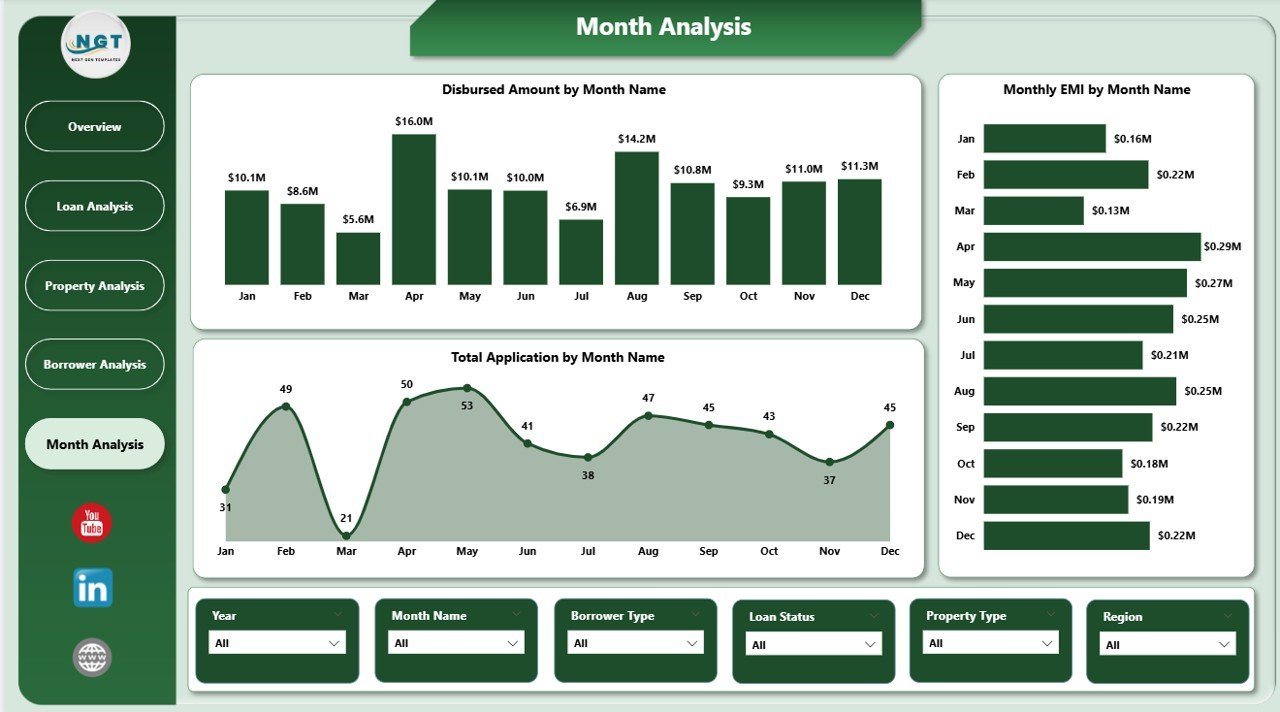
📅 Monthly Trend Monitoring
Track applications, EMI, and disbursements over time to support forecasting.
⚡ Interactive Power BI Visuals
Use slicers and filters to explore insights instantly without technical skills.
📂 What’s Inside the Mortgage Lenders Dashboard in Power BI
📁 Overview Page – High-level snapshot with KPI cards and strategic charts
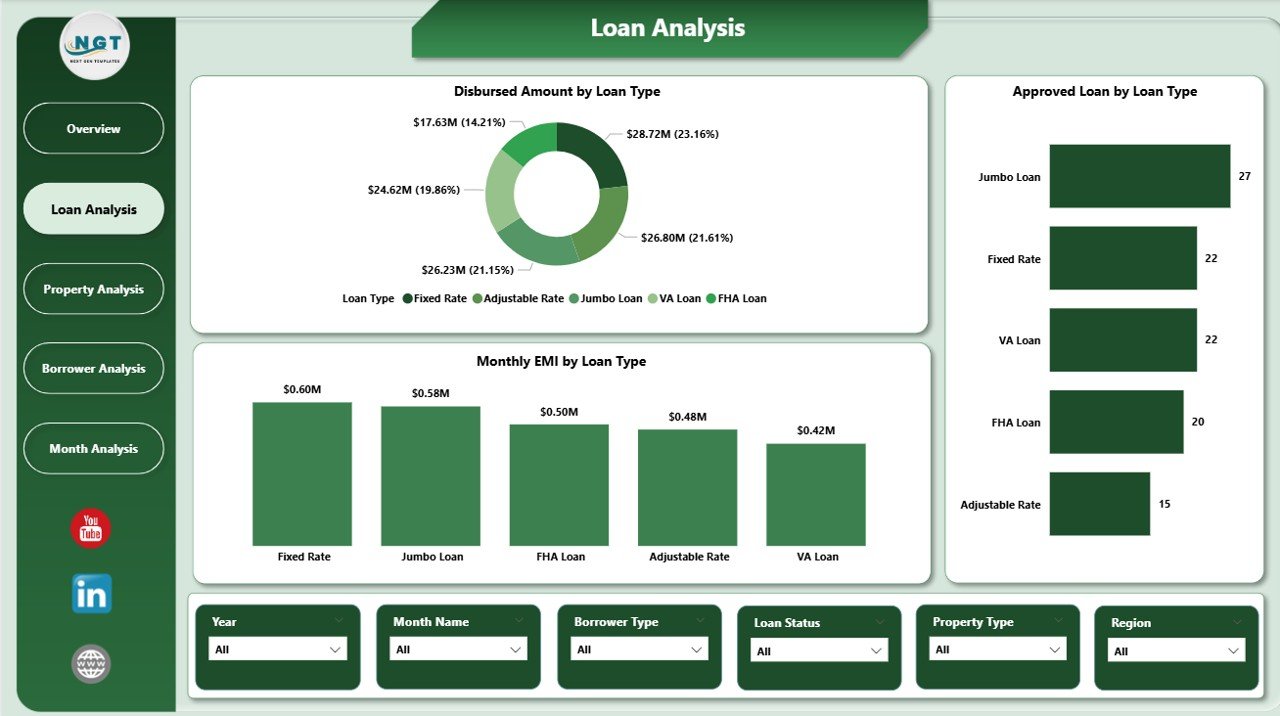
📁 Loan Analysis Page – Performance insights by loan type
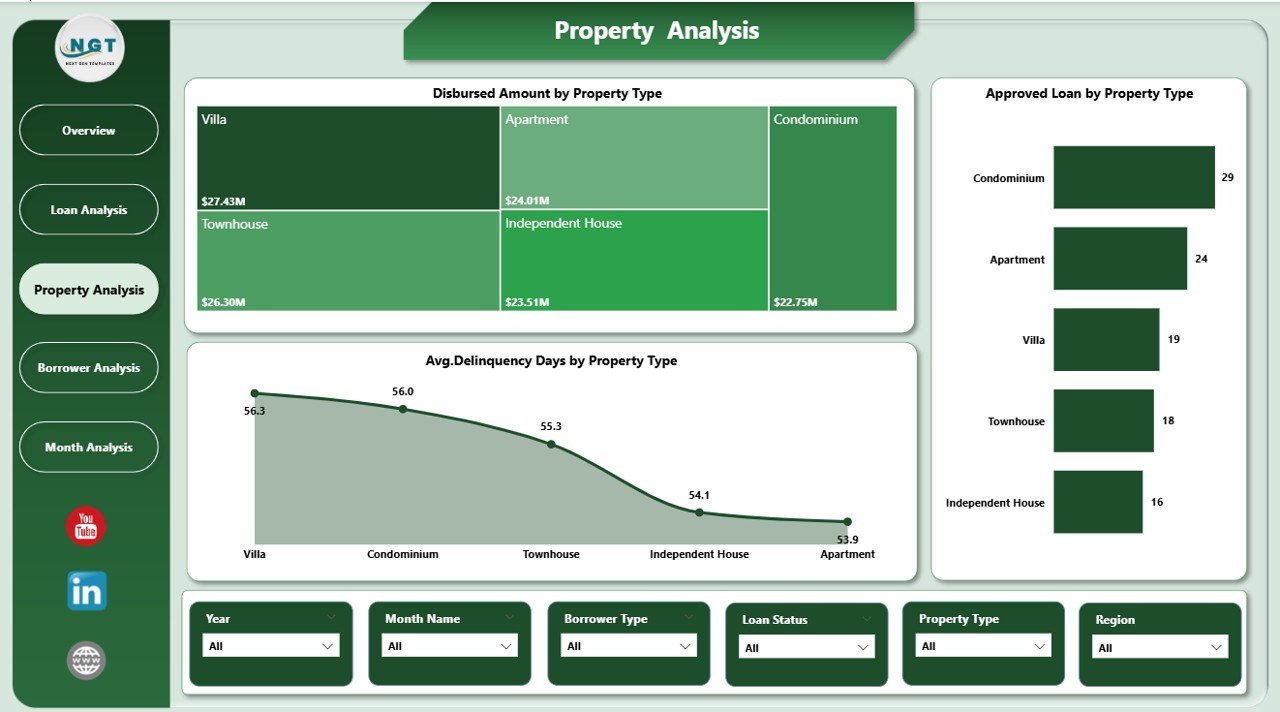
📁 Property Analysis Page – Mortgage performance by property category
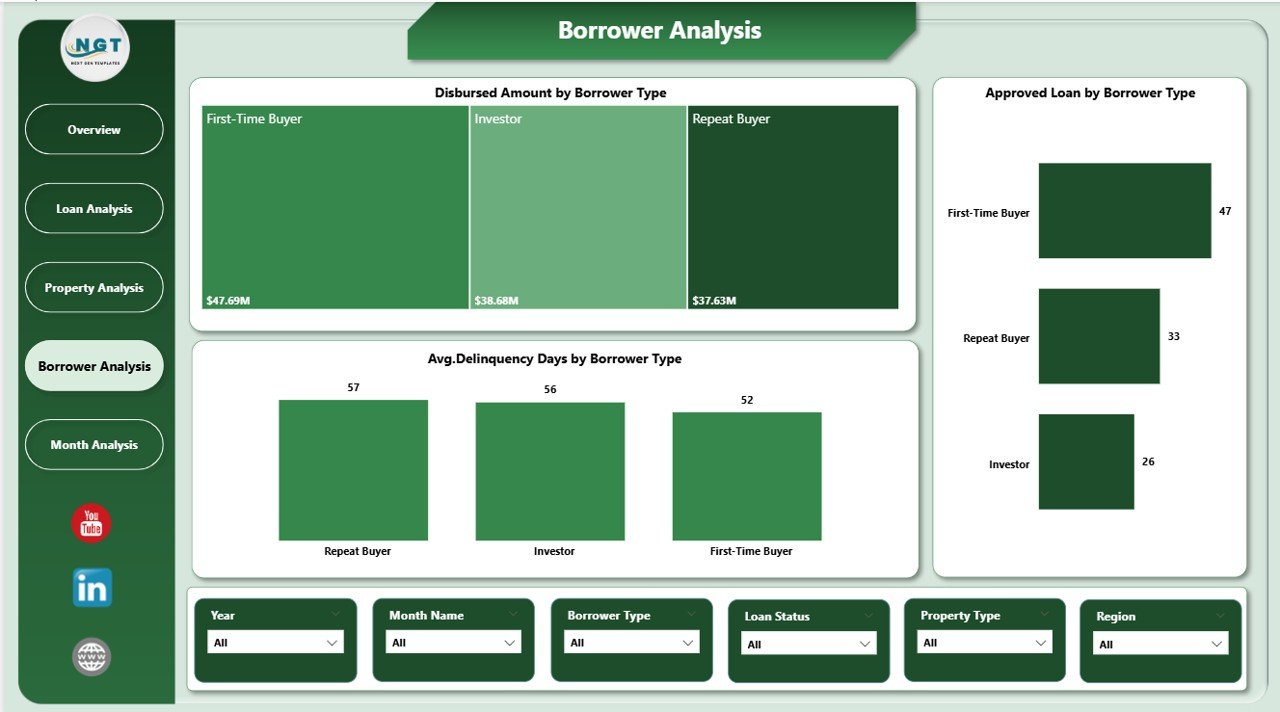
📁 Borrower Analysis Page – Risk and performance analysis by borrower type
📁 Monthly Trends Page – Time-based trends for applications, EMI, and disbursements
Together, these pages deliver a complete mortgage performance intelligence system.
🛠️ How to Use the Mortgage Lenders Dashboard in Power BI
1️⃣ Prepare mortgage data in Excel, databases, or loan management systems
2️⃣ Load or refresh the data in Power BI
3️⃣ Use slicers to filter by lender, region, loan type, borrower type, or time period
4️⃣ Review KPI cards for instant performance status
5️⃣ Analyze charts to identify risk areas and growth opportunities
6️⃣ Use monthly trends for planning, forecasting, and strategy
The dashboard is intuitive, visual, and easy to adopt—no advanced Power BI skills required.
👥 Who Can Benefit from This Mortgage Lenders Dashboard in Power BI
🏦 Mortgage lenders and banks
📊 Credit risk and financial analysts
📋 Loan operations managers
💼 Portfolio and strategy teams
📈 Senior management and executives
🏢 Small, mid-size, and large mortgage institutions
If your organization manages mortgage approvals, risk, and portfolio growth, this dashboard delivers immediate value.
📘 Click here to read the Detailed blog post
🎥 Visit our YouTube channel to learn step-by-step video tutorials
👉 YouTube Channel
Watch the step-by-step video tutorial:
Compatibility and Requirements
- Works in Power BI Desktop, which is free from Microsoft. See Get Power BI Desktop.
- You refresh the dashboard with your own mortgage data from Excel, databases or loan management systems.
Frequently Asked Questions
Which pages are included?
Five pages: Overview, Loan Analysis, Property Analysis, Borrower Analysis and Monthly Trends.
What data can I load?
Mortgage data from Excel, databases or loan management systems. Load or refresh it in Power BI and the visuals update.
Can I filter by lender, region or loan type?
Yes. Slicers let you filter by lender, region, loan type, borrower type or time period.
Does it track delinquency?
Yes. It shows average delinquency days so you can spot high-risk lenders and borrower segments.
Do I need advanced Power BI skills?
No. The dashboard uses KPI cards, charts and slicers that you click to explore.
Is there an Excel version?
Yes. See the Mortgage Lenders Dashboard in Excel.
Related Mortgage and Dashboard Templates
- Mortgage Lenders Dashboard in Excel: the same dashboard topic in Excel
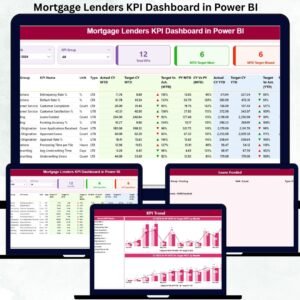
- Mortgage Lenders KPI Dashboard in Power BI: a KPI-focused Power BI edition
- Mortgage Lenders KPI Dashboard in Excel: KPI view in Excel
- Mortgage Payoff Tracker in Google Sheets: track mortgage payoff in Google Sheets
- Power BI Dashboard Mega Collection: 15 Power BI dashboards in one download
Browse all Power BI dashboards.


































Reviews
There are no reviews yet.