

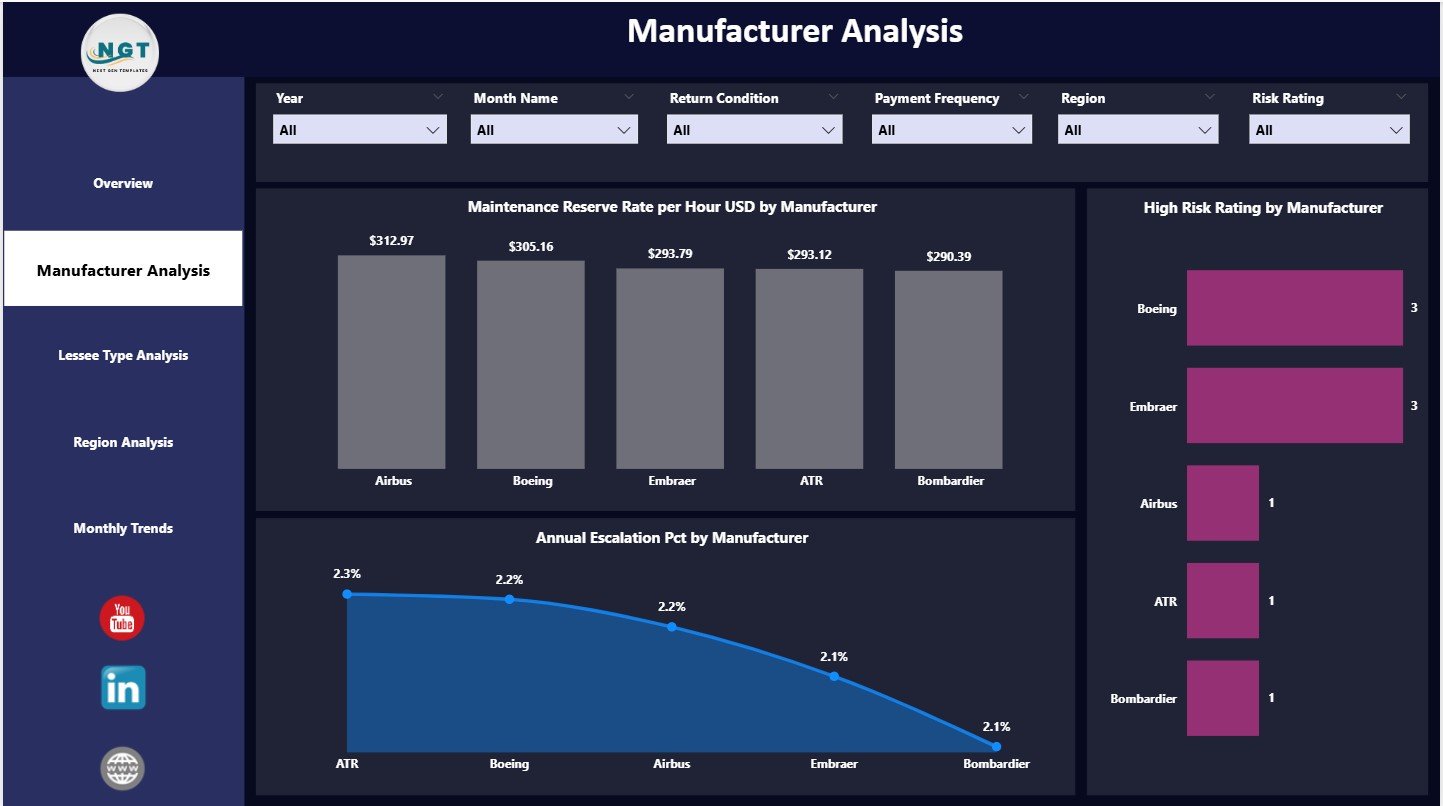

Aircraft leasing is a high-value, high-risk business where visibility, accuracy, and speed of decision-making define success. When lease revenue data, maintenance reserves, deposits, and risk indicators remain spread across spreadsheets and static reports, even small delays can lead to costly mistakes.
The Aircraft Leasing Dashboard in Power BI is designed to eliminate that risk. 🚀
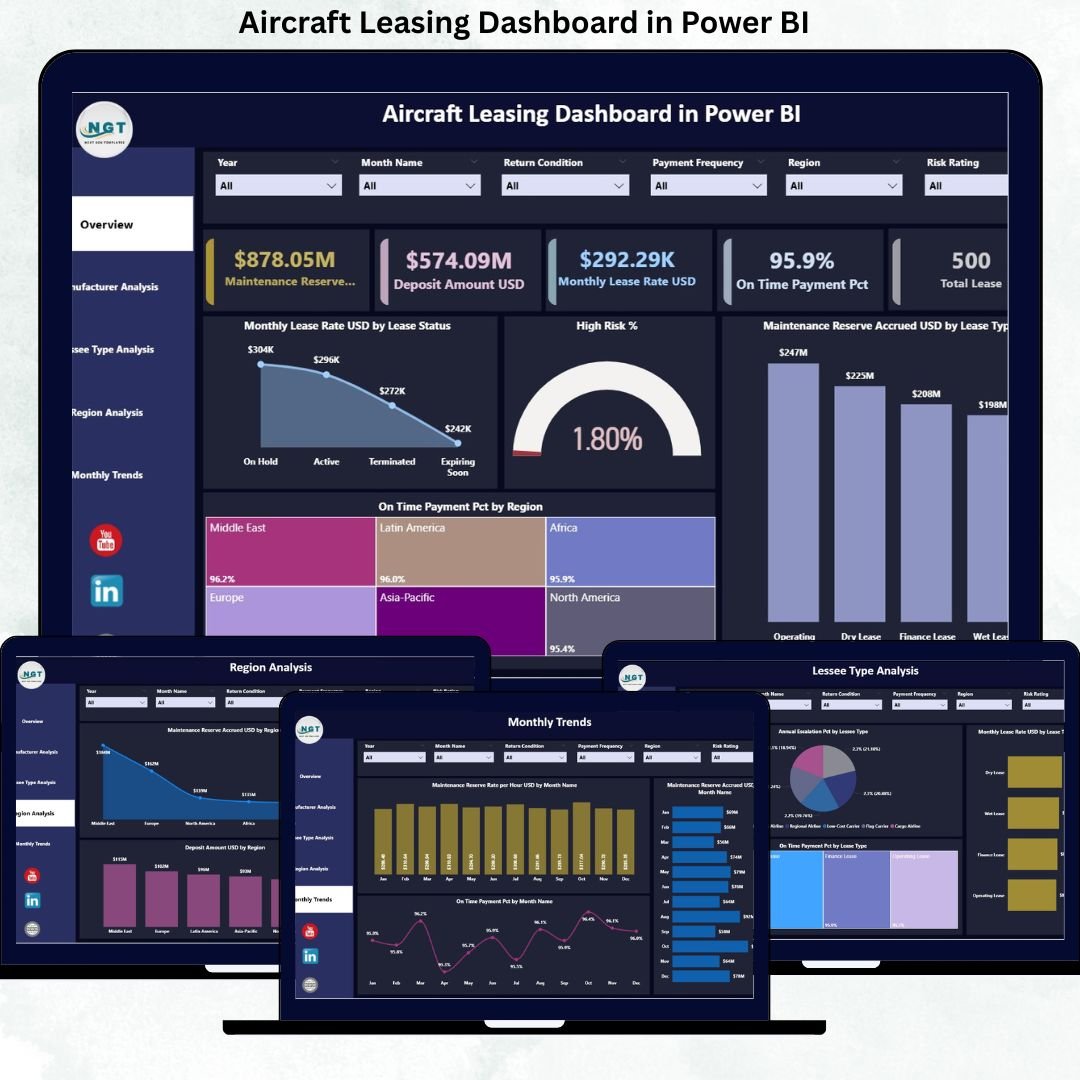
This powerful, ready-to-use dashboard converts complex leasing data into clear visuals, focused KPIs, and actionable insights—all in one centralized Power BI report.
Built for aircraft lessors, aviation finance teams, and asset managers, this dashboard helps you monitor portfolio health, control financial exposure, analyze risk, and track performance across manufacturers, lessees, regions, and time periods with confidence.
🔑 Key Features of Aircraft Leasing Dashboard in Power BI
📊 Centralized Leasing KPI Monitoring
Track lease rates, deposits, maintenance reserves, payment performance, and risk metrics in one dashboard.
💰 Financial Performance Visibility
Monitor monthly lease rates, accrued maintenance reserves, and deposit values clearly.
⚠️ Risk Identification & Control
Highlight high-risk leases and payment behavior instantly through visual indicators.
🌍 Region-Wise Performance Analysis
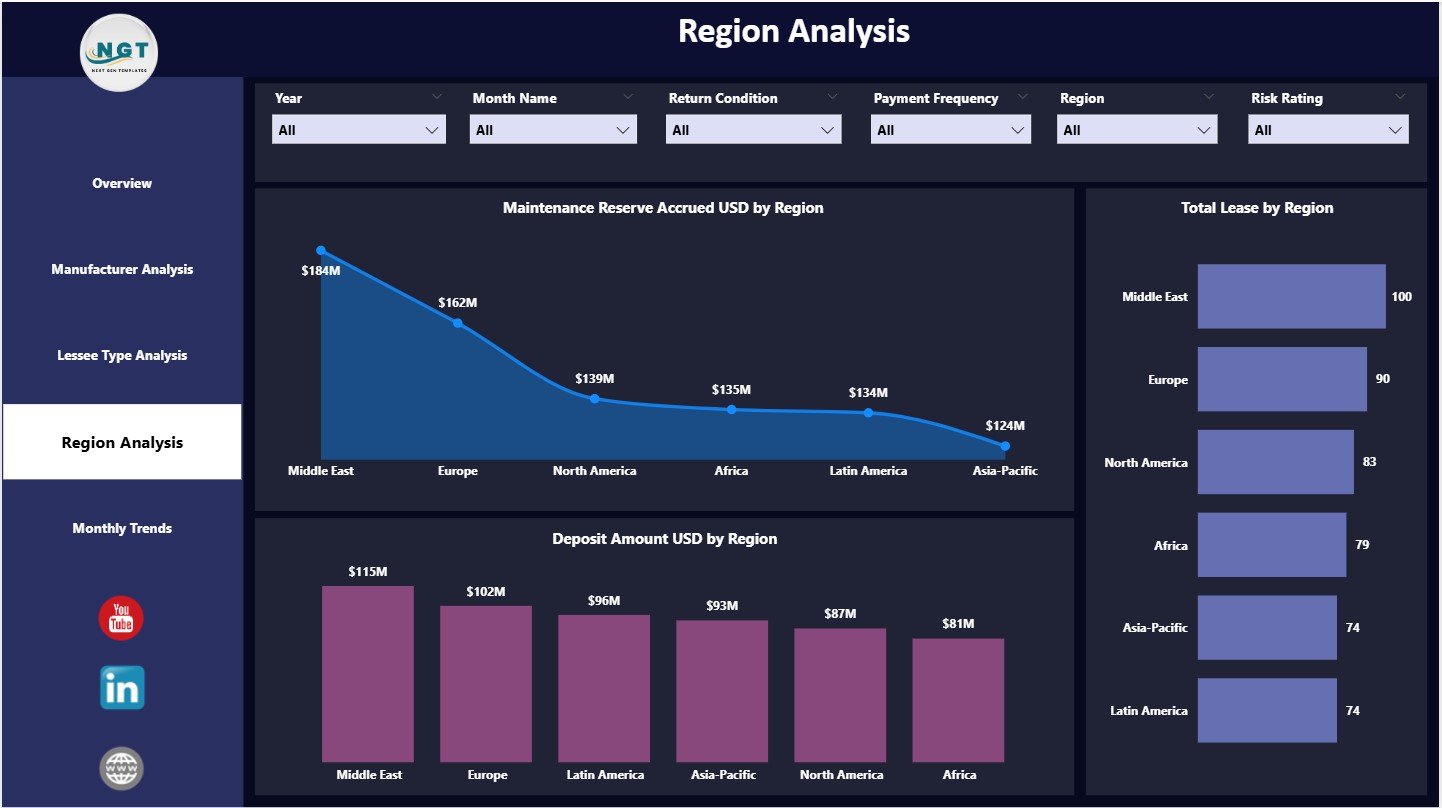
Analyze lease exposure, deposits, and reserve accumulation across regions.
🏭 Manufacturer & Lessee Insights
Understand how aircraft manufacturers and lessee types impact risk and revenue.
📈 Monthly Trend Analysis
Track how key leasing metrics evolve over time to detect early warning signs.
⚡ Interactive Power BI Experience
Use slicers, filters, and drilldowns for fast, decision-ready analysis.
📂 What’s Inside the Aircraft Leasing Dashboard in Power BI
📌 Overview Page
An executive summary page with KPI cards and charts showing overall lease performance, risk exposure, and payment behavior.
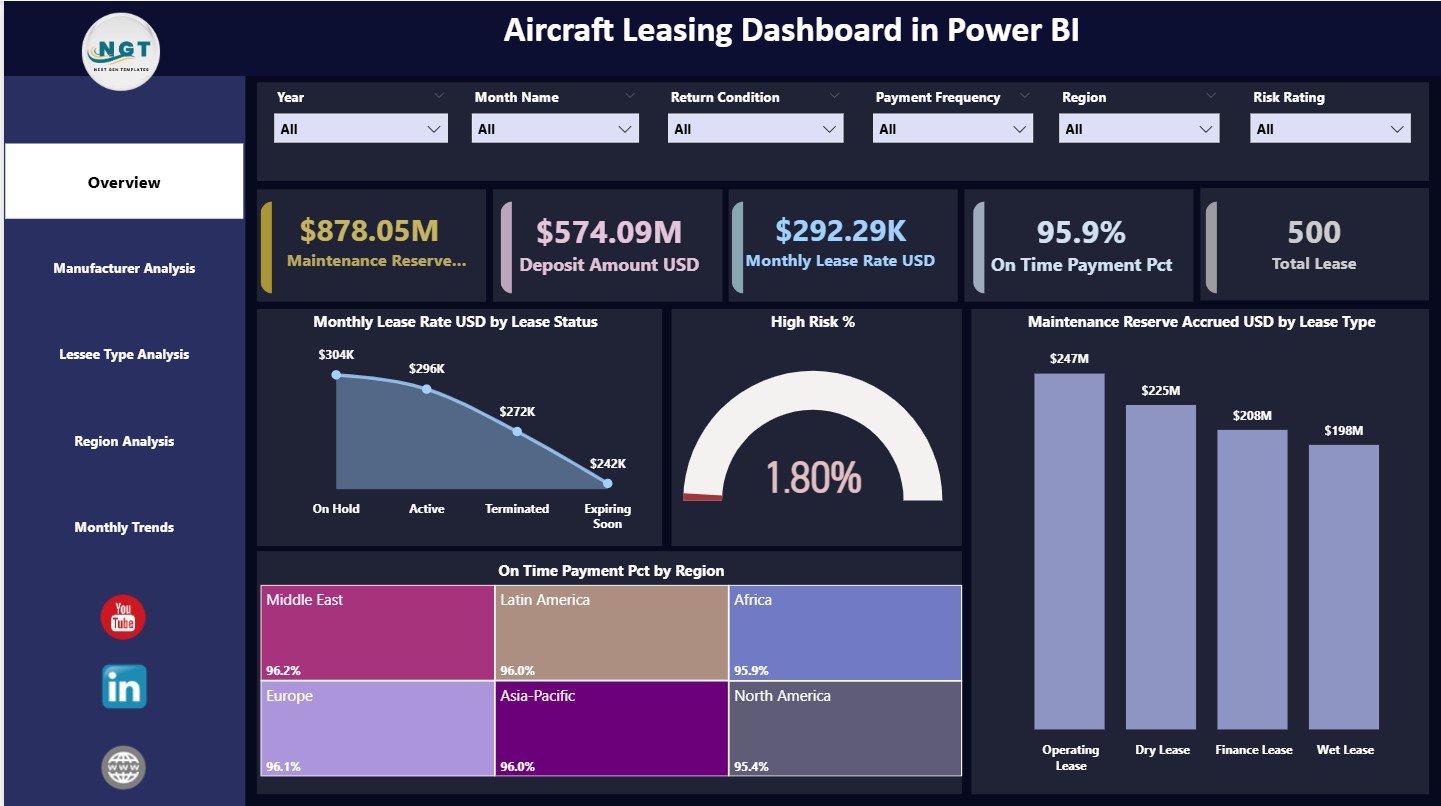
📊 Manufacturer Analysis Page
Analyze maintenance reserve rates, risk ratings, and escalation percentages by aircraft manufacturer.
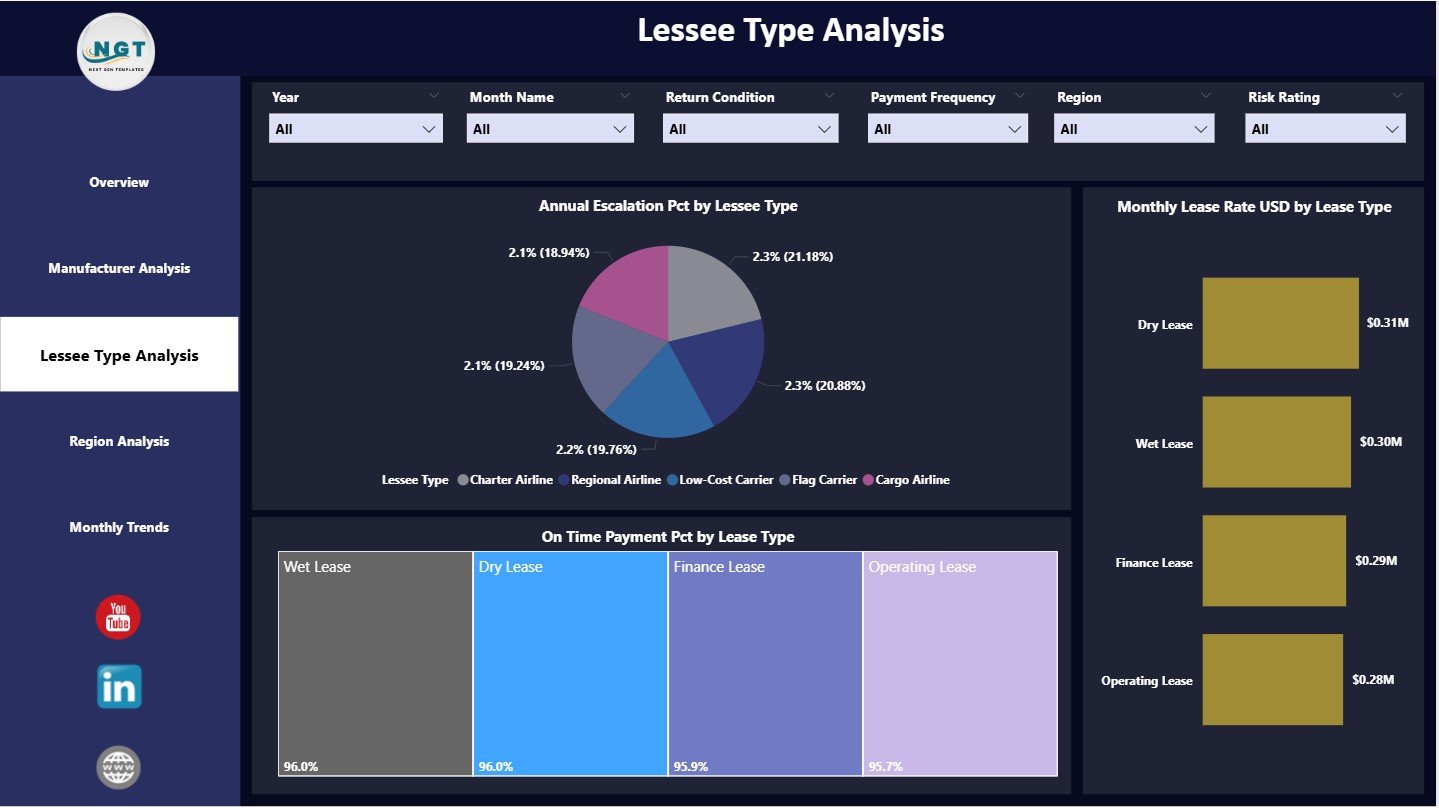
👥 Lessee Type Analysis Page
Compare performance across lessee types such as airlines, cargo operators, and charter services.
🌍 Region Analysis Page
View lease count, deposits, and maintenance reserves by geographic region.
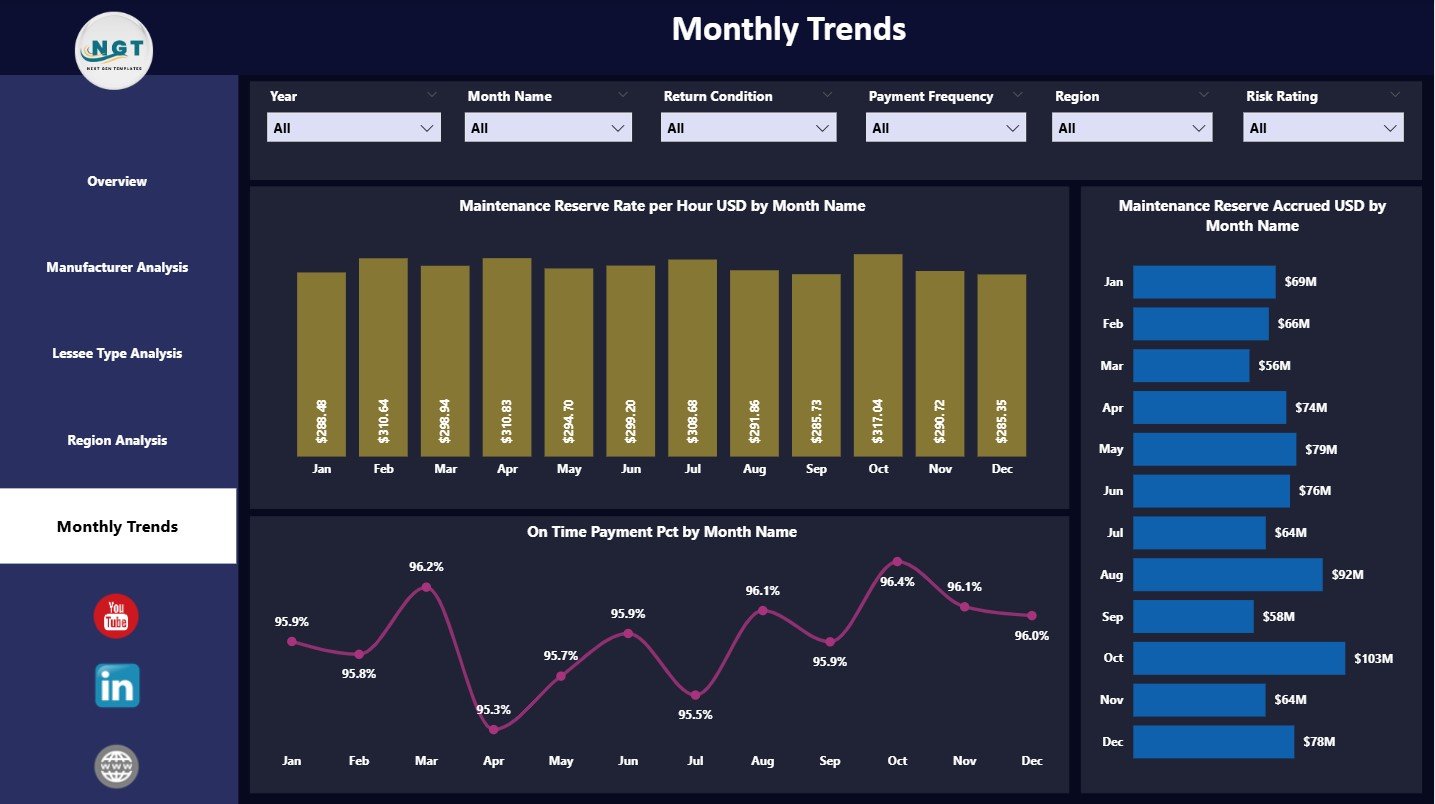
📈 Monthly Trends Page
Track time-based trends for maintenance reserves and on-time payment percentages.
Each page answers a specific business question, making the dashboard strategic, structured, and executive ready.
⚙️ How to Use the Aircraft Leasing Dashboard in Power BI
📝 Step 1: Load Your Data
Connect lease, financial, and operational data from Excel or source systems.
🔗 Step 2: Refresh the Model
Update the Power BI dataset to reflect the latest portfolio information.
📊 Step 3: Explore KPIs
Use slicers to analyze data by manufacturer, region, lessee type, and time period.
⚠️ Step 4: Identify Risks & Opportunities
Spot high-risk leases, payment issues, and concentration risks early.
🎯 Step 5: Make Confident Decisions
Support pricing, risk management, and portfolio strategy using real insights.
👥 Who Can Benefit from This Aircraft Leasing Dashboard in Power BI
✈️ Aircraft Leasing Companies – Gain full visibility into portfolio performance
💼 Aviation Finance Teams – Monitor revenue, deposits, and reserves accurately
📊 Asset & Risk Managers – Identify high-risk leases and exposure trends
🌍 Regional & Portfolio Heads – Analyze geographic and fleet concentration
🏢 Executives & Decision-Makers – Drive strategy with real-time insights
🔍 Click here to read the Detailed blog post
📺 Visit our YouTube channel to learn step-by-step video tutorials
👉 Youtube.com/@PKAnExcelExpert
Watch the step-by-step video tutorial:
Compatibility and Requirements
- Built for Power BI Desktop, which is free to download. Microsoft explains the install in Get Power BI Desktop.
- You load your lease, financial and operational data from Excel or other source systems, then refresh the model.
Frequently Asked Questions
Which pages are included?
Five pages: Overview, Manufacturer Analysis, Lessee Type Analysis, Region Analysis and Monthly Trends.
Where does the data come from?
You connect lease, financial and operational data from Excel or your source systems, then refresh the Power BI dataset to bring in the latest portfolio information.
Can I filter by manufacturer, region or lessee type?
Yes. Slicers let you analyze the data by manufacturer, region, lessee type and time period.
What does the Monthly Trends page show?
It tracks maintenance reserves and on-time payment percentages over time, so you can spot early warning signs.
Is there an Excel version?
Yes. See the Aircraft Leasing Dashboard in Excel.
Related Leasing Dashboards
- Aircraft Leasing Dashboard in Excel: the same aircraft leasing topic in Excel
- Equipment Leasing Dashboard in Power BI: lease tracking for equipment portfolios
- Facilities Leasing Dashboard in Power BI: a leasing view for facilities
- Equipment Leasing KPI Dashboard in Power BI: a KPI-focused leasing report
- Power BI Dashboard Mega Collection: 15 Power BI templates in one download
Browse all Power BI dashboards.





























Reviews
There are no reviews yet.