

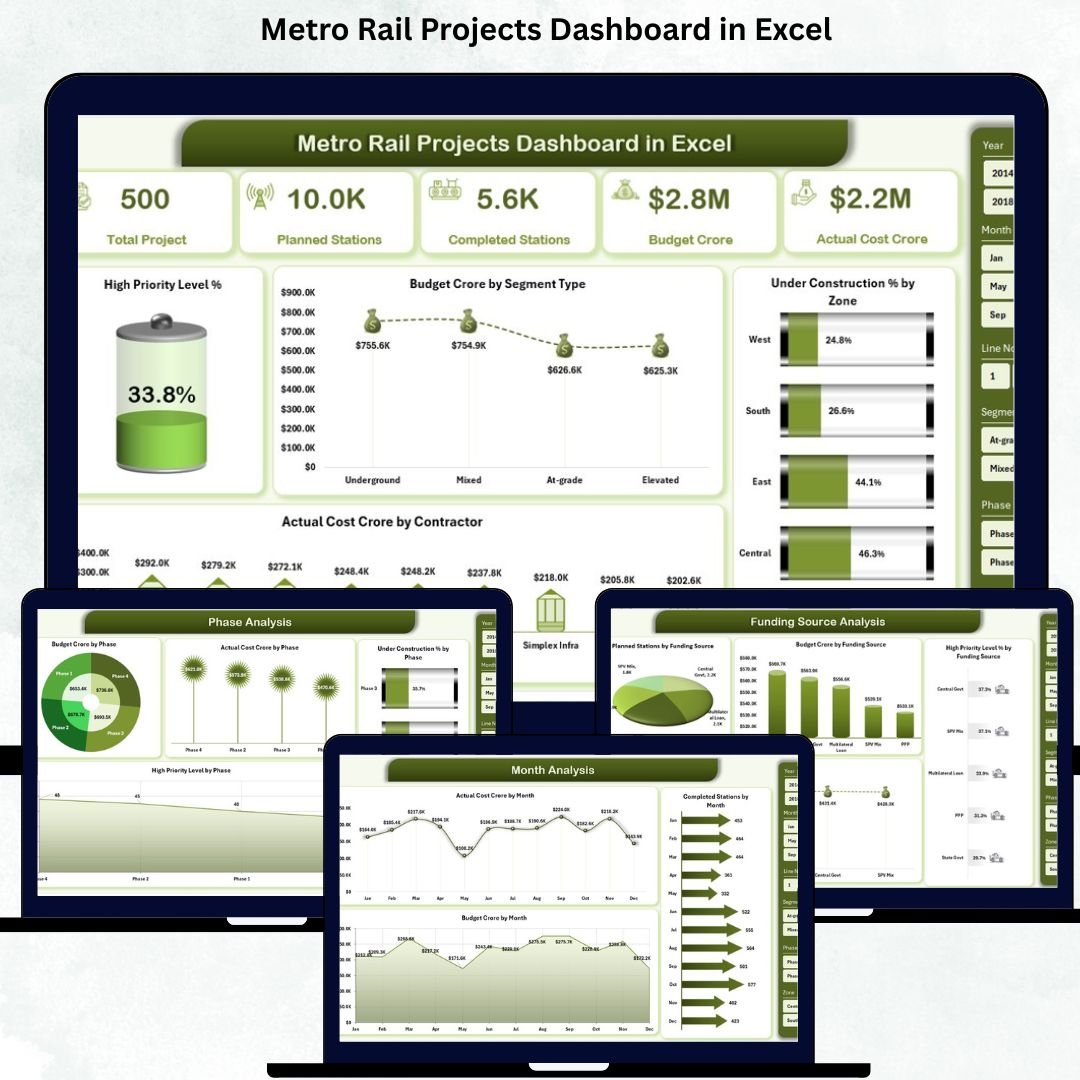

Metro rail projects are among the most complex urban infrastructure initiatives. They involve massive investments, multiple contractors, diverse funding sources, strict timelines, and coordination across zones and phases. When project data is scattered across spreadsheets and static reports, teams struggle to track progress, control costs, and respond to risks on time. This is exactly why a Metro Rail Projects Dashboard in Excel becomes a must-have tool for modern metro project management.
The Metro Rail Projects Dashboard in Excel is a ready-to-use, interactive project monitoring solution designed for metro authorities, planners, engineers, consultants, and decision-makers. Built entirely in Excel, this dashboard transforms raw project data into clear KPIs, dynamic charts, and meaningful visual insights. Instead of reviewing multiple files, users get a single, centralized view of project performance—helping them improve planning, reduce delays, and control costs more effectively.
Because the dashboard uses Excel, it stays flexible, affordable, and easy to adopt. Even non-technical users can explore complex metro project data using slicers and charts without writing a single line of code.
✨ Key Features of the Metro Rail Projects Dashboard in Excel
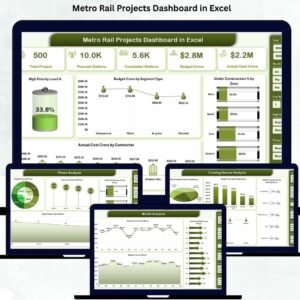
This professionally designed dashboard includes five structured analytical pages, a left-side page navigator, smart slicers, KPI cards, and automated charts.
⭐ Overview Page – Complete Project Snapshot
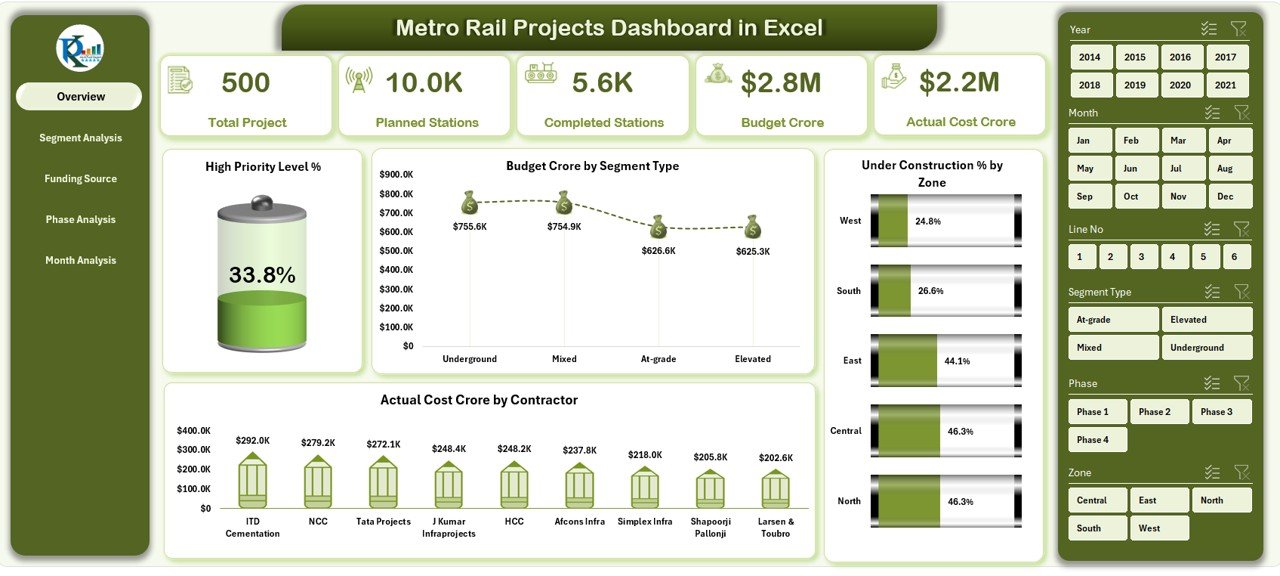
✔ Right-side slicer for dynamic filtering
✔ Five KPI cards highlighting project health
✔ Four high-impact charts:
High Priority Level %
Budget Crore by Segment Type
Under Construction % by Zone
Actual Cost Crore by Contractor
This page gives leadership an instant snapshot of metro project status, risks, and costs.
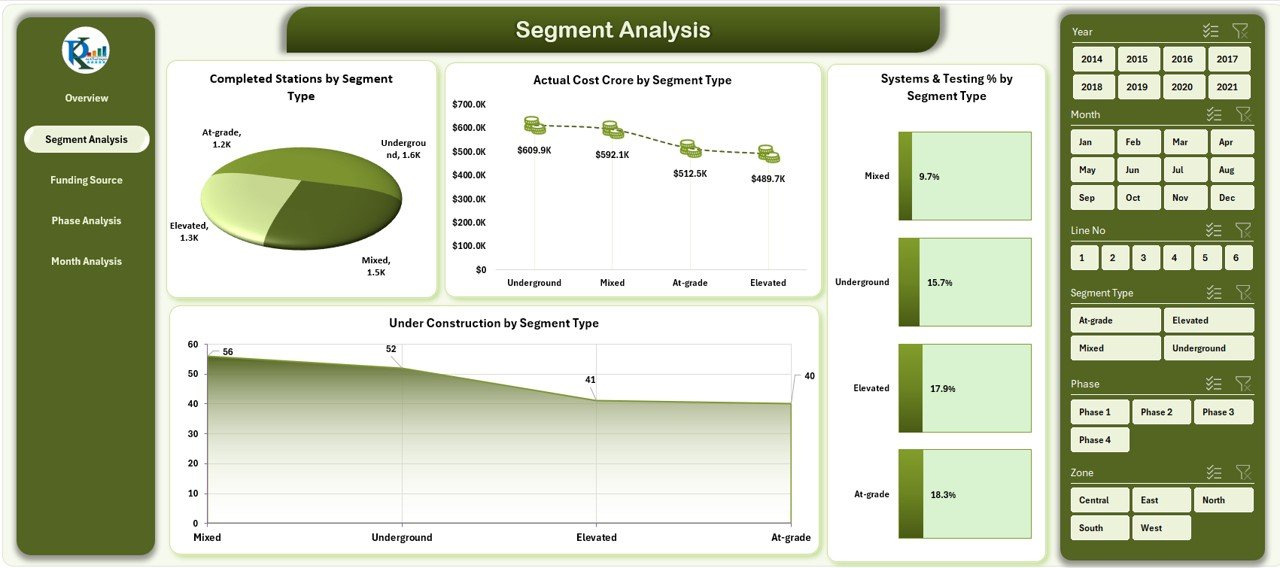
⭐ Segment Analysis Page – Track Progress by Segment
✔ Completed Stations by Segment Type
✔ Actual Cost Crore by Segment Type
✔ System & Testing Status by Segment Type
✔ Under Construction % by Segment Type
This page helps teams compare progress across tunnel, elevated, underground, or mixed segments.
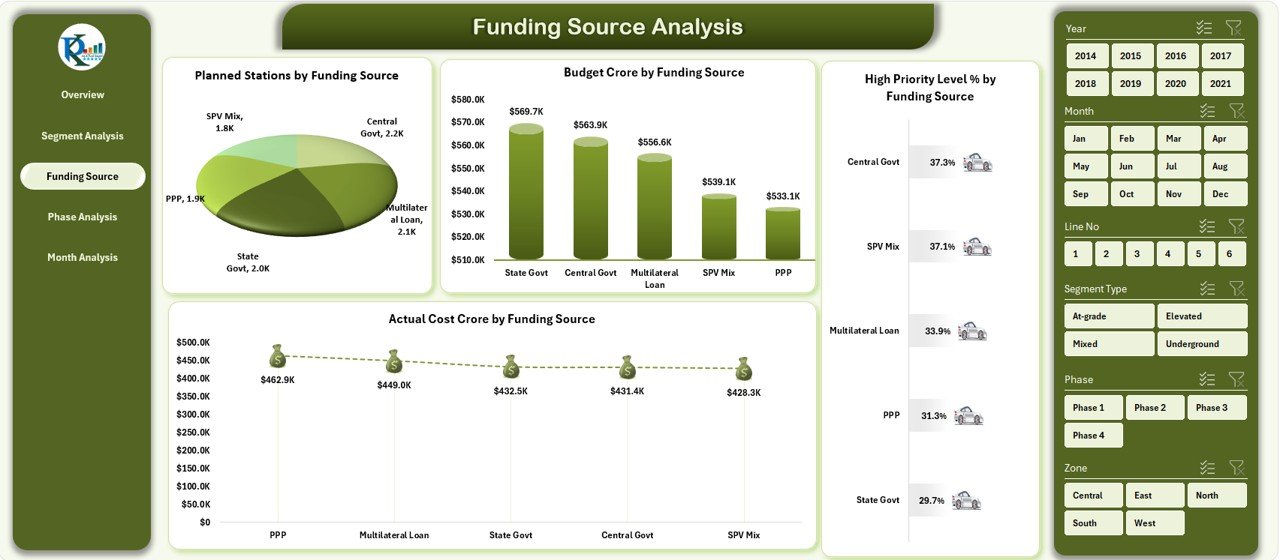
⭐ Funding Source Analysis Page – Financial Transparency
✔ Planned Stations by Funding Source
✔ Budget Crore by Funding Source
✔ Actual Cost Crore by Funding Source
✔ High Priority Level % by Funding Source
Finance and audit teams use this page to track funding utilization and cost efficiency.
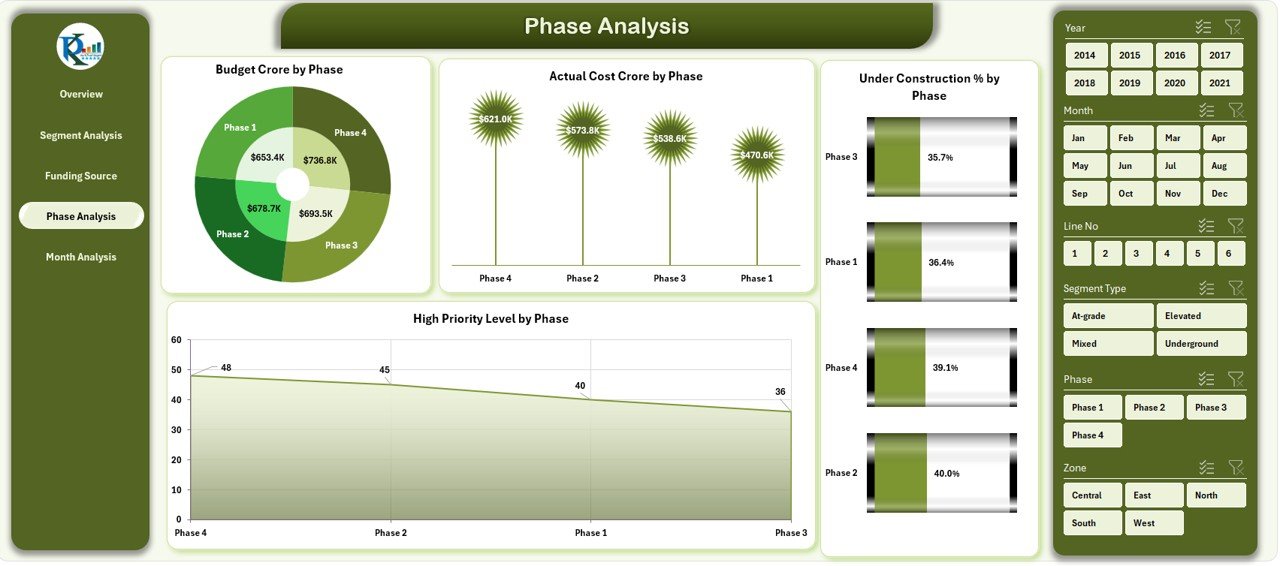
⭐ Phase Analysis Page – Monitor Project Lifecycle
✔ Budget Crore by Phase
✔ Actual Cost Crore by Phase
✔ Under Construction % by Phase
✔ High Priority Level by Phase
This page highlights which project phases need immediate attention.
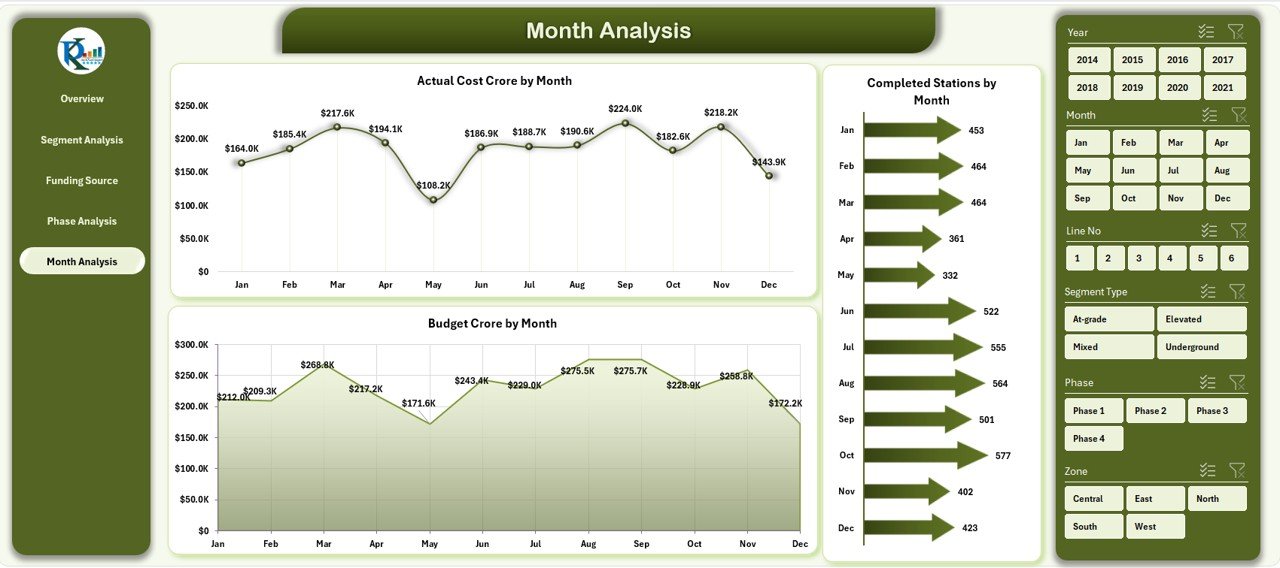
⭐ Month Analysis Page – Time-Based Performance
✔ Actual Cost Crore by Month
✔ Completed Stations by Month
✔ Budget Crore by Month
This page supports forecasting, trend analysis, and deadline monitoring.
📦 What’s Inside the Metro Rail Projects Dashboard in Excel
When you download this product, you receive:
✨ A ready-to-use Excel dashboard file
✨ Five interactive analysis pages
✨ Left-side page navigator for smooth navigation
✨ Right-side slicers for filtering insights
✨ KPI cards for quick decisions
✨ Automated charts linked to the data sheet
✨ A structured Data Sheet that refreshes the entire dashboard
Everything is designed for clarity, control, and scalability.
🛠️ How to Use the Metro Rail Projects Dashboard in Excel
1️⃣ Open the Excel dashboard file
2️⃣ Enter or update project data in the Data Sheet
3️⃣ Navigate pages using the page navigator
4️⃣ Apply slicers to filter by zone, phase, segment, or funding source
5️⃣ Review KPI cards and charts
6️⃣ Identify cost overruns, delays, and high-priority risks
7️⃣ Take timely, data-driven project decisions
No advanced Excel skills are required—basic familiarity is enough.
👥 Who Can Benefit from This Metro Rail Projects Dashboard in Excel
This dashboard is ideal for:
✔ Metro rail authorities
✔ Government infrastructure departments
✔ Project managers and planners
✔ Engineering and EPC firms
✔ Contractors and consultants
✔ Financial auditors
✔ Urban transport agencies
It adapts easily to both single projects and large metro networks.
### 📘 Click here to read the Detailed blog post
🎥 Visit our YouTube channel to learn step-by-step video tutorials
👉 Youtube.com/@PKAnExcelExpert
Watch the step-by-step video tutorial:
Compatibility and Requirements
- Works in Microsoft Excel desktop (Excel 2016 or later, or Microsoft 365).
- The dashboard uses slicers to filter the charts. Microsoft explains them in Use slicers to filter data.
Frequently Asked Questions
How many pages does the dashboard have?
Five pages: Overview, Segment Analysis, Funding Source Analysis, Phase Analysis and Month Analysis. A page navigator on the left side moves you between them.
Where do I enter my project data?
Enter or update your data in the Data Sheet. The KPI cards and charts are linked to that sheet.
Can I filter the dashboard by zone, phase, segment or funding source?
Yes. Slicers on the right side filter the KPI cards and charts, so you can look at one zone, phase, segment type or funding source at a time.
Which costs and budgets does it track?
It tracks Budget Crore and Actual Cost Crore by segment type, funding source, phase, month and contractor. It also shows completed stations, planned stations, under construction percentage and high priority level.
Is there a Power BI version?
Yes. See the Metro Rail Projects Dashboard in Power BI. A KPI-focused edition is also available as the Metro Rail Projects KPI Dashboard in Excel.
Related Project Dashboards
- Metro Rail Projects KPI Dashboard in Excel: a KPI view of metro rail projects in Excel
- Metro Rail Projects Dashboard in Power BI: the Power BI edition of this dashboard
- Project Management Dashboard in Excel: a general project dashboard
- Multiple Projects Management Dashboard in Excel: track several projects in one workbook
- Construction Project Intelligence Kit: a bundle of construction project templates
Browse all Excel dashboards.





















Reviews
There are no reviews yet.