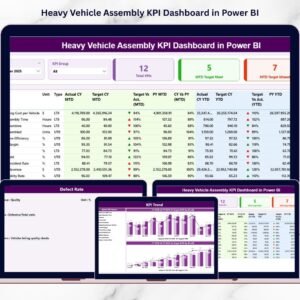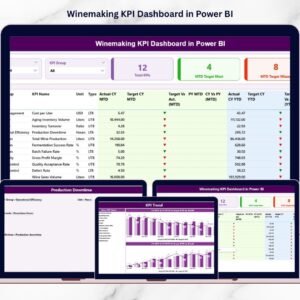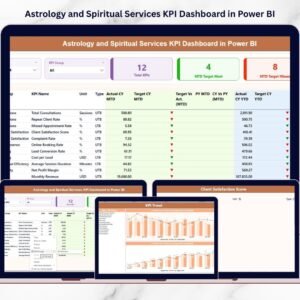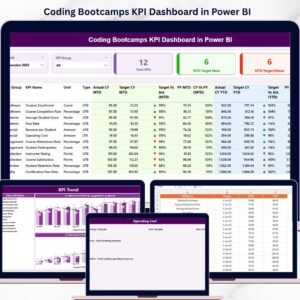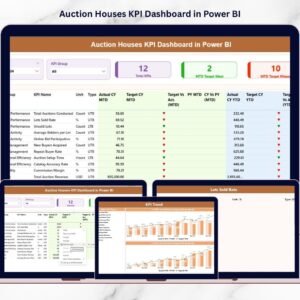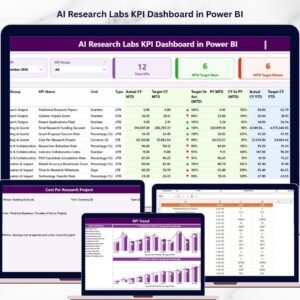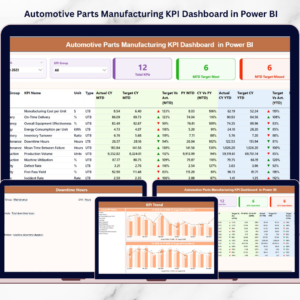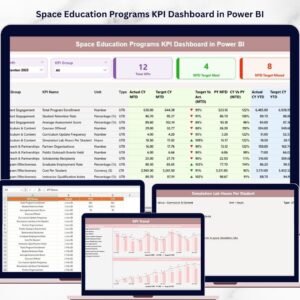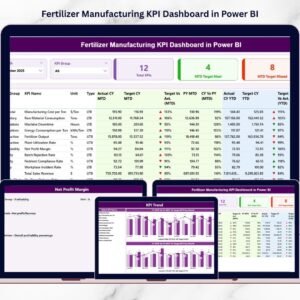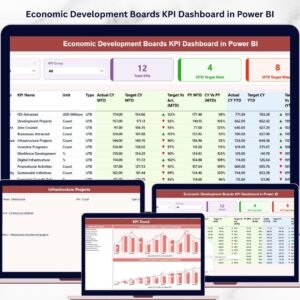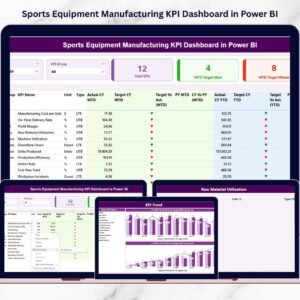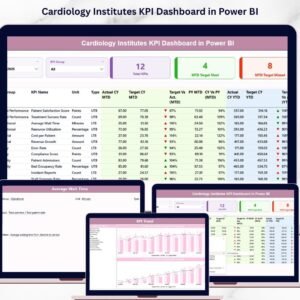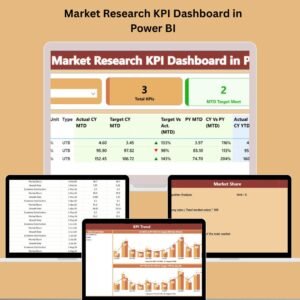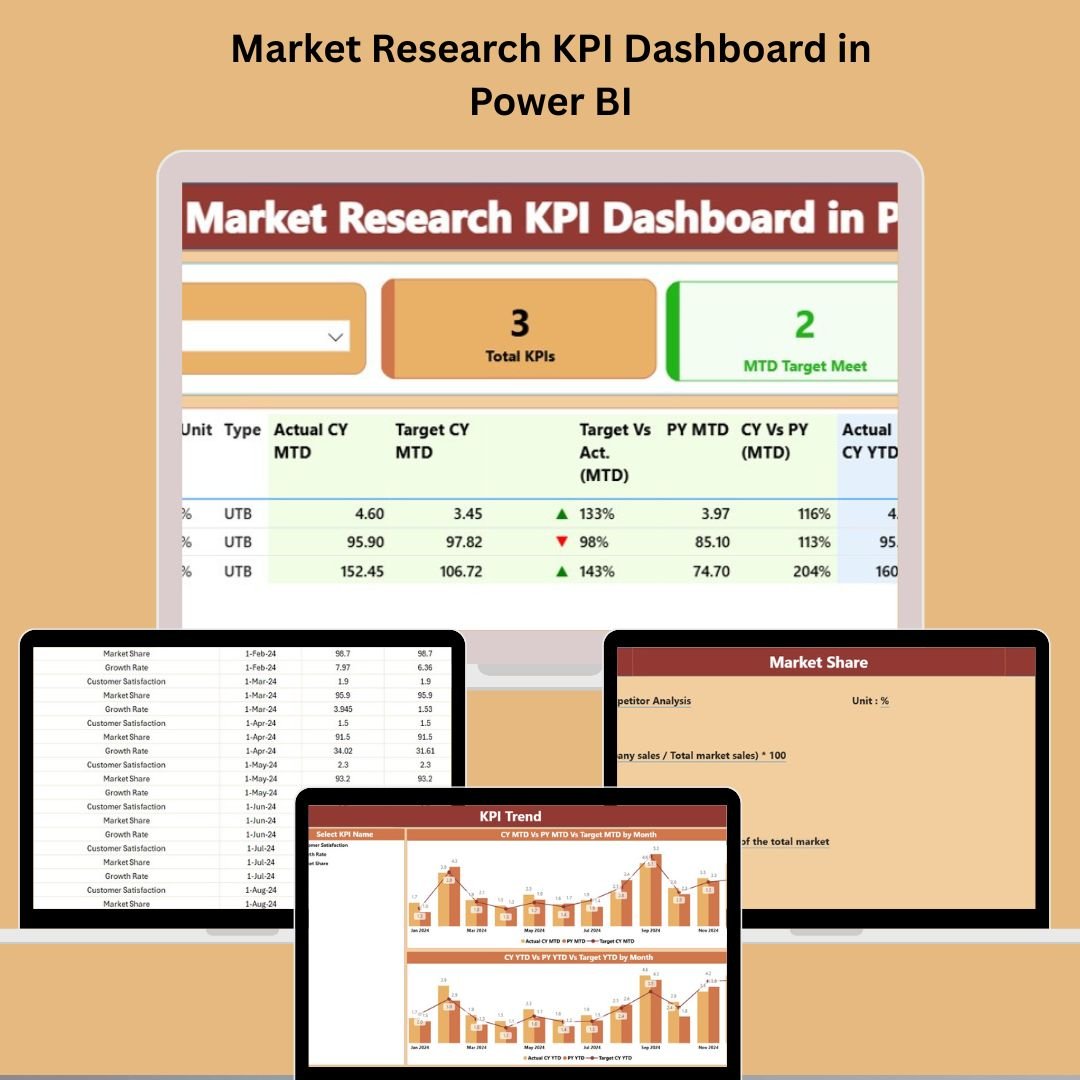
If you’re struggling to make sense of scattered KPIs, shifting trends, and missed targets in your market research, you’re not alone. But now, there’s a better way. Introducing the Market Research KPI Dashboard in Power BI — a dynamic and professional-grade dashboard that transforms your raw market data into clear, actionable insights. ⚙️📈
Perfect for analysts, marketing teams, and decision-makers, this dashboard integrates seamlessly with Excel to give you real-time visibility into how your marketing KPIs are performing — both this month and year-over-year.
🛠️ Key Features of Market Research KPI Dashboard in Power BI
📌 Summary Page – Instant Overview of Your KPIs
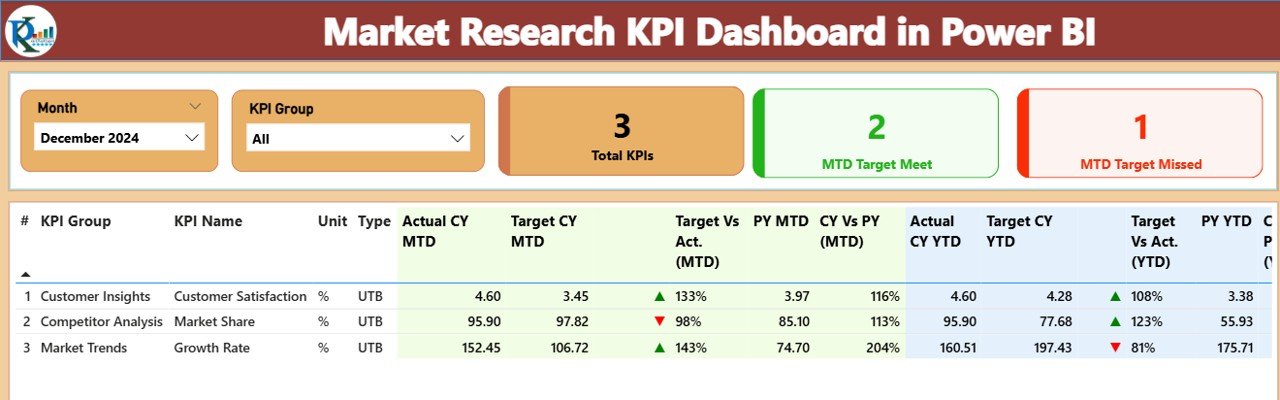
🔄 Month & KPI Group Slicers – Filter insights effortlessly
📋 KPI Cards – Display total KPIs, targets met, and missed
🧮 Detailed KPI Table – Includes KPI Number, Group, Unit, Type (LTB or UTB), Actual vs. Target (MTD/YTD), and performance icons (▲▼)
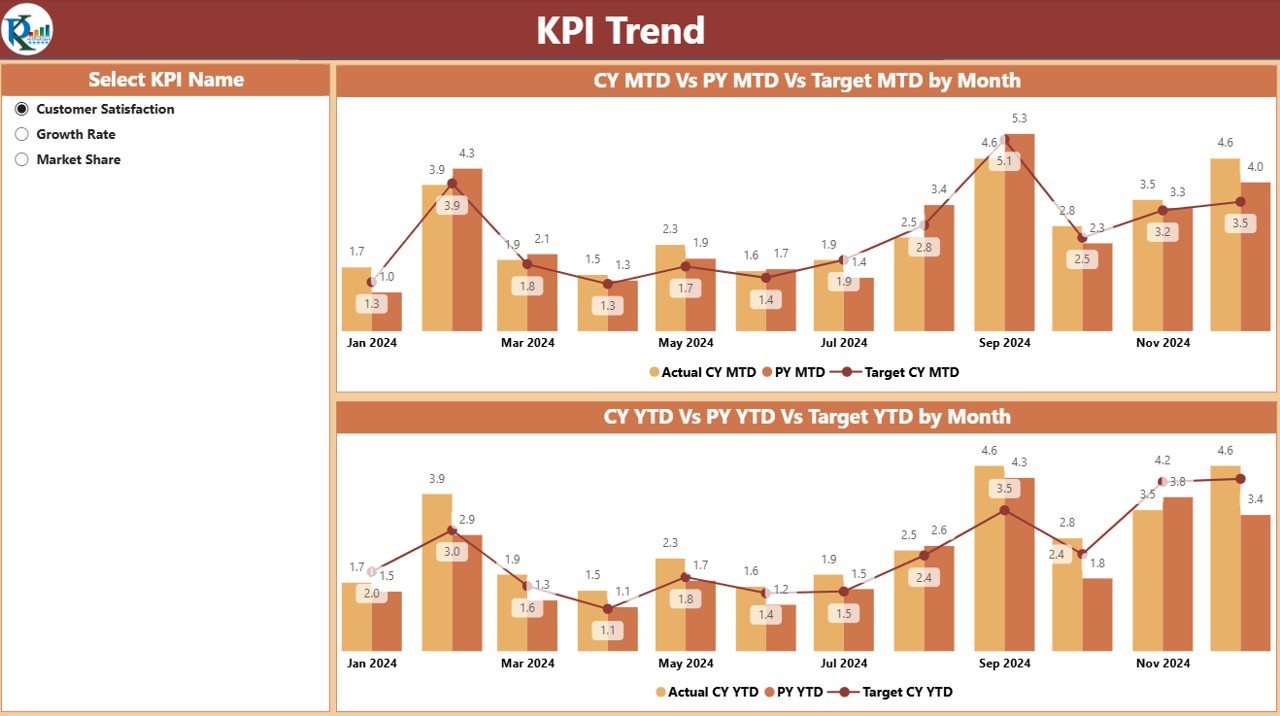
📊 KPI Trend Page – Visualize KPI Movements Over Time
📈 Combo Charts – Track current year, previous year, and target trends
🔍 KPI Selector – Analyze individual KPIs across time for deeper understanding
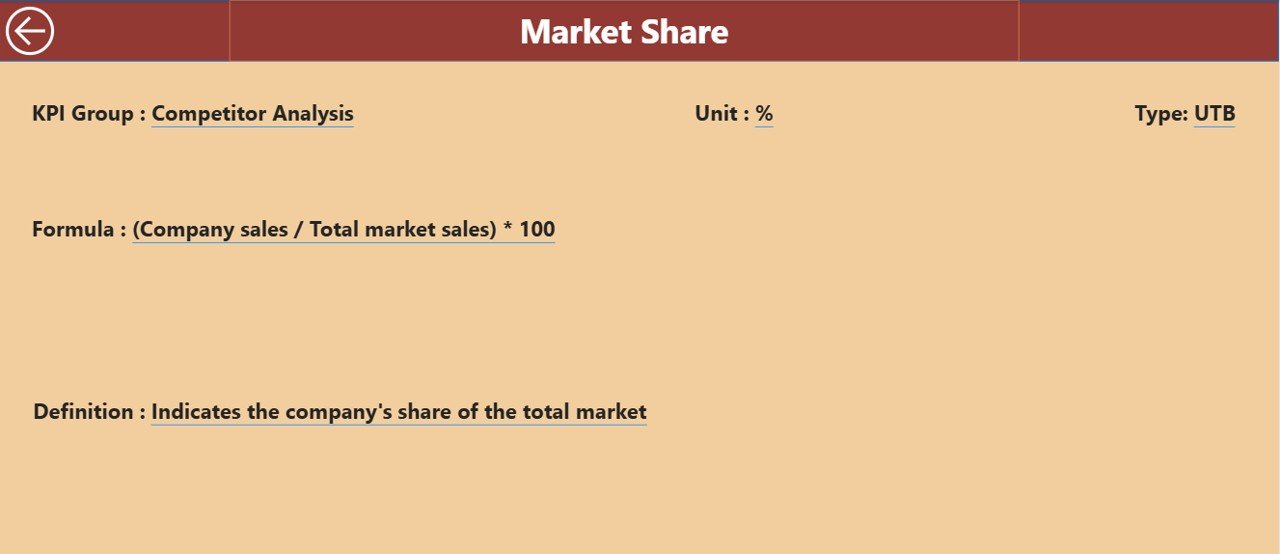
📚 KPI Definition Page – Know What Every KPI Means
🧠 A hidden drill-through page showing:
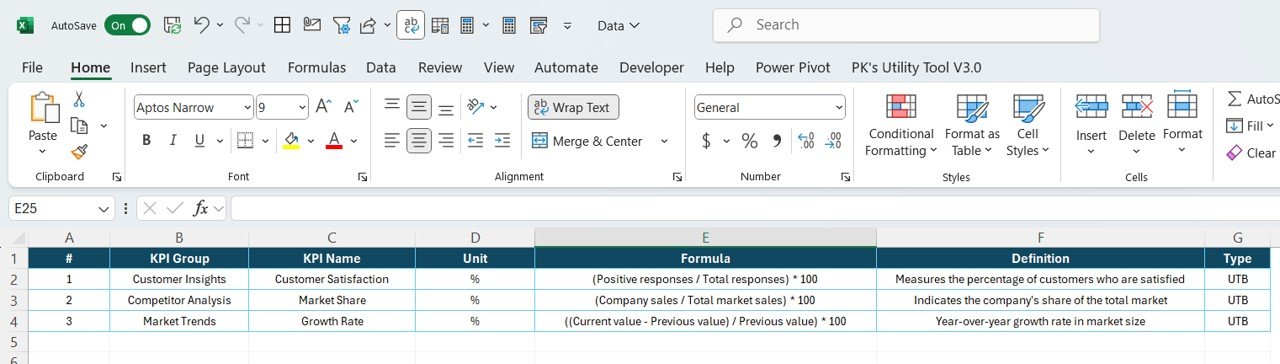
KPI Formula
Unit
Group
Description
Type (LTB or UTB)
Just click the KPI and navigate back effortlessly.
📂 What’s Inside the Market Research KPI Dashboard Package?
✅ A Power BI file (.pbix) with 3 detailed pages: Summary, Trend, and Definitions
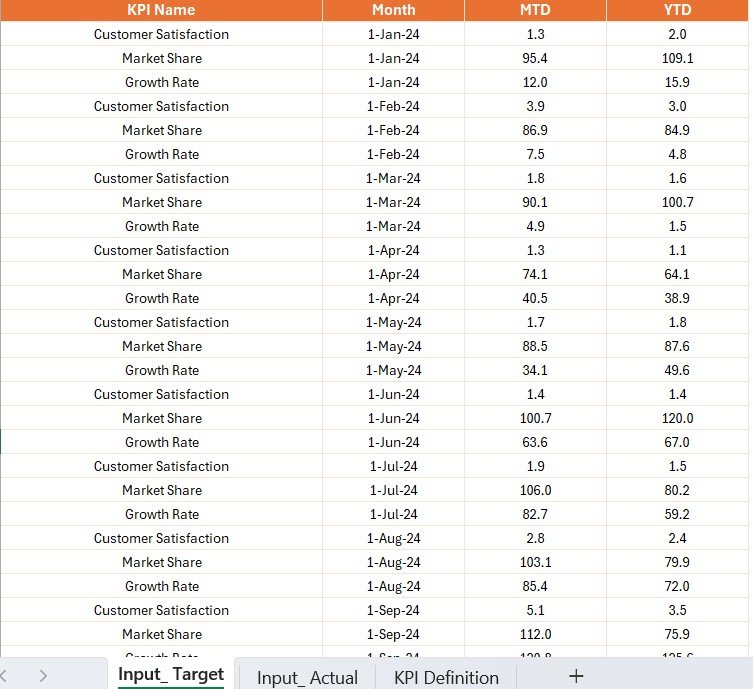
✅ A connected Excel file with 3 sheets:
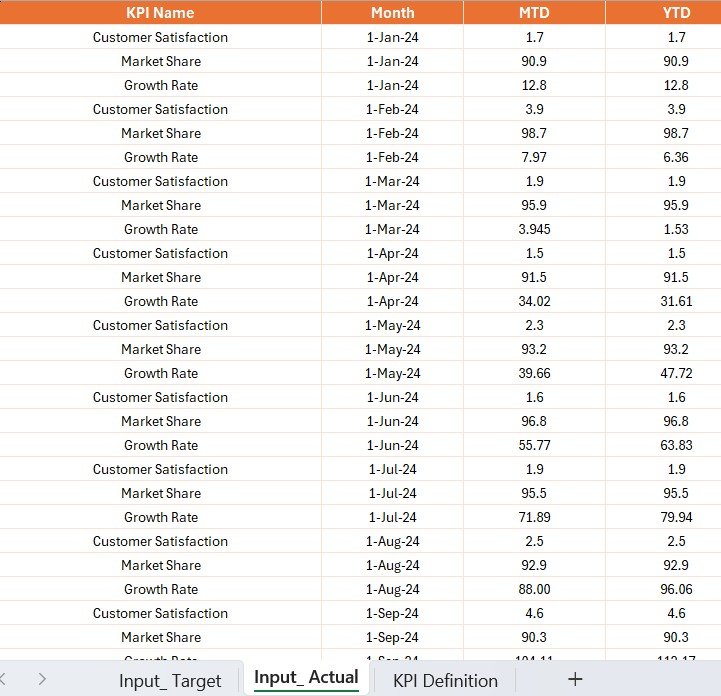
Input_Actual – Input actual MTD/YTD numbers
Input_Target – Define KPI targets
KPI_Definition – Store all KPI formulas, units, and categories
✅ Visual performance indicators (green/red arrows)
✅ Built-in slicers for dynamic filtering
✅ Combo charts for side-by-side year comparisons
✅ Automatic % calculations for Actual vs. Target
Whether you’re running weekly reports or conducting quarterly reviews, this setup is built to scale.
🧑💻 How to Use the Market Research KPI Dashboard in Power BI
🧾 Open the Excel file and input your actual and target numbers
📥 Load the data into Power BI (pre-linked, so just refresh)
🎯 Use slicers to filter by month or KPI group
📊 Analyze KPI cards, performance tables, and charts
🔁 Drill into KPI details using the definition page
💡 Identify gaps and wins in your market research with one glance
It’s plug-and-play! No coding or Power BI expertise needed.
🎯 Who Can Benefit from This Dashboard?
🧑💼 Marketing Analysts – Evaluate campaign ROI and lead performance
📊 Business Leaders – Get big-picture insight without digging through spreadsheets
🕵️♂️ Market Researchers – Track key metrics across timelines
🏢 Startups & Corporates – Scalable for both small teams and enterprise use
📆 Agencies – Showcase client performance in visually appealing dashboards
📣 Brand Managers – Monitor reach, engagement, and awareness KPIs
This dashboard speaks data in the language decision-makers understand.