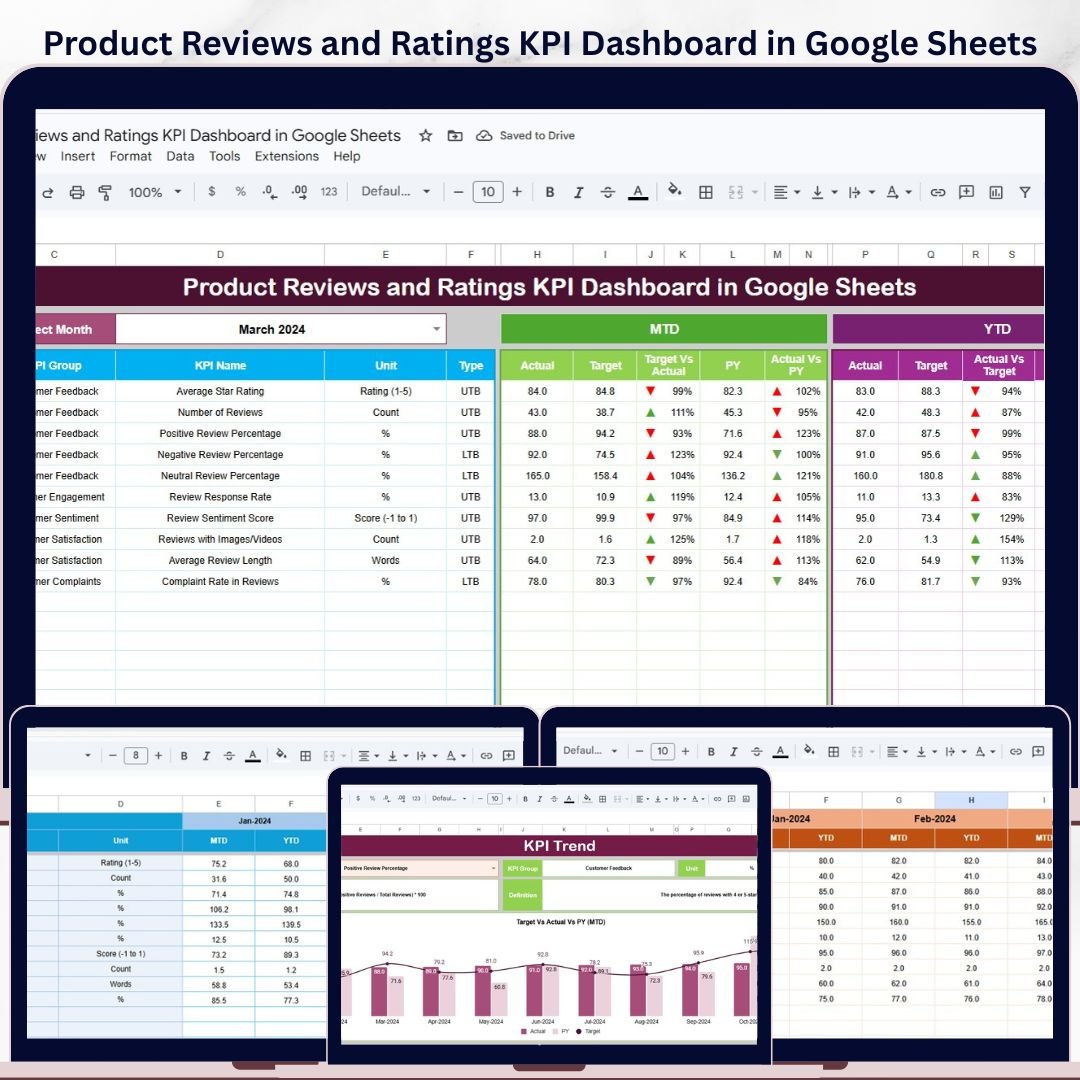


Product Reviews and Ratings KPI Dashboard in Google Sheets gives product, ecommerce, customer service, and marketplace teams a structured way to monitor review quality without building formulas, scorecards, and trend views from scratch. The template includes 6 worksheets, monthly MTD and YTD views, Actual vs Target tracking, Previous Year comparison, conditional arrows, and KPI definition controls. It is designed for teams that want a practical review analytics dashboard they can update in Google Sheets and share with stakeholders instantly.Product Reviews and Ratings KPI Dashboard in Google Sheets
Use it to track how your product reviews, star ratings, complaint patterns, response performance, satisfaction indicators, and rating quality metrics are moving month by month. Instead of scattered exports and manual summaries, you get one repeatable KPI dashboard where performance is easier to read, explain, and improve.Product Reviews and Ratings KPI Dashboard in Google Sheets
Key Features of Product Reviews and Ratings KPI Dashboard in Google Sheets
- Complete KPI dashboard layout: Monitor product review and rating KPIs in a clean Google Sheets dashboard.
- MTD and YTD tracking: Review month-to-date and year-to-date Actual, Target, and Previous Year values.Product Reviews and Ratings KPI Dashboard in Google Sheets
- Target vs Actual comparison: See whether each KPI is above or below expectation with visual arrows.
- PY vs Actual comparison: Compare current performance with previous year results for better context.
- Month drop-down control: Select the reporting month from the Dashboard sheet range D3.
- KPI Trend sheet: View MTD and YTD trend charts for selected KPIs.Product Reviews and Ratings KPI Dashboard in Google Sheets
- Editable KPI setup: Define KPI name, group, unit, formula, definition, and KPI type.
- UTB and LTB logic: Mark each KPI as Upper the Better or Lower the Better.Product Reviews and Ratings KPI Dashboard in Google Sheets
- Google Sheets format: Collaborate online without Excel macros, desktop software, or dashboard subscriptions.
What’s Inside the Product Reviews and Ratings KPI Dashboard in Google Sheets
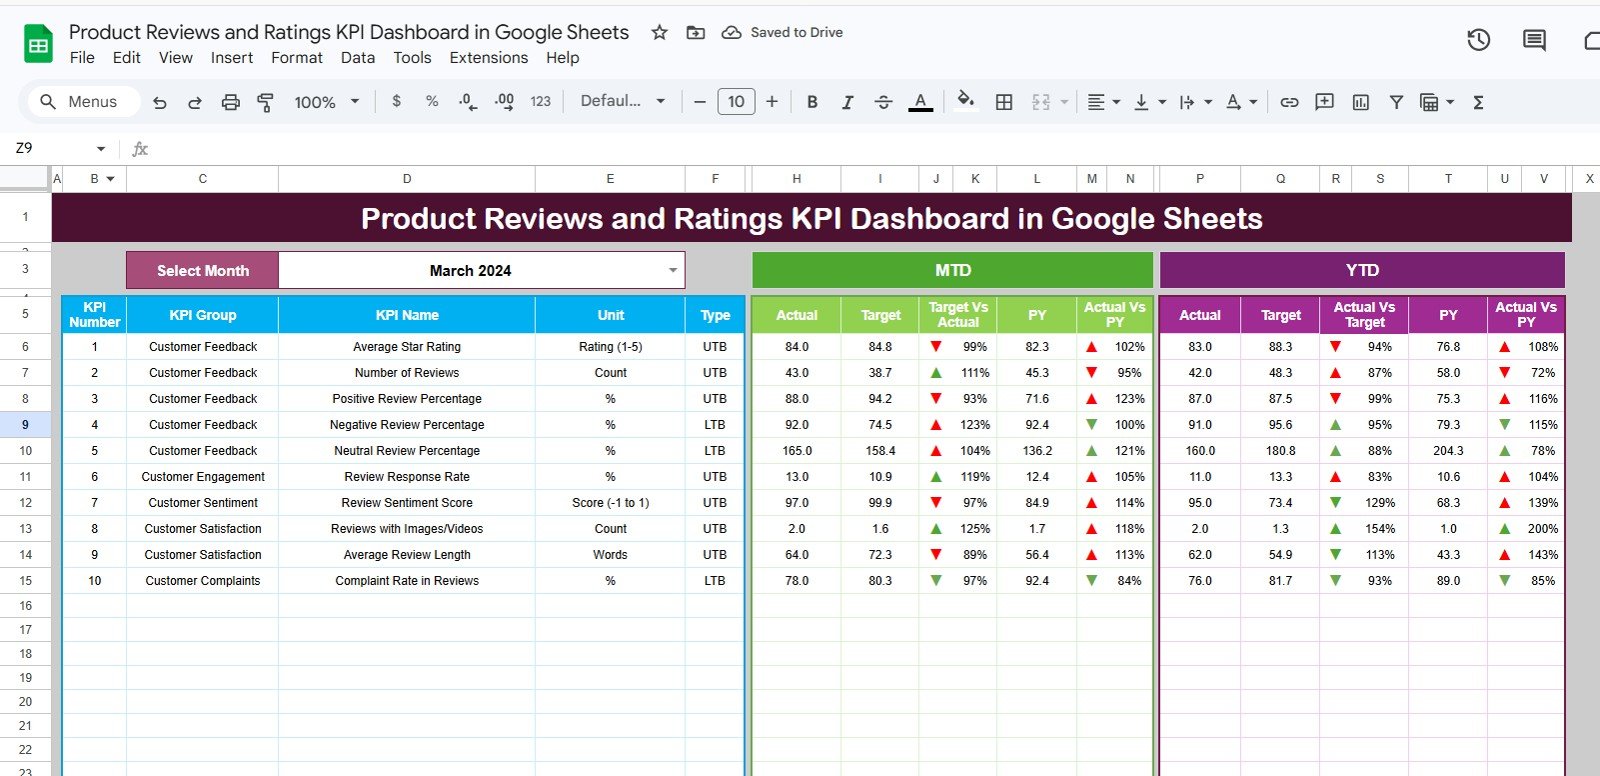
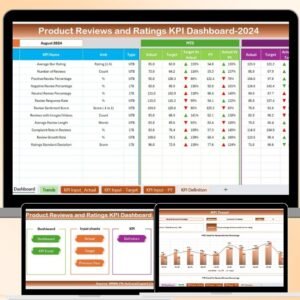
1. Dashboard Sheet Tab
This is the main reporting sheet. Select the month from the drop-down in range D3, and the dashboard updates for that month. The sheet displays MTD Actual, Target, Previous Year data, Target vs Actual, and PY vs Actual with conditional formatting arrows. It also shows the same comparison structure for YTD performance, giving you a fast executive view of review and rating performance.
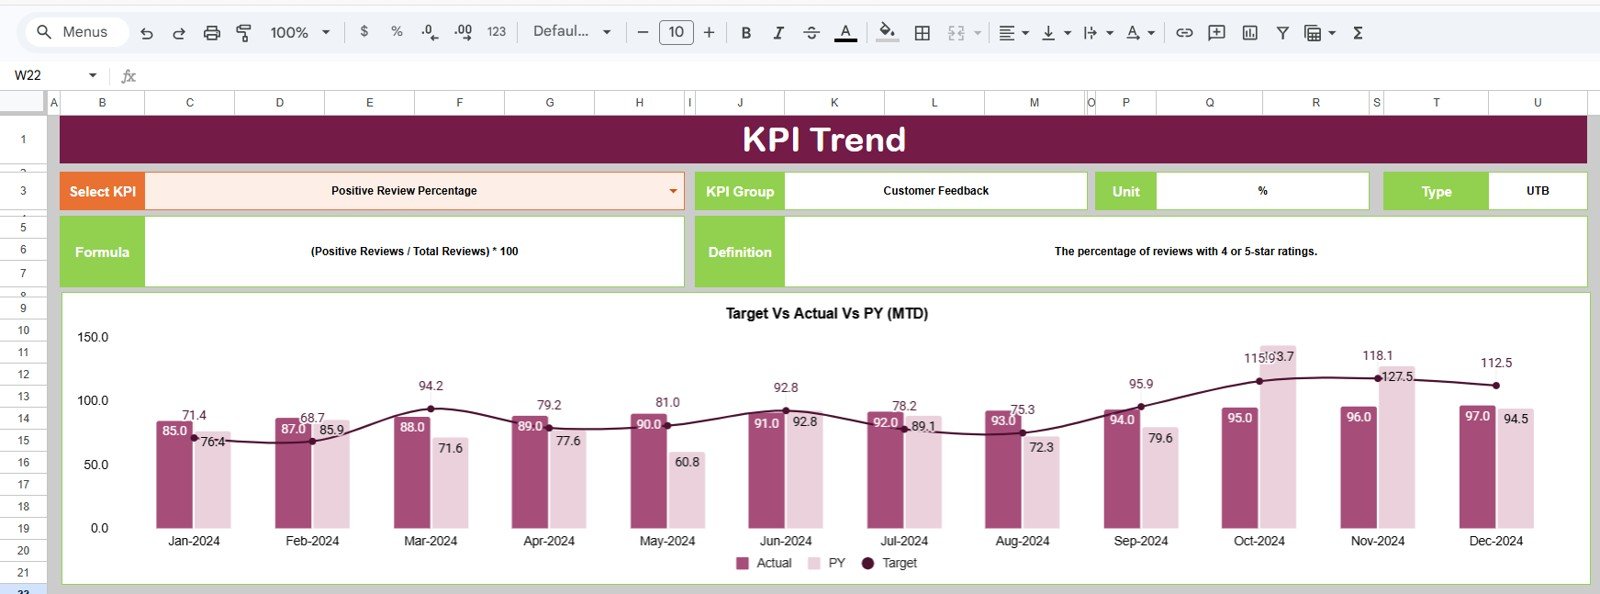
2. KPI Trend Sheet Tab
Use the KPI drop-down in range C3 to choose a metric. The sheet displays the KPI group, unit, KPI type, formula, and definition. It also includes MTD and YTD trend charts for Actual, Target, and Previous Year values, making it easier to explain movement over time.
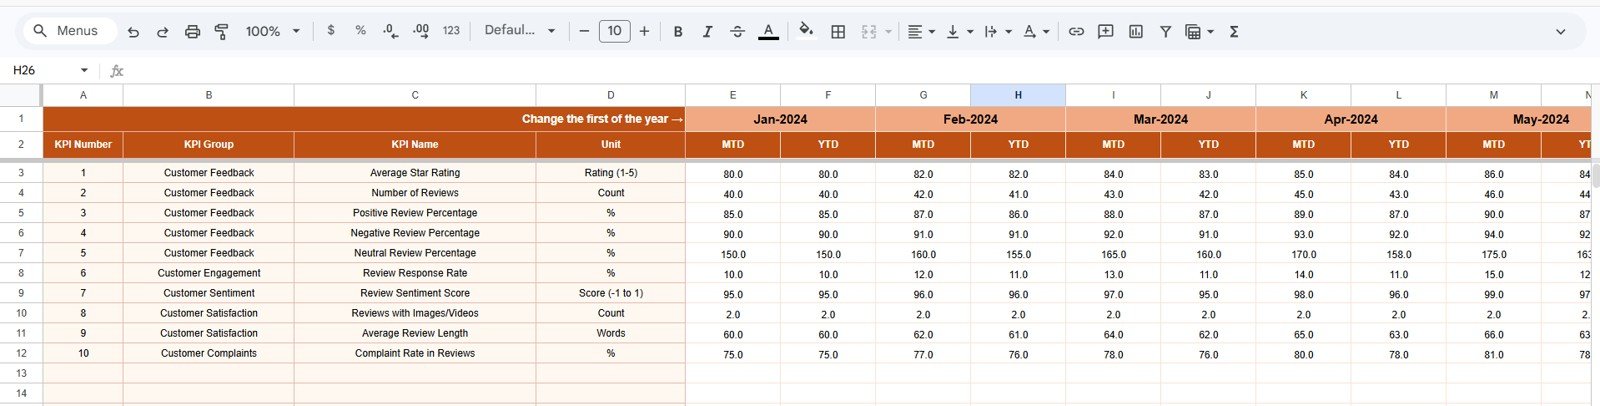
3. Actual Numbers Input Sheet
Enter actual monthly performance values for each KPI. The month headers can be changed from range E1 by entering the first month of the year. This keeps the dashboard flexible for different reporting calendars.
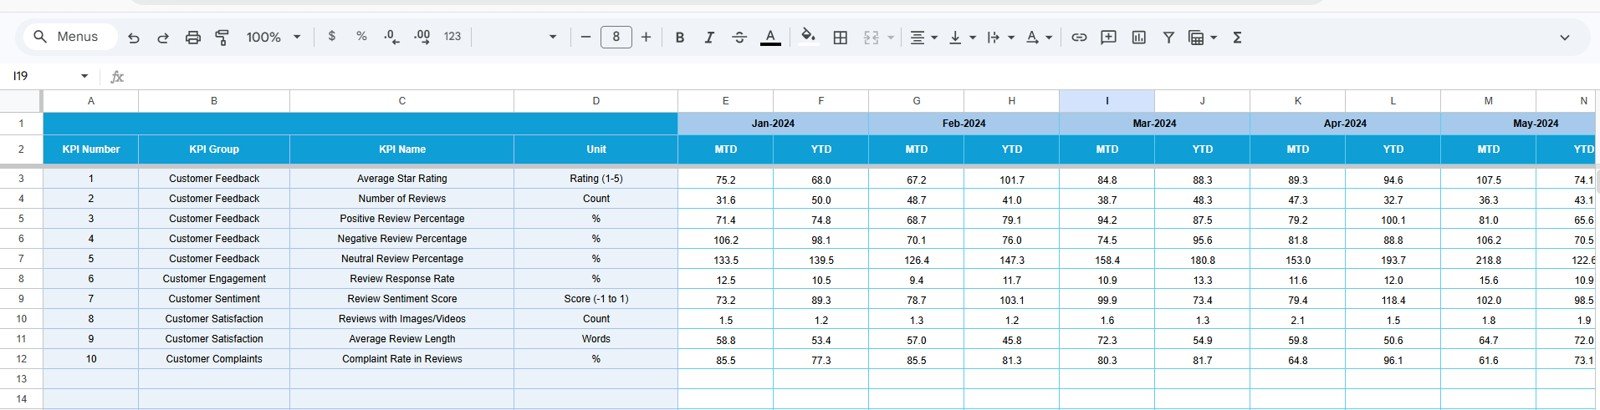
4. Target Number Input Sheet
Add monthly MTD and YTD target values for each KPI. These targets power the dashboard comparison views and help teams see where review performance is meeting, missing, or exceeding expectations.
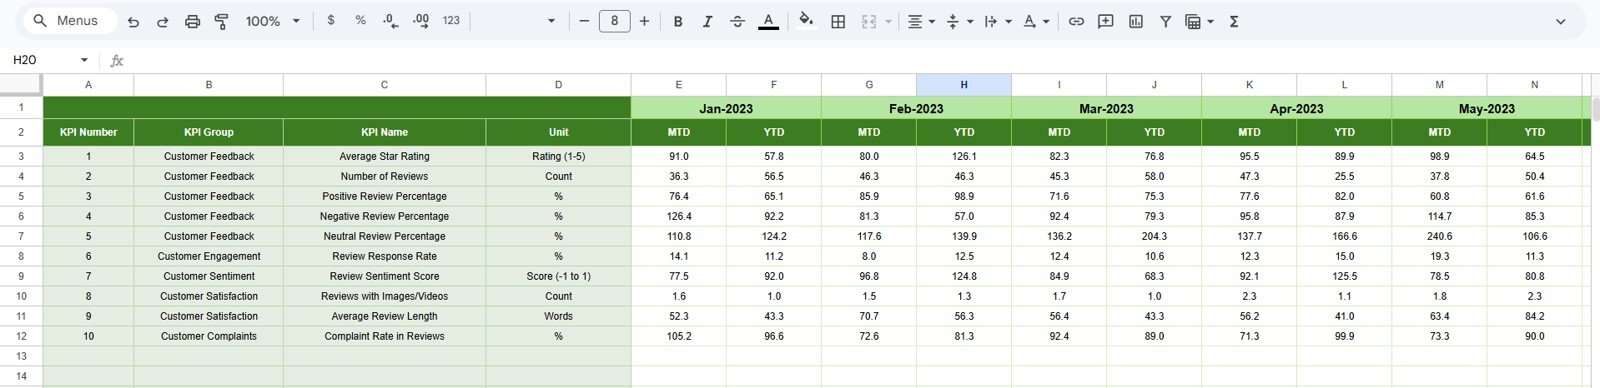
5. Previous Year Number Sheet Tab
Enter the previous year numbers in the same structure used for the current year. This helps your team separate true progress from seasonal patterns, campaign spikes, or product launch effects.
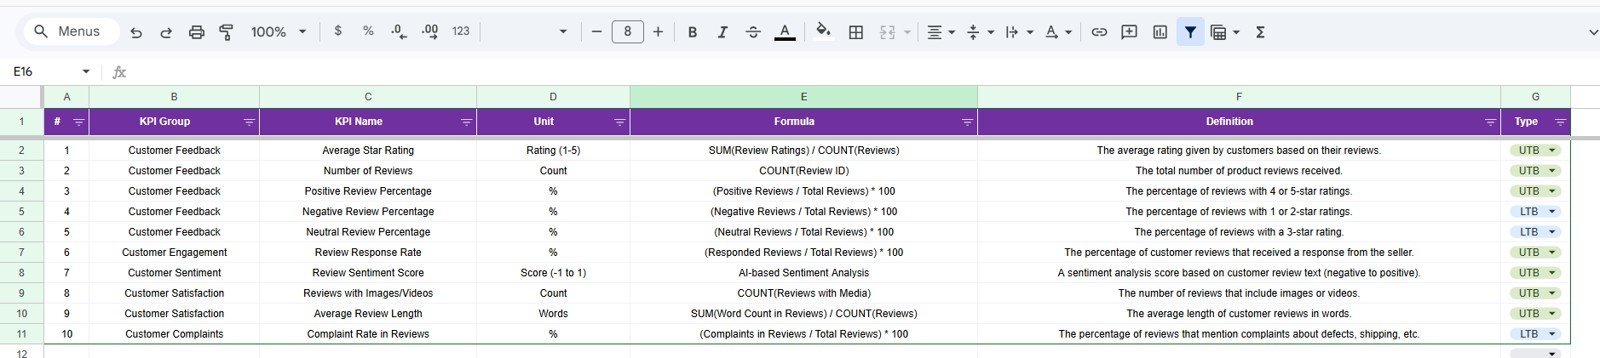
6. KPI Definition Sheet Tab
Maintain the KPI name, KPI group, unit, formula, and KPI definition. The final column lets you classify each KPI as LTB, meaning Lower the Better, or UTB, meaning Upper the Better. This keeps performance logic clear for every metric.

Product Reviews and Ratings KPI Dashboard in Google Sheets vs. Excel Dashboard vs. Paid CRM/SaaS – Where This Fits
| Option | Best For | Trade-Off |
|---|---|---|
| Google Sheets KPI Dashboard | Small teams, product managers, ecommerce operators, and shared reporting workflows | Requires manual or pasted KPI inputs |
| Excel Dashboard | Teams that prefer offline files, desktop analysis, and advanced workbook control | Collaboration can be slower without shared cloud setup |
| Paid CRM or CX SaaS | Large teams needing automated data pipelines, ticketing integrations, and enterprise workflows | Higher cost and longer setup time |
Who This Template Is For – and Who It’s Not For
This template is ideal for ecommerce managers, Amazon or marketplace sellers, product managers, customer experience teams, support leaders, and founders who need a simple review analytics dashboard in Google Sheets. It is especially useful when you already collect review metrics but need a cleaner way to compare Actual, Target, and Previous Year values.
It is not a replacement for a fully automated enterprise review management platform. If you need live API integrations, automated sentiment classification, or multi-channel CRM workflows, you may need a dedicated software system. This dashboard is best for structured KPI tracking, monthly reviews, and management reporting.
How to Use the Product Reviews and Ratings KPI Dashboard in Google Sheets
- Open the template and create your own Google Sheets copy.
- Update the KPI Definition sheet with your review and rating KPIs.
- Enter Actual values for each month in the Actual Numbers Input sheet.
- Add Target values in the Target Number Input sheet.
- Enter Previous Year values for comparison.
- Select a month from the Dashboard sheet and review MTD and YTD performance.
- Use the KPI Trend sheet to analyze individual KPI movement over time.
Real-World Use Cases
- Marketplace seller performance: Track average rating, review count, negative review rate, and response performance.
- Product launch monitoring: Compare new product review KPIs against targets and previous benchmarks.
- Customer service reporting: Connect review trends with complaint handling and service recovery KPIs.
- Management review meetings: Present MTD and YTD product feedback performance in one consistent format.
- Brand quality tracking: Identify whether customer perception is improving across product lines.
Frequently Asked Questions
Is this a Google Sheets template?
Yes. The template is built for Google Sheets and can be copied into your own Google Drive.
Do I need add-ons or scripts?
No. The dashboard is designed for normal Google Sheets use without paid add-ons or complex setup.
Can I edit the KPI names?
Yes. You can update KPI names, groups, units, formulas, definitions, and KPI type in the KPI Definition sheet.
Does it support both MTD and YTD reporting?
Yes. The dashboard includes both month-to-date and year-to-date performance views.
Can I compare performance with targets?
Yes. Target vs Actual comparison is included for MTD and YTD values.
Can I compare performance with last year?
Yes. The template includes Previous Year inputs and PY vs Actual comparisons.
About the Author
This template is created by PK AnExcelExpert, founder of NextGenTemplates.com. The focus is practical spreadsheet dashboards, KPI trackers, and business templates that help teams save setup time and improve reporting clarity.
Explore Related Templates
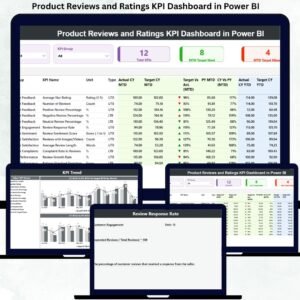
- Product Reviews and Ratings KPI Dashboard in Excel
- Product Reviews and Ratings KPI Dashboard in Power BI
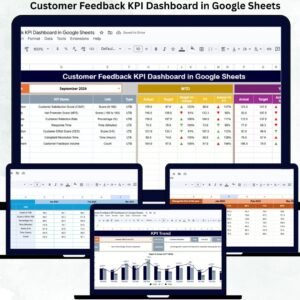
- Customer Feedback KPI Dashboard in Google Sheets
- Customer Service KPI Dashboard in Google Sheets
- Ecommerce Conversion Rate KPI Dashboard in Google Sheets
Last updated: May 2026


Reviews
There are no reviews yet.