

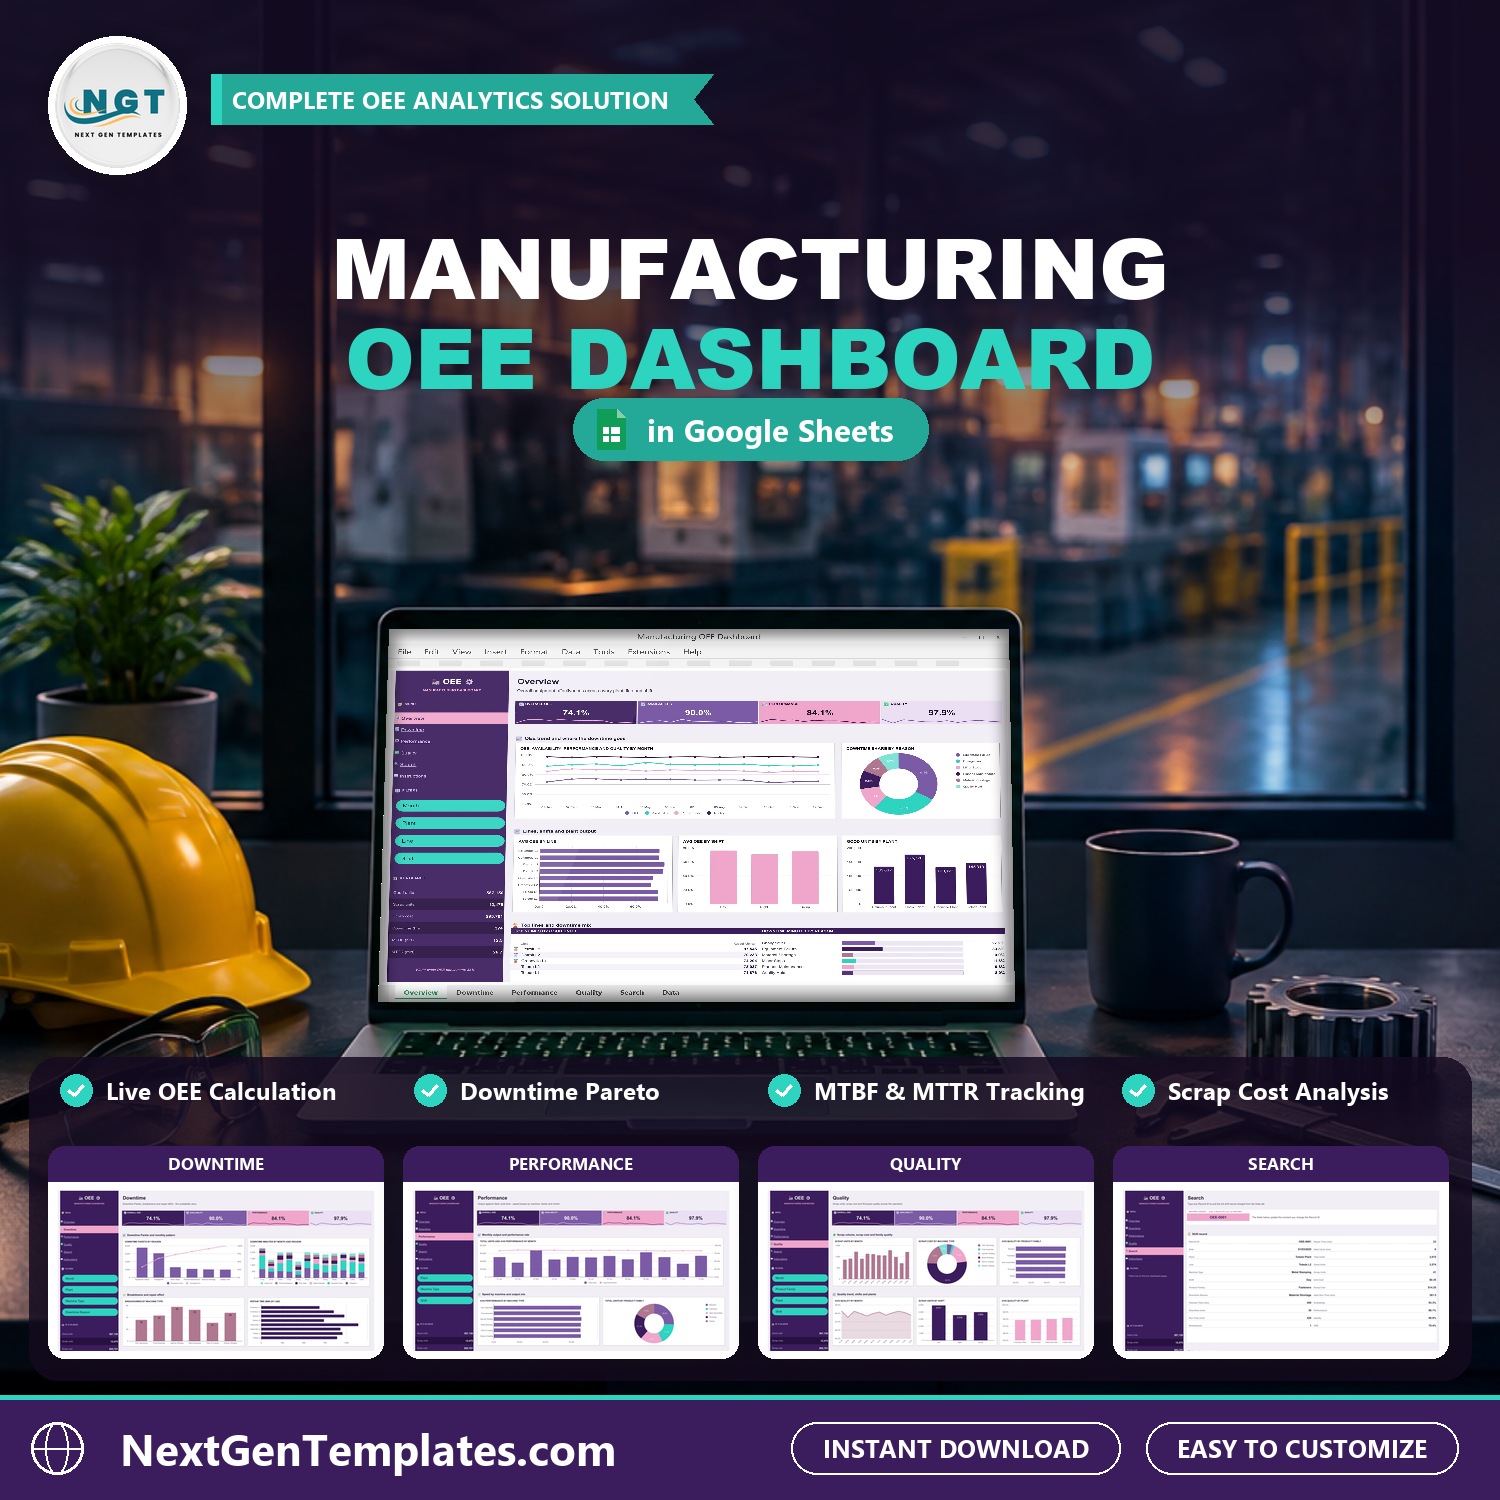

The Manufacturing OEE Dashboard in Google Sheets turns a year of machine shift records into one clear view of overall equipment effectiveness. It shows availability, performance and quality side by side, then breaks the losses down by downtime reason, machine type, line, shift and plant. The sample data covers 4 plants, 8 lines and 3 shifts, and you replace it with your own shift records in the Data tab.
Watch the Manufacturing OEE Dashboard in Google Sheets walkthrough
It is a reporting dashboard for the people who run the floor: plant managers, production supervisors, maintenance teams and continuous improvement leads who track OEE in a spreadsheet and are tired of rebuilding the same charts every month.
Key Features
- Four OEE tiles with monthly trend lines: Overall OEE, Availability, Performance and Quality.
- At a Glance panel: good units, scrap units, scrap cost, downtime hours, MTBF and MTTR, always visible on the left.
- Filters on every page: slice by Month, Plant, Line, Shift, Machine Type, Downtime Reason and Product Family.
- Downtime Pareto: reasons ranked by minutes with a cumulative percentage line, so you see the vital few first.
- Breakdowns and repair effort: breakdown count by machine type and repair minutes by line.
- Scrap cost analysis: scrap units by month, scrap cost by machine type and the five costliest lines.
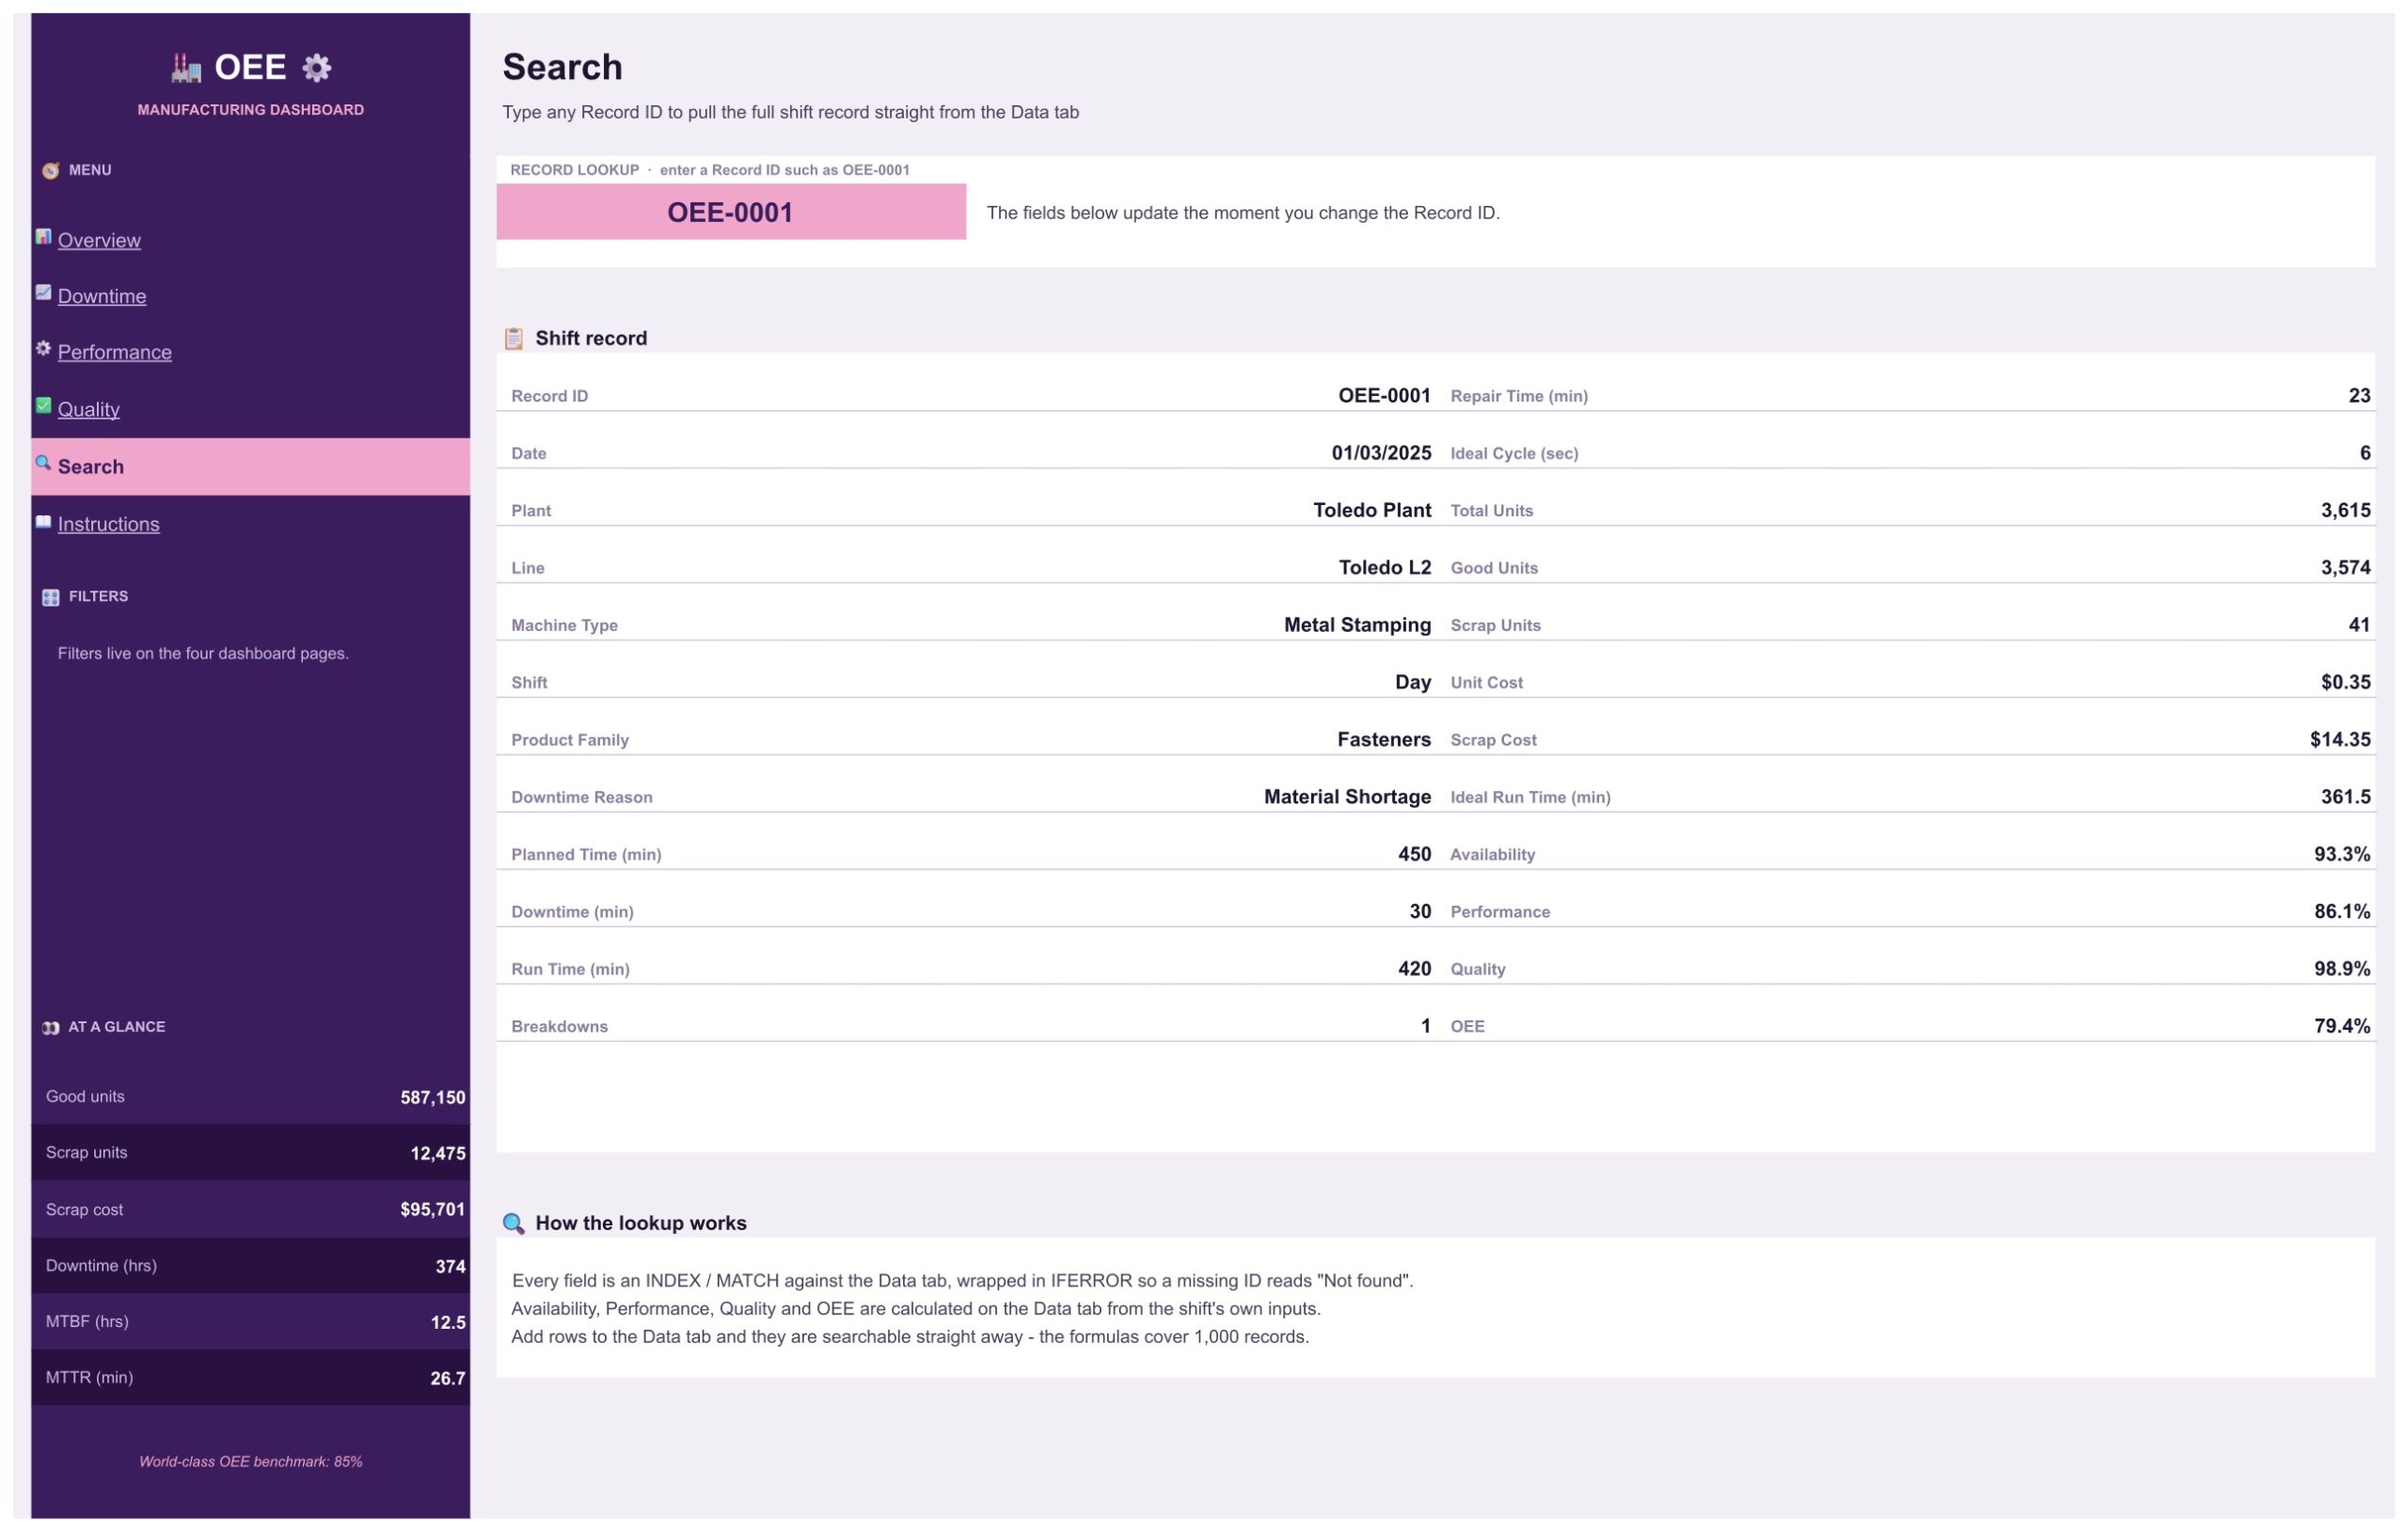
- Search page: type a Record ID such as OEE-0001 and the full shift record appears.
- Room for 1,000 shift records: run time, scrap cost, availability, performance, quality and OEE are calculated by formulas.
What Is Inside the Dashboard
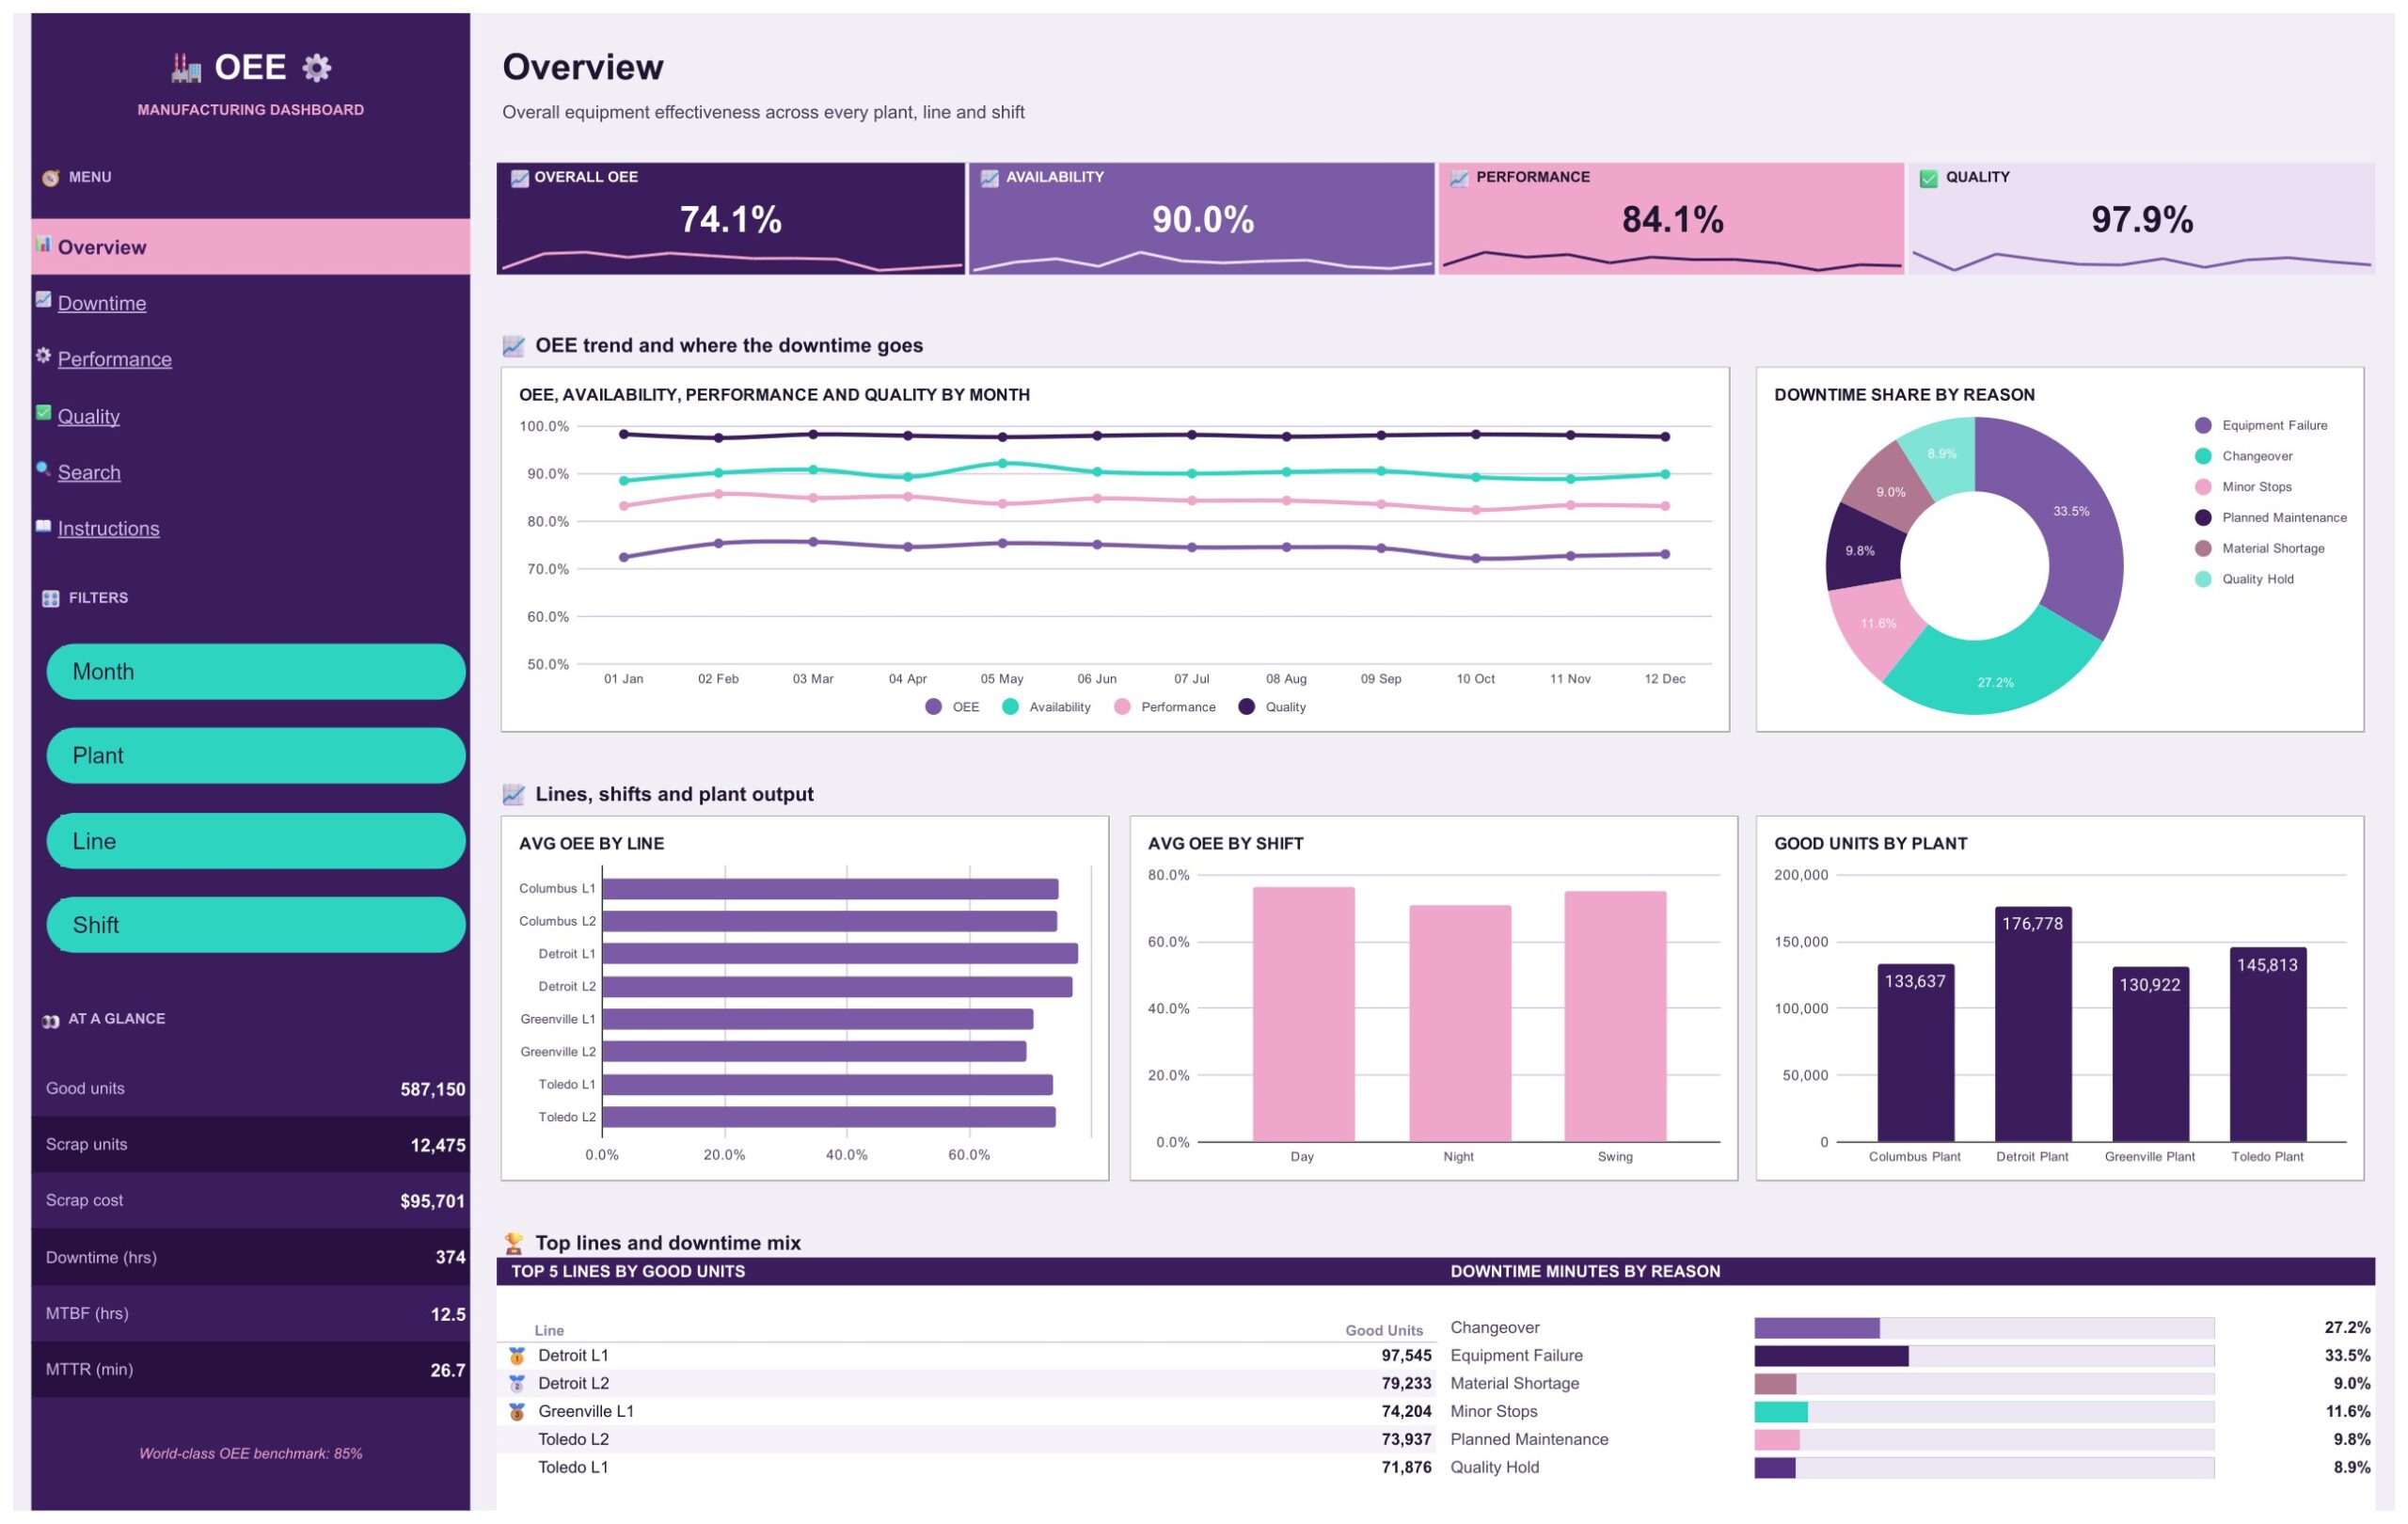
Overview
The landing page: OEE, availability, performance and quality tiles, a monthly trend of all four, downtime share by reason, average OEE by line and shift, good units by plant, and the top five lines by good units.
Downtime
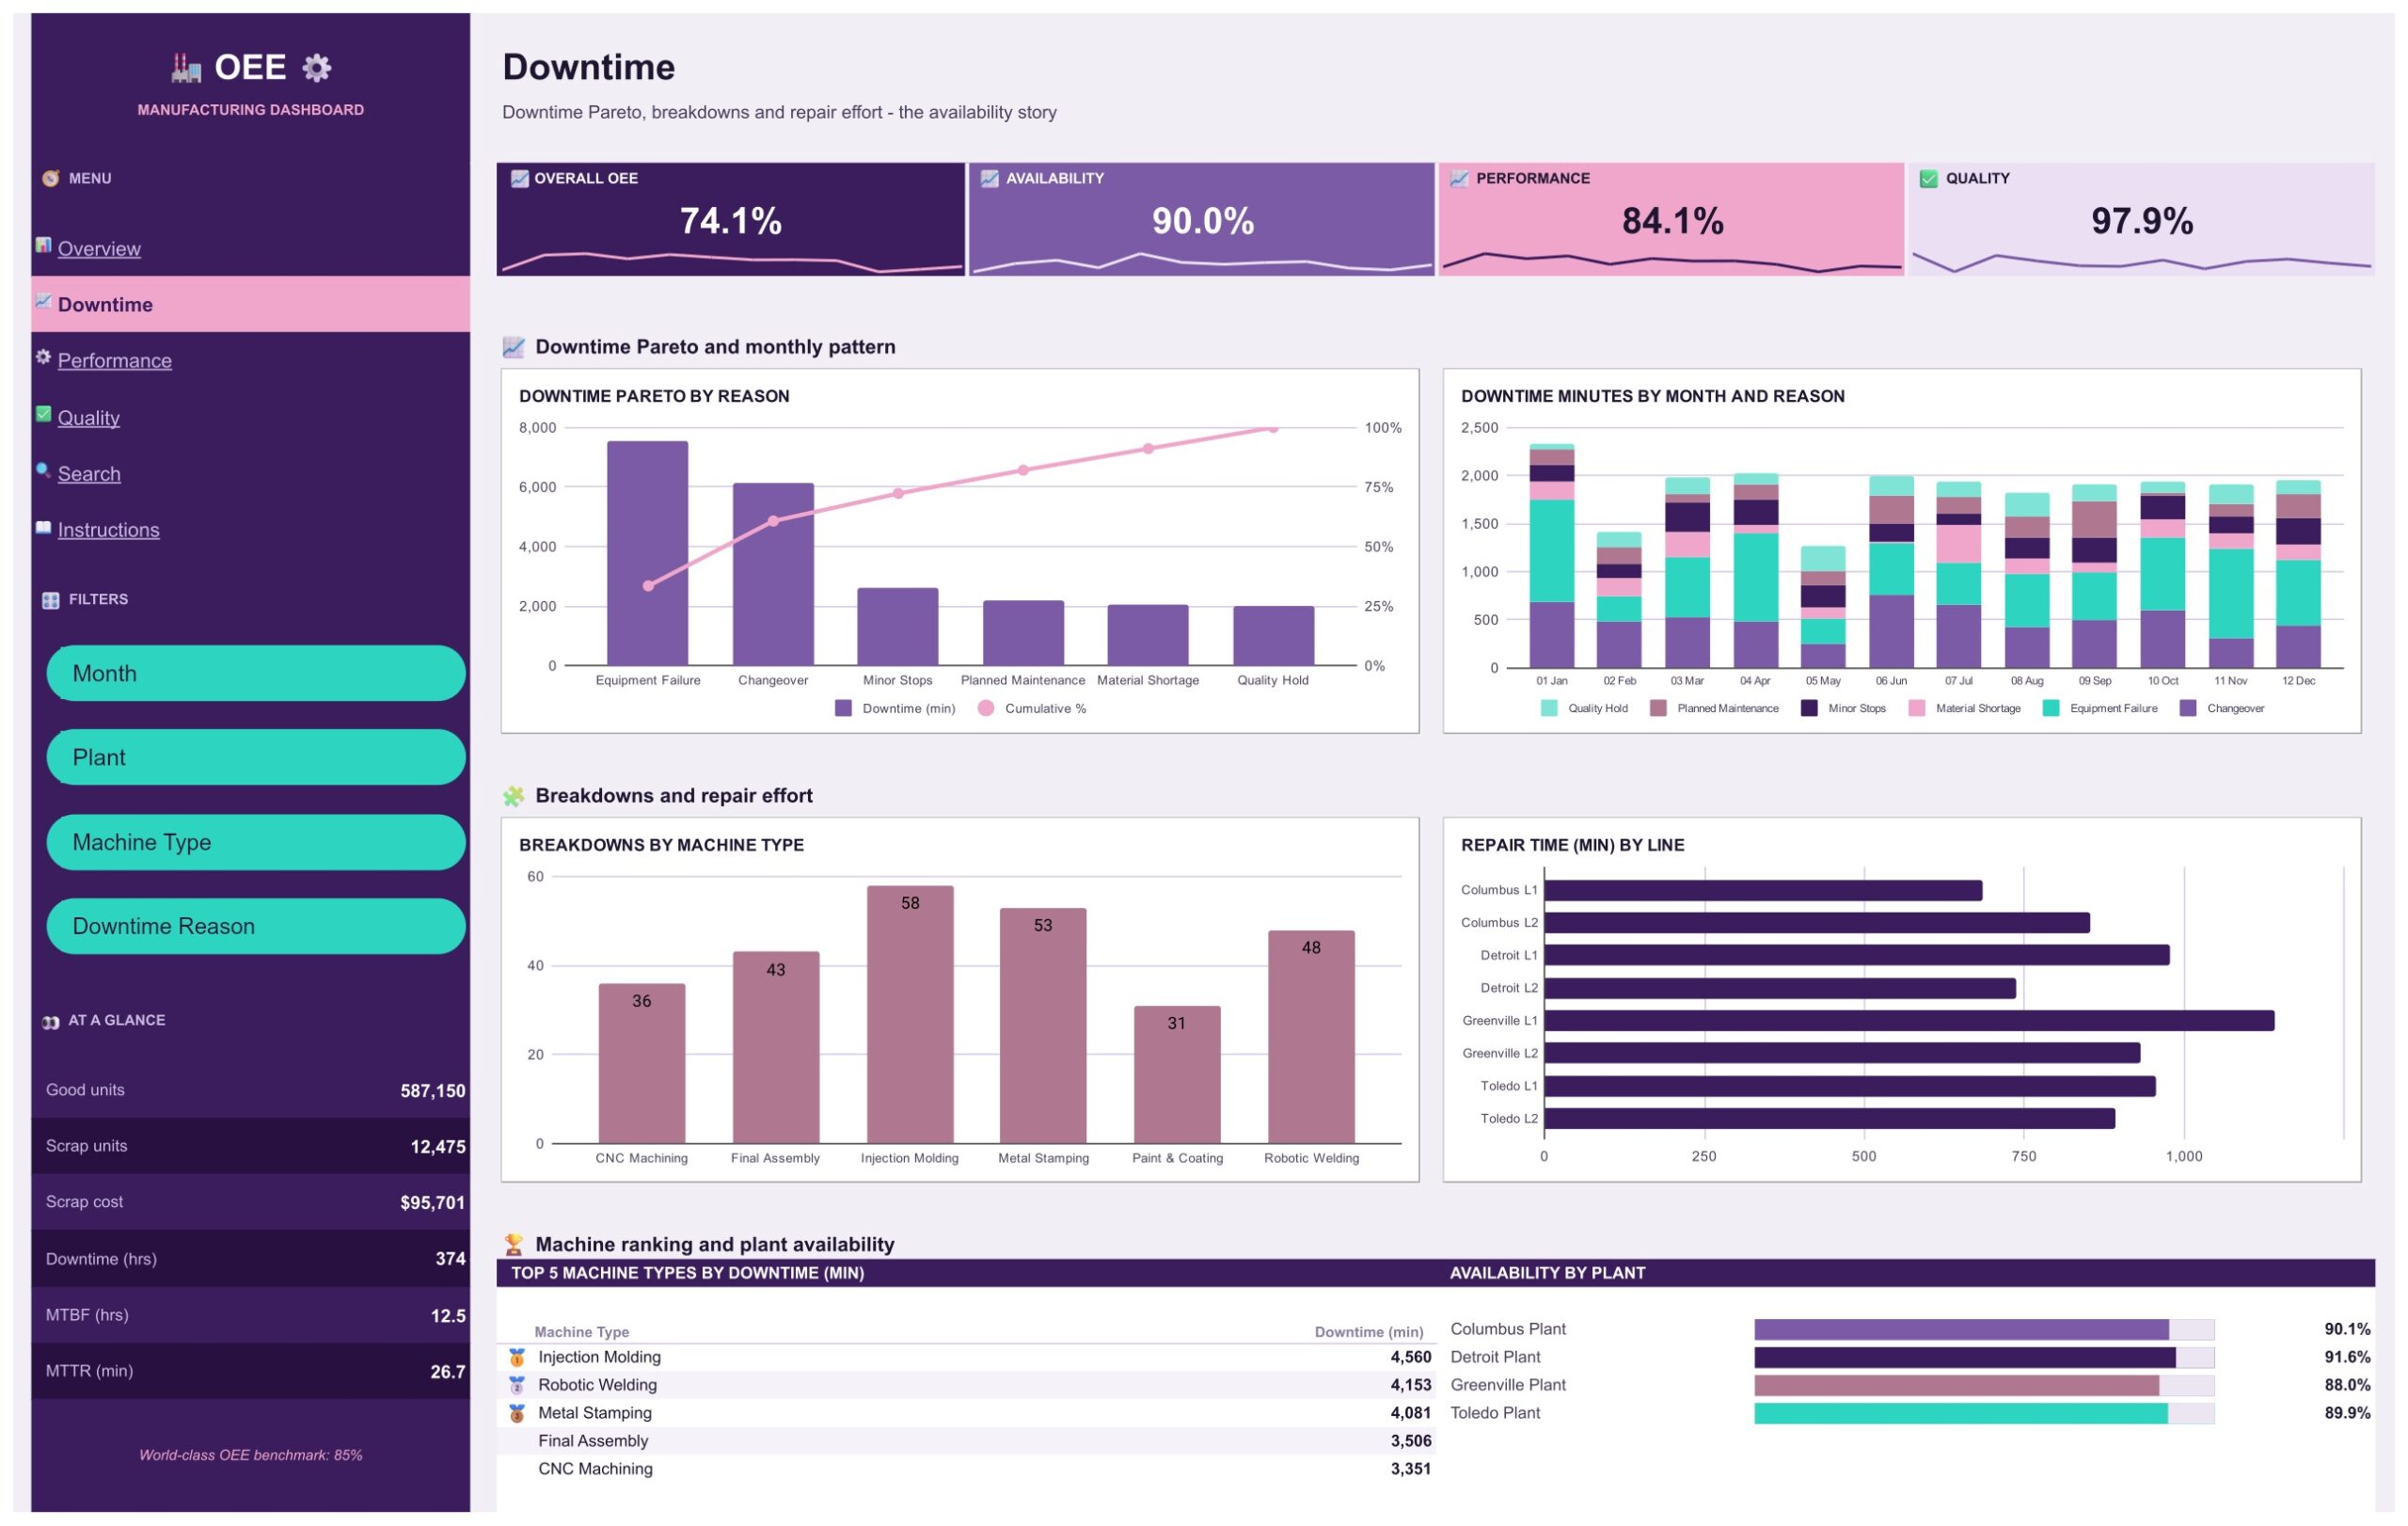
The availability story: a downtime Pareto by reason, downtime minutes by month and reason, breakdowns by machine type, repair time by line, and the top five machine types by downtime.
Performance
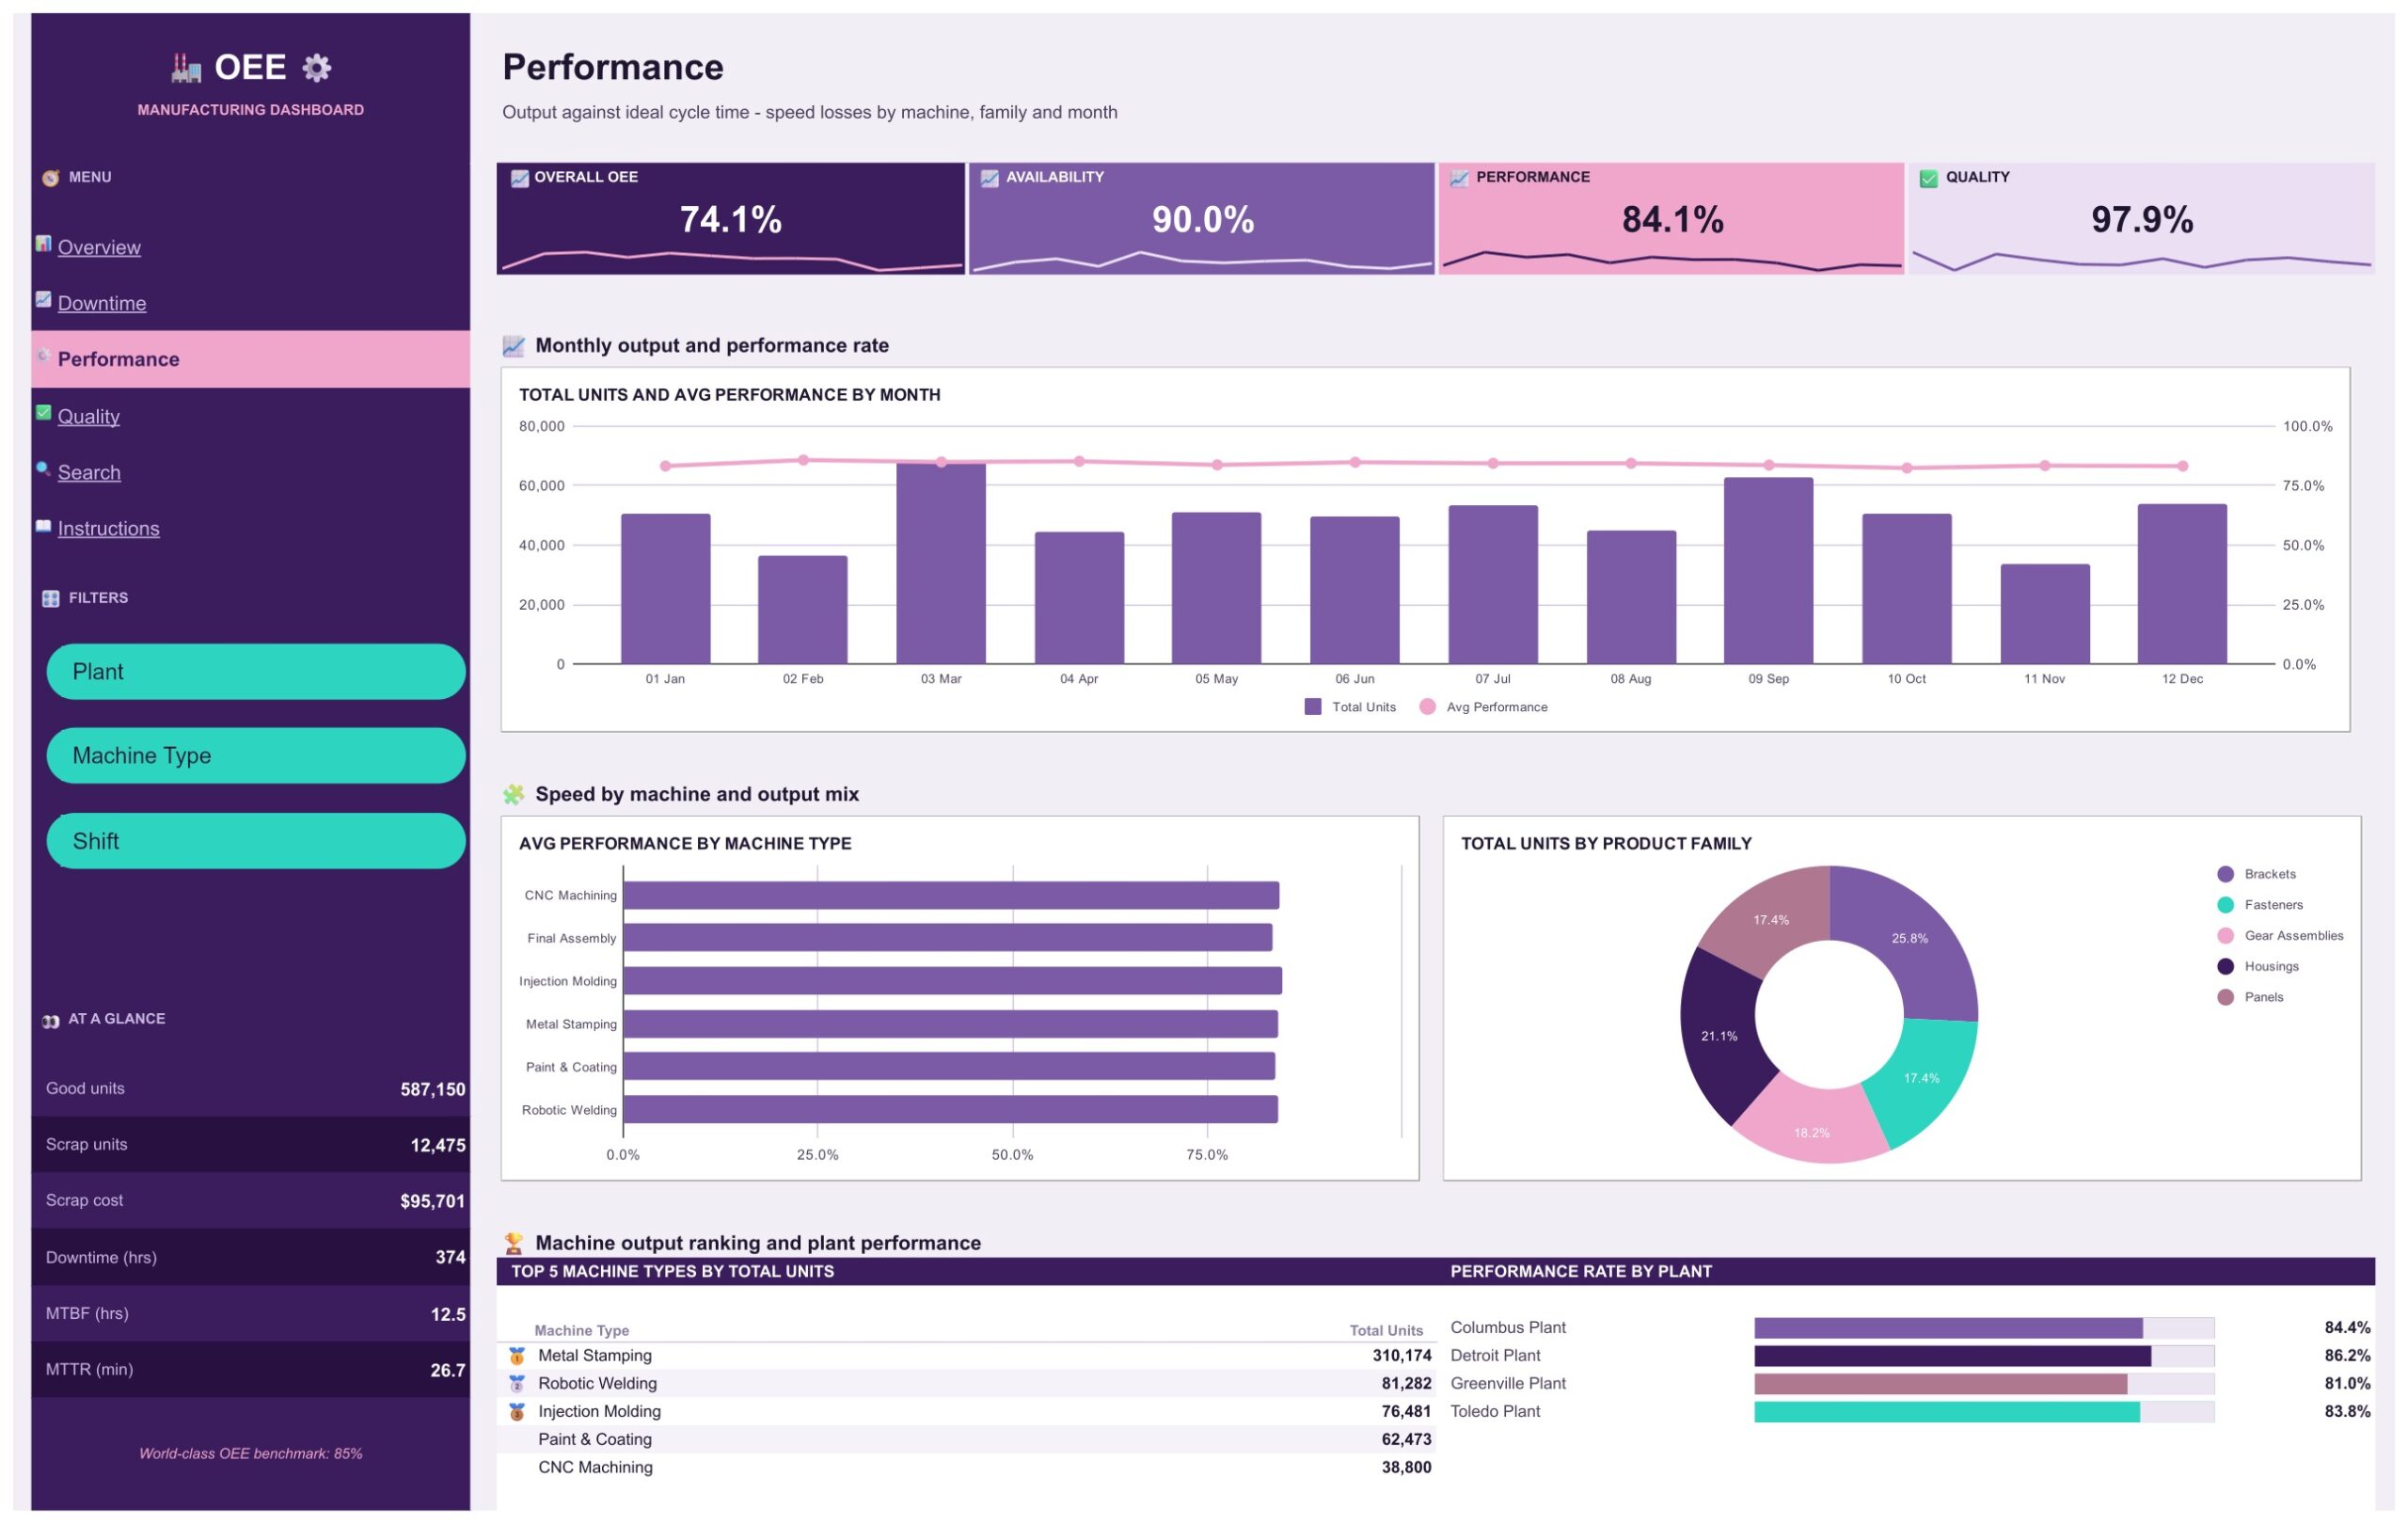
Output against ideal cycle time: total units and average performance by month, average performance by machine type, units by product family and performance rate by plant.
Quality
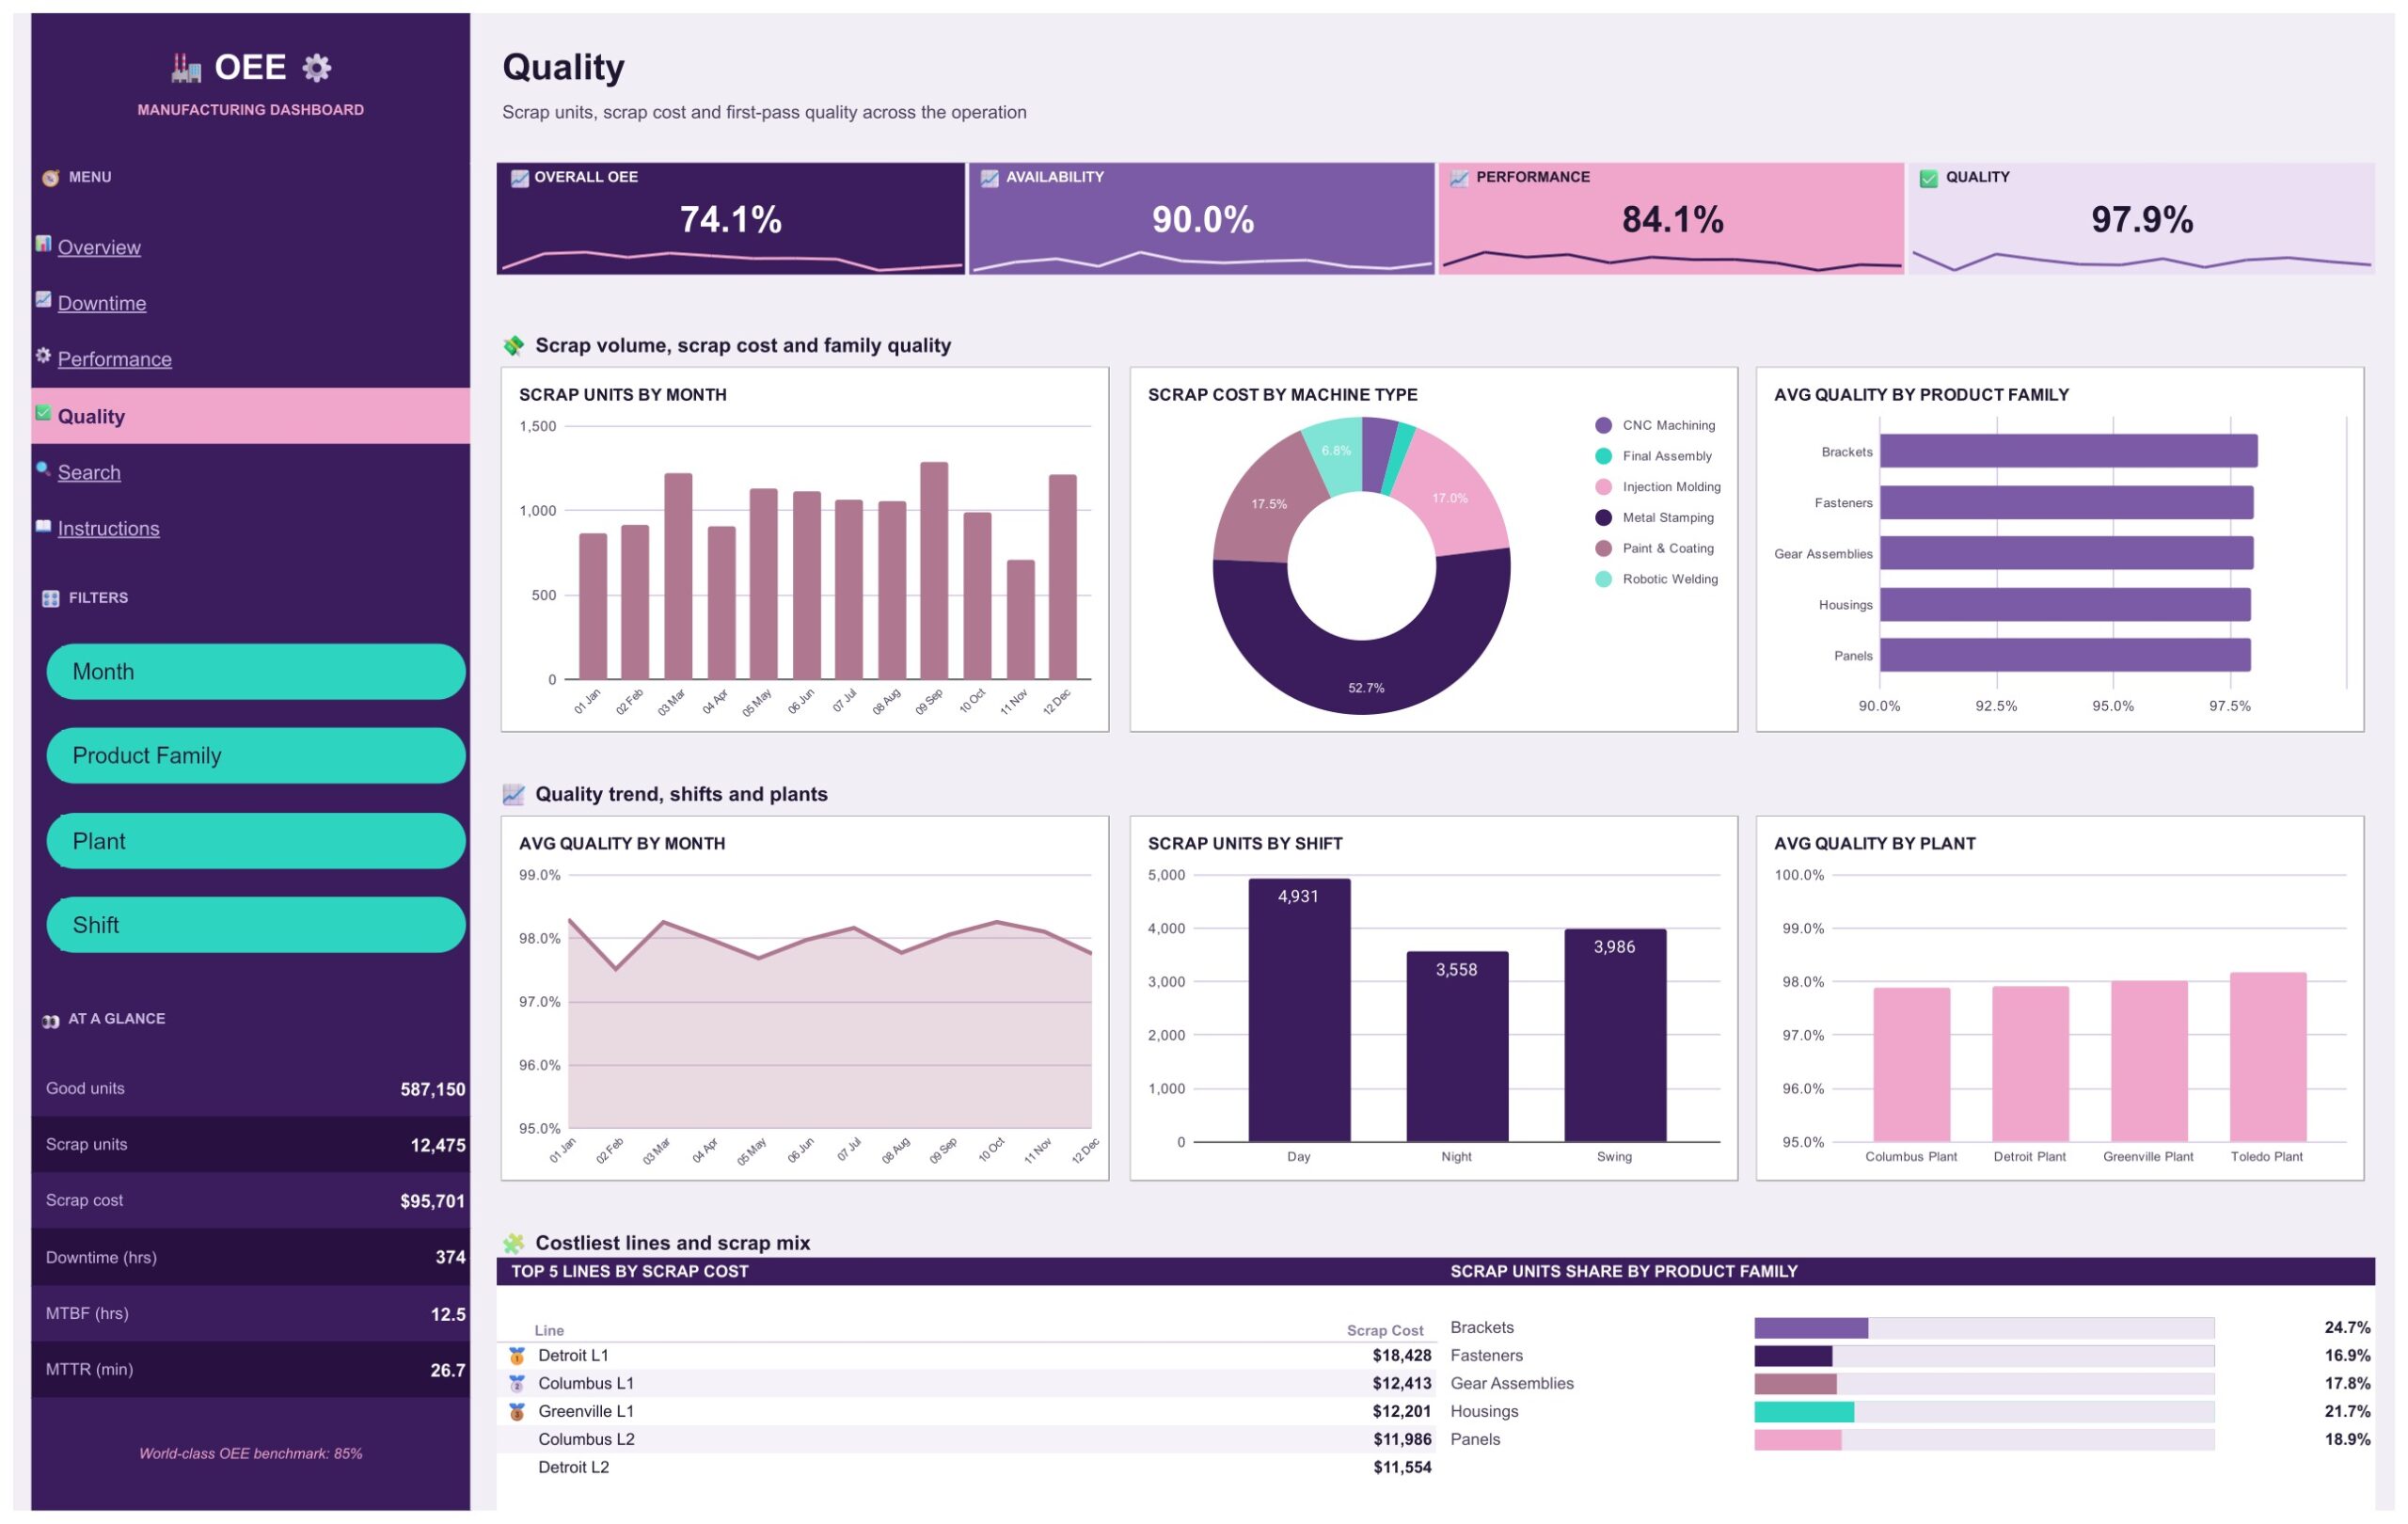
Scrap units by month, scrap cost by machine type, average quality by product family, month, plant and shift, plus the five lines with the highest scrap cost.
Search
Pull any shift record straight from the Data tab by Record ID. The lookup shows plant, line, machine type, shift, downtime reason, planned time, run time, units, scrap and the calculated availability, performance, quality and OEE.
Instructions and Data
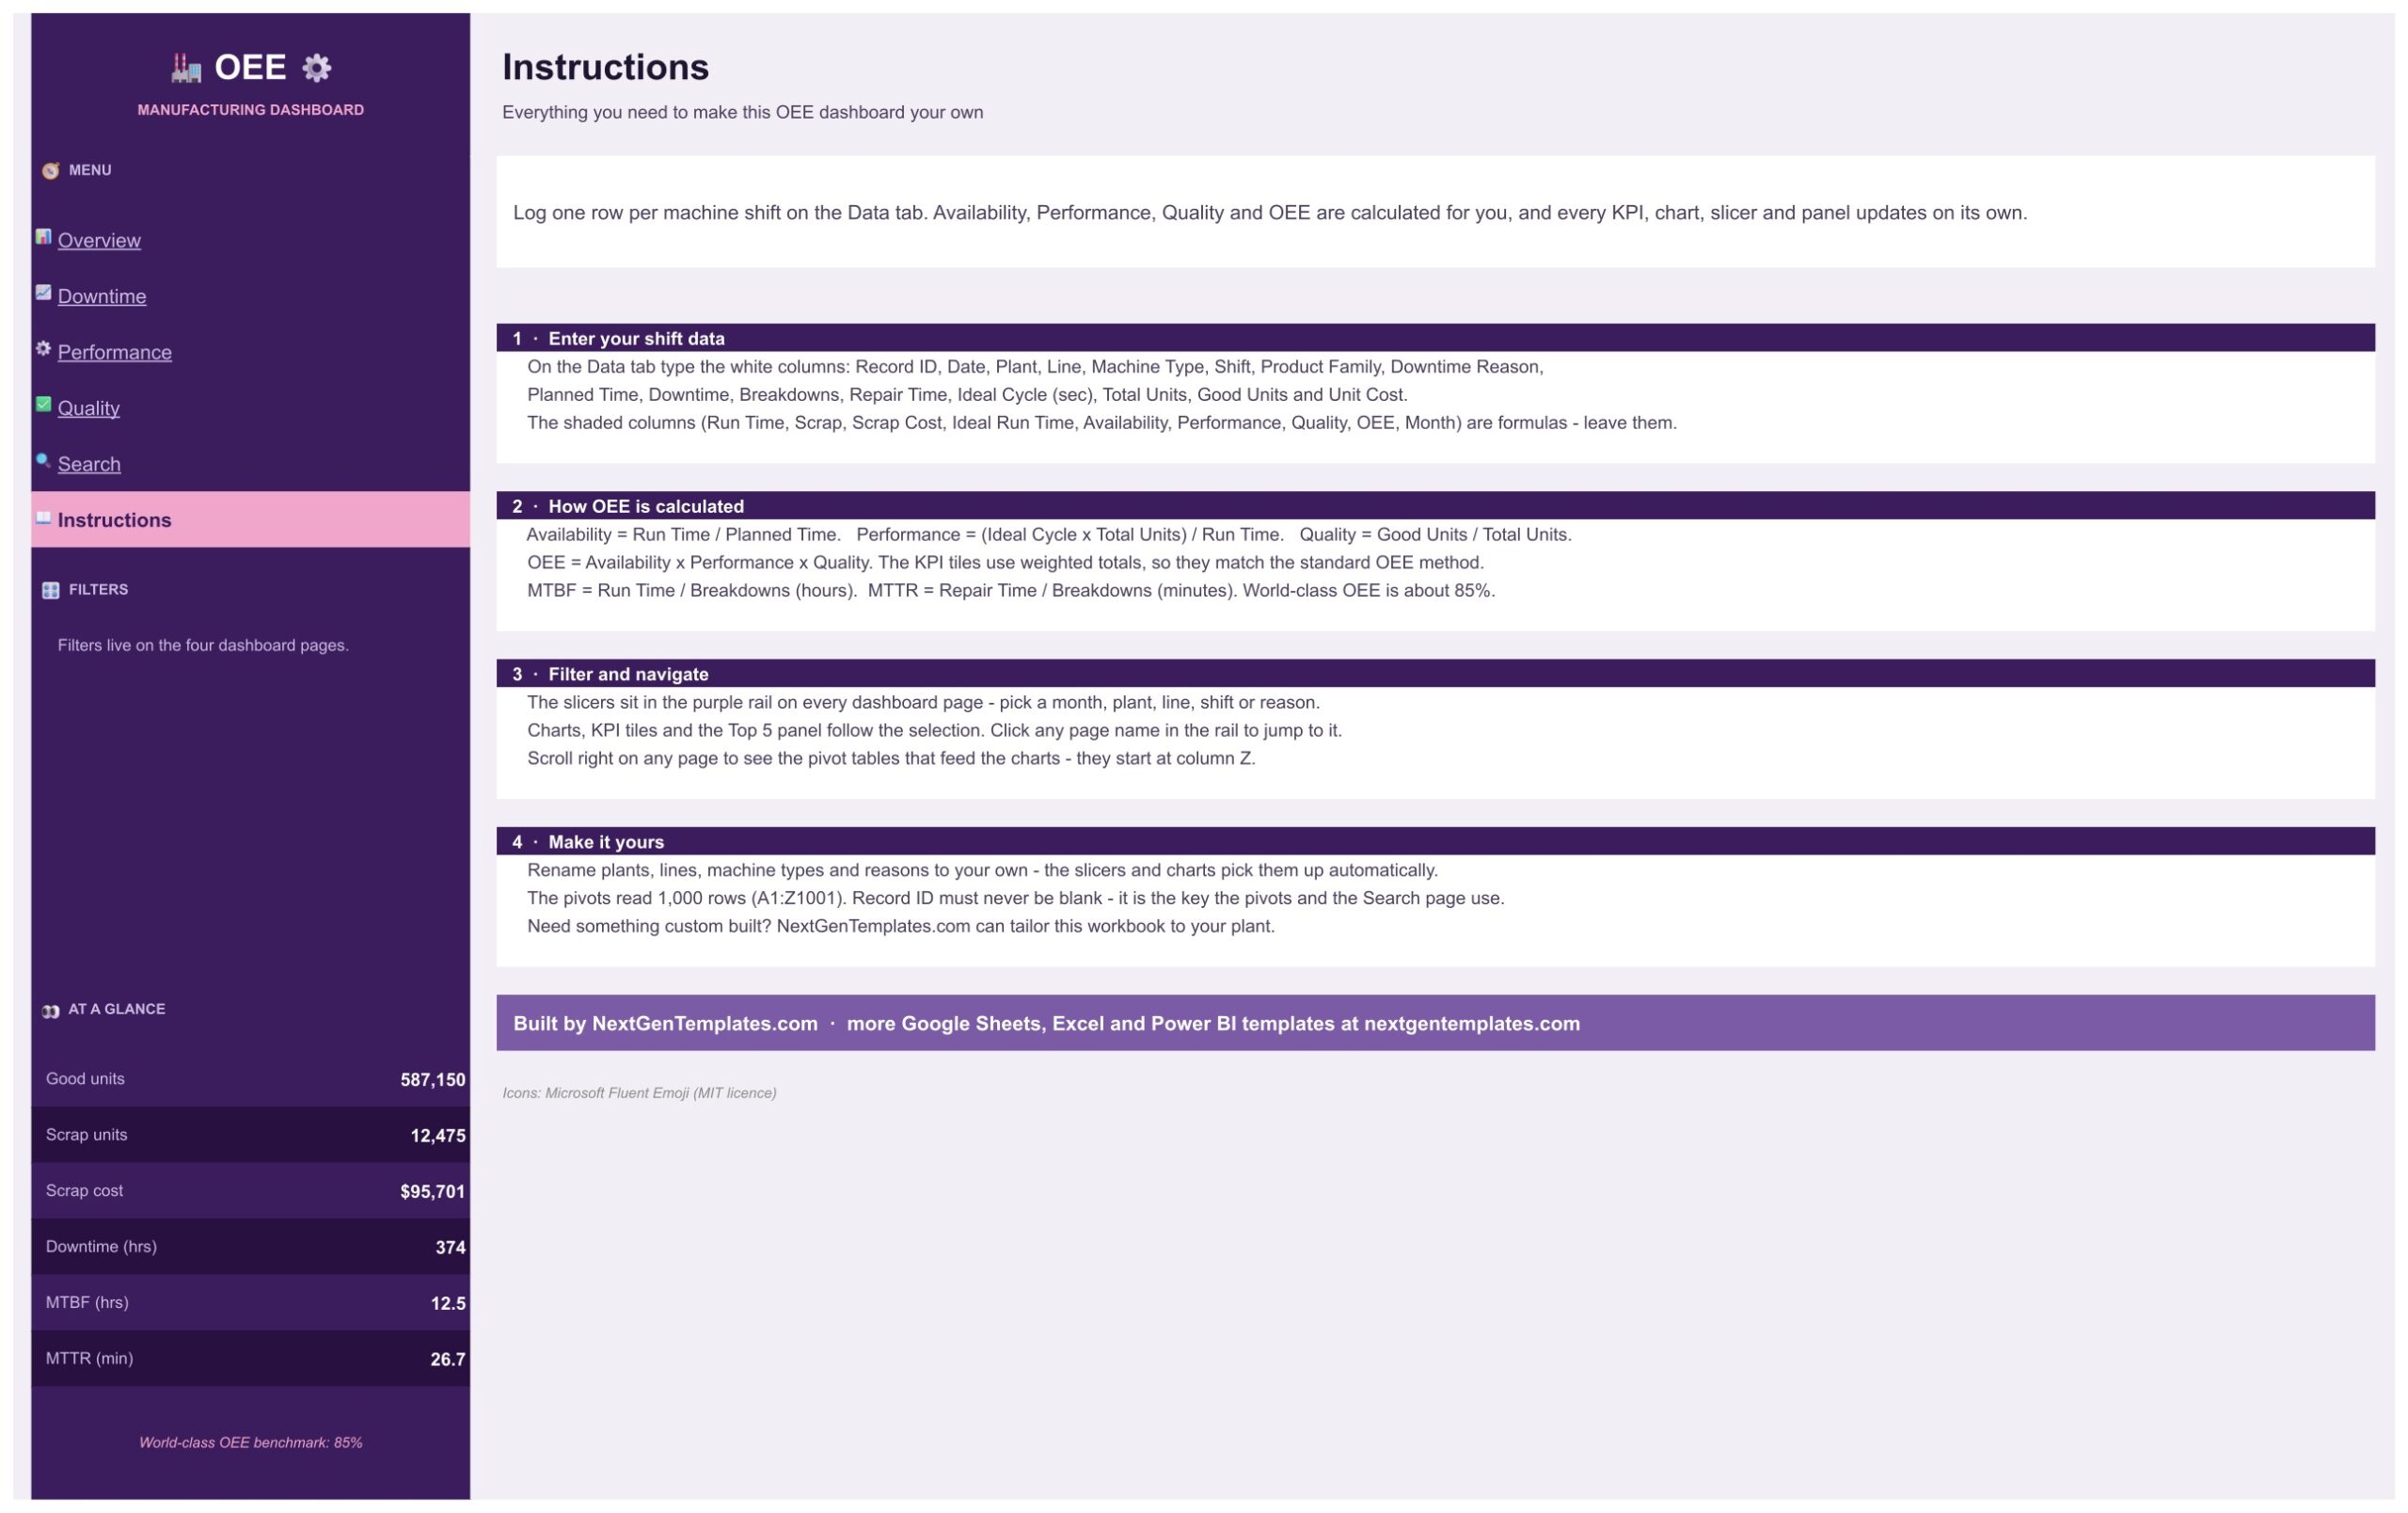
The Instructions page explains how OEE is calculated and how to add rows. The Data tab holds the shift records, with the shaded columns driven by formulas.
How to Use It
- Open the PDF in your download and click the Google Sheets link, then choose File, Make a copy.
- Go to the Data tab and replace the sample rows with your own shift records. Keep the column order.
- Check the formula columns (run time, scrap cost, availability, performance, quality, OEE) are filled down for your new rows.
- Use the filters on the left of each page to focus on a plant, line, shift or month.
Who It Is For
- Plant managers who want one OEE number per plant and line.
- Production supervisors comparing shifts and product families.
- Maintenance teams ranking machine types by downtime, breakdowns and repair time.
- Continuous improvement leads who need a Pareto and a scrap cost view for the next kaizen.
Comparison
| Feature | This dashboard | Manual spreadsheet |
|---|---|---|
| OEE, availability, performance, quality in one view | Yes | Build it yourself |
| Downtime Pareto with cumulative % | Yes | Rebuild each month |
| Filters by plant, line, shift and machine type | Yes | Manual filtering |
| Scrap cost by machine type and line | Yes | Extra formulas |
| Record lookup by ID | Yes | No |
| Live connection to machines or MES | No, you enter shift records | No |
Frequently Asked Questions
Does it connect to my machines?
No. It is a reporting dashboard. You enter or paste your shift records into the Data tab and everything else updates from there.
Do I need an add-on or a script?
No. It uses formulas, pivot tables and slicers that already ship with Google Sheets.
How many records can it hold?
The formulas cover 1,000 shift records. Each record is one machine shift.
Is the sample data real?
No. All plants, lines and figures are fictional and exist only to show how the dashboard looks.
Does it work in Excel?
This edition is built for Google Sheets. You download a PDF that carries the link to make your own copy.
Get Your Copy
One payment, no subscription, instant download. After checkout you receive a PDF with the link to make your own editable copy in Google Sheets.
































Reviews
There are no reviews yet.