

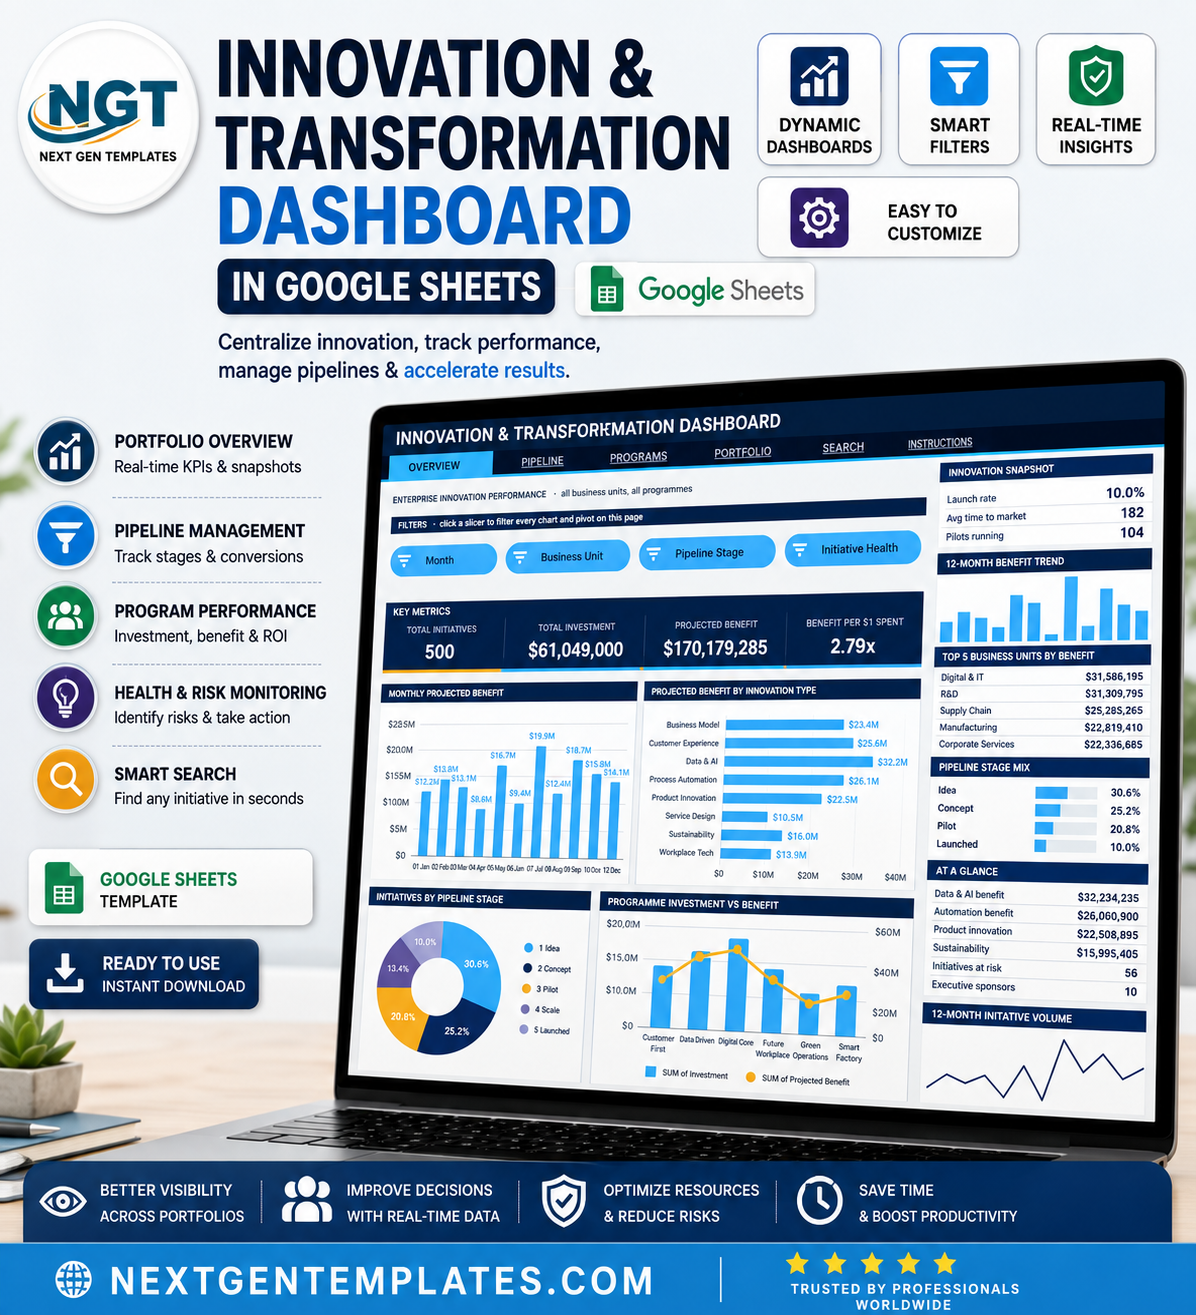
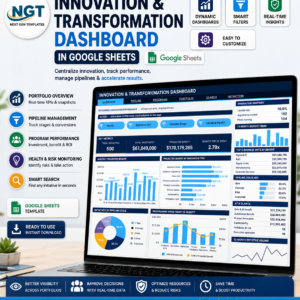
The Innovation & Transformation Dashboard in Google Sheets ships loaded with 500 sample initiatives carrying $61,049,000 of investment against $170,179,285 of projected benefit – a 2.79x return – spread across 8 business units, 6 transformation programmes and a five-stage pipeline that runs Idea, Concept, Pilot, Scale, Launched. It is built by NextGenTemplates, whose Excel and Google Sheets templates reach 300K+ subscribers across two YouTube channels. Every chart on all four analysis pages reads a native Google Sheets pivot table driven by slicers, so nothing snaps when you paste your own rows in. It is delivered as a PDF that carries a Make a copy link: your editable copy lands in your own Google Drive in about a minute, and it stays yours – no subscription, no per-seat fee, no renewal.
Key Features of the Innovation & Transformation Dashboard in Google Sheets
- Six tabs, four of them analytical – Overview, Pipeline, Programs and Portfolio, plus a Search lookup and an Instructions guide.
- 16 slicer-aware charts – four per analysis page, each one reading its own pivot table parked to the right of the page so you can inspect the numbers behind any visual.
- 16 KPI cards – Total Initiatives, Total Investment, Projected Benefit, Benefit per $1 Spent, Ideas Submitted, Concepts in Work, Pilots Running, Launched, Active Programmes, On Track, At Risk or Delayed, Programme Investment, Avg Time to Market, R&D Benefit, Digital & IT Spend and Portfolio ROI.
- Four slicers on every analysis page – drawn from Month, Business Unit, Pipeline Stage, Initiative Health, Innovation Type, Innovation Horizon, Programme, Executive Sponsor and Funding Source.
- A snapshot rail down the right of each page – three headline stats, a 12-month benefit trend, a Top 5 table, a share-of-mix bar list, an At a Glance summary and a 12-month initiative volume sparkline.
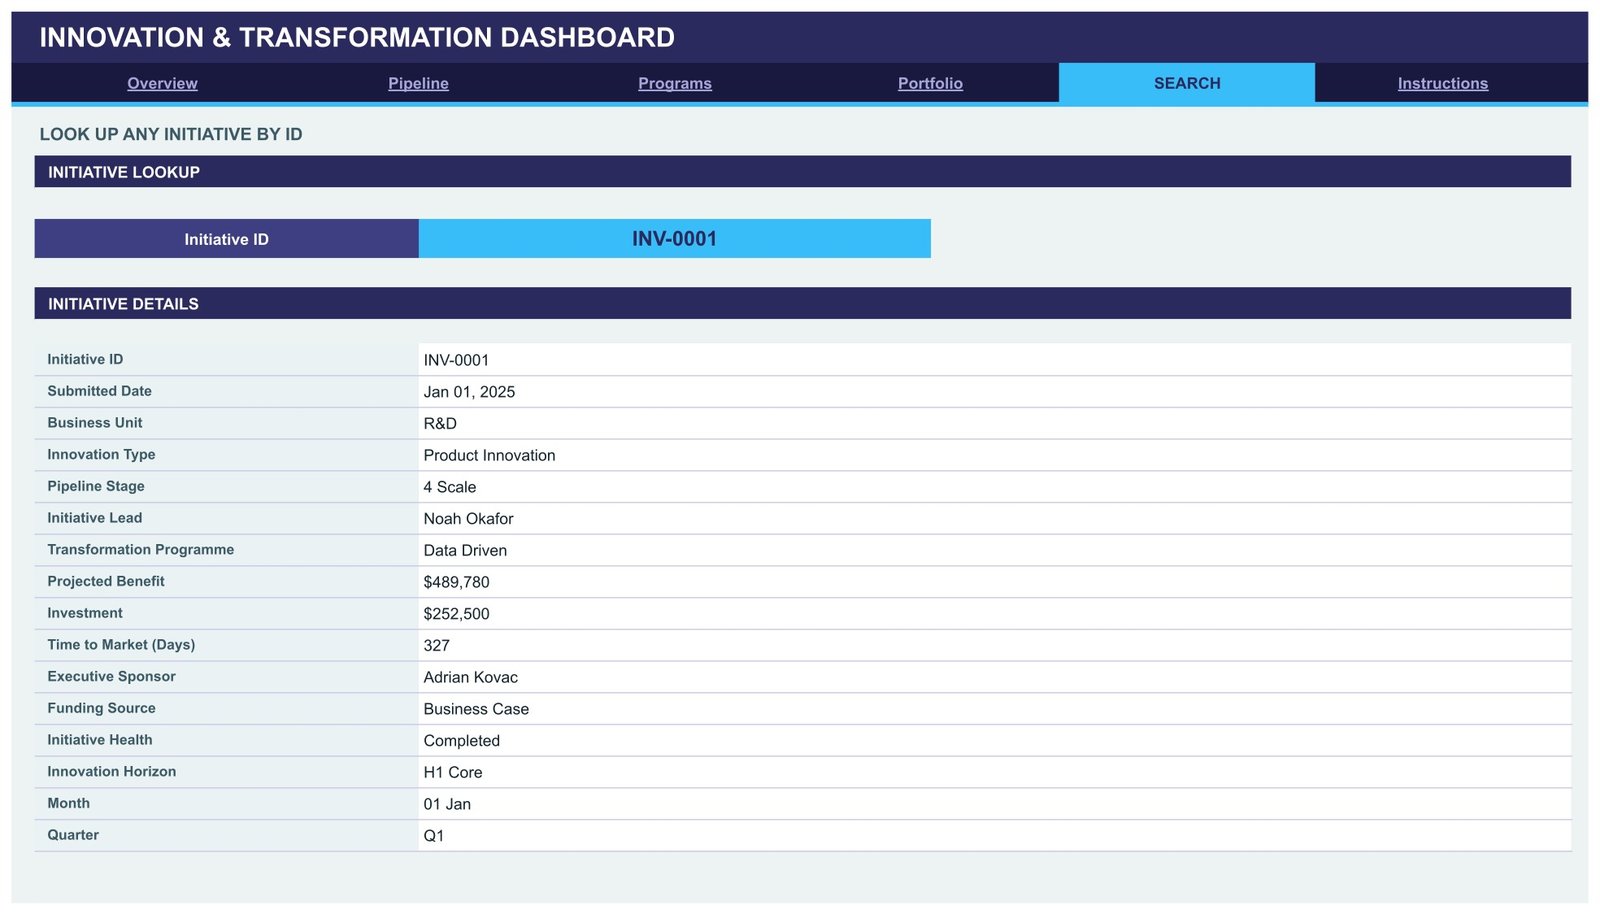
- Initiative-level Search page – pick any Initiative ID such as INV-0001 and read all 16 fields of that record on one screen.
- 1,000 rows of headroom – pivots, slicers and every formula already reach row 1001, so pasted rows are picked up without editing a single range.
- One-line recolour – the design uses a single contrast pair, ink #2A2A5E against accent #38BDF8, plus amber #FBBF24 for second chart series.
What’s Inside the Innovation & Transformation Dashboard in Google Sheets
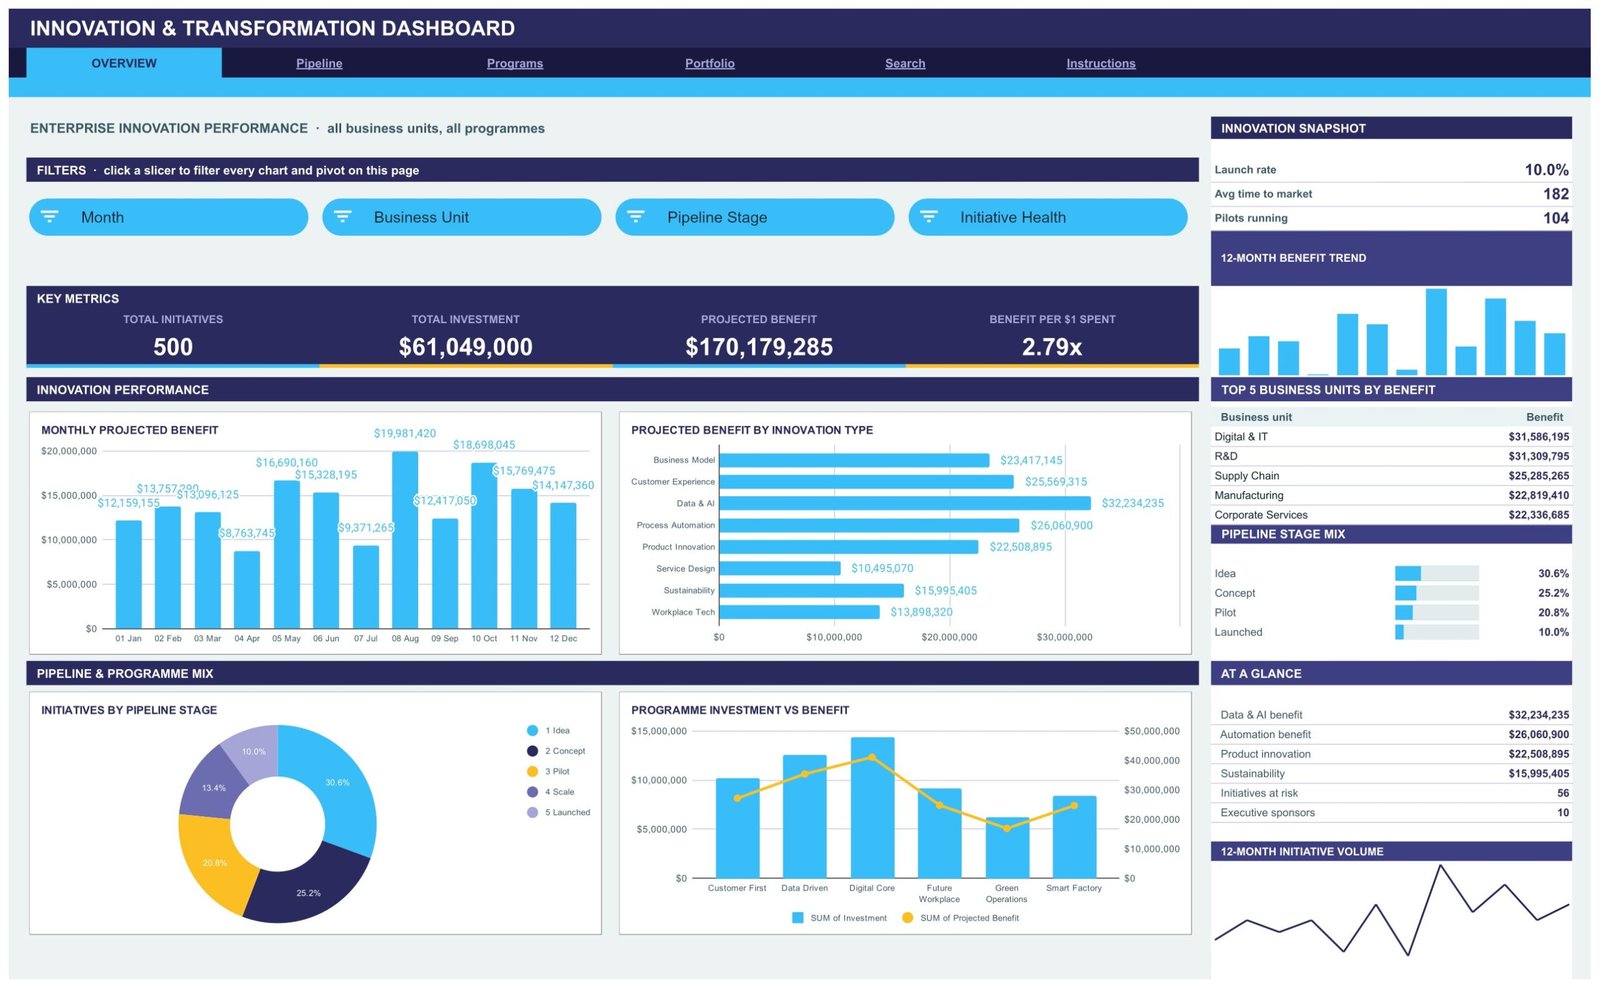
Overview – enterprise innovation performance
The landing page answers the board question in one screen: 500 initiatives, $61,049,000 invested, $170,179,285 of projected benefit, 2.79x benefit per dollar. Monthly Projected Benefit and Projected Benefit by Innovation Type sit above Initiatives by Pipeline Stage and Programme Investment vs Benefit, with Month, Business Unit, Pipeline Stage and Initiative Health slicers driving all four at once.
Pipeline – the idea funnel
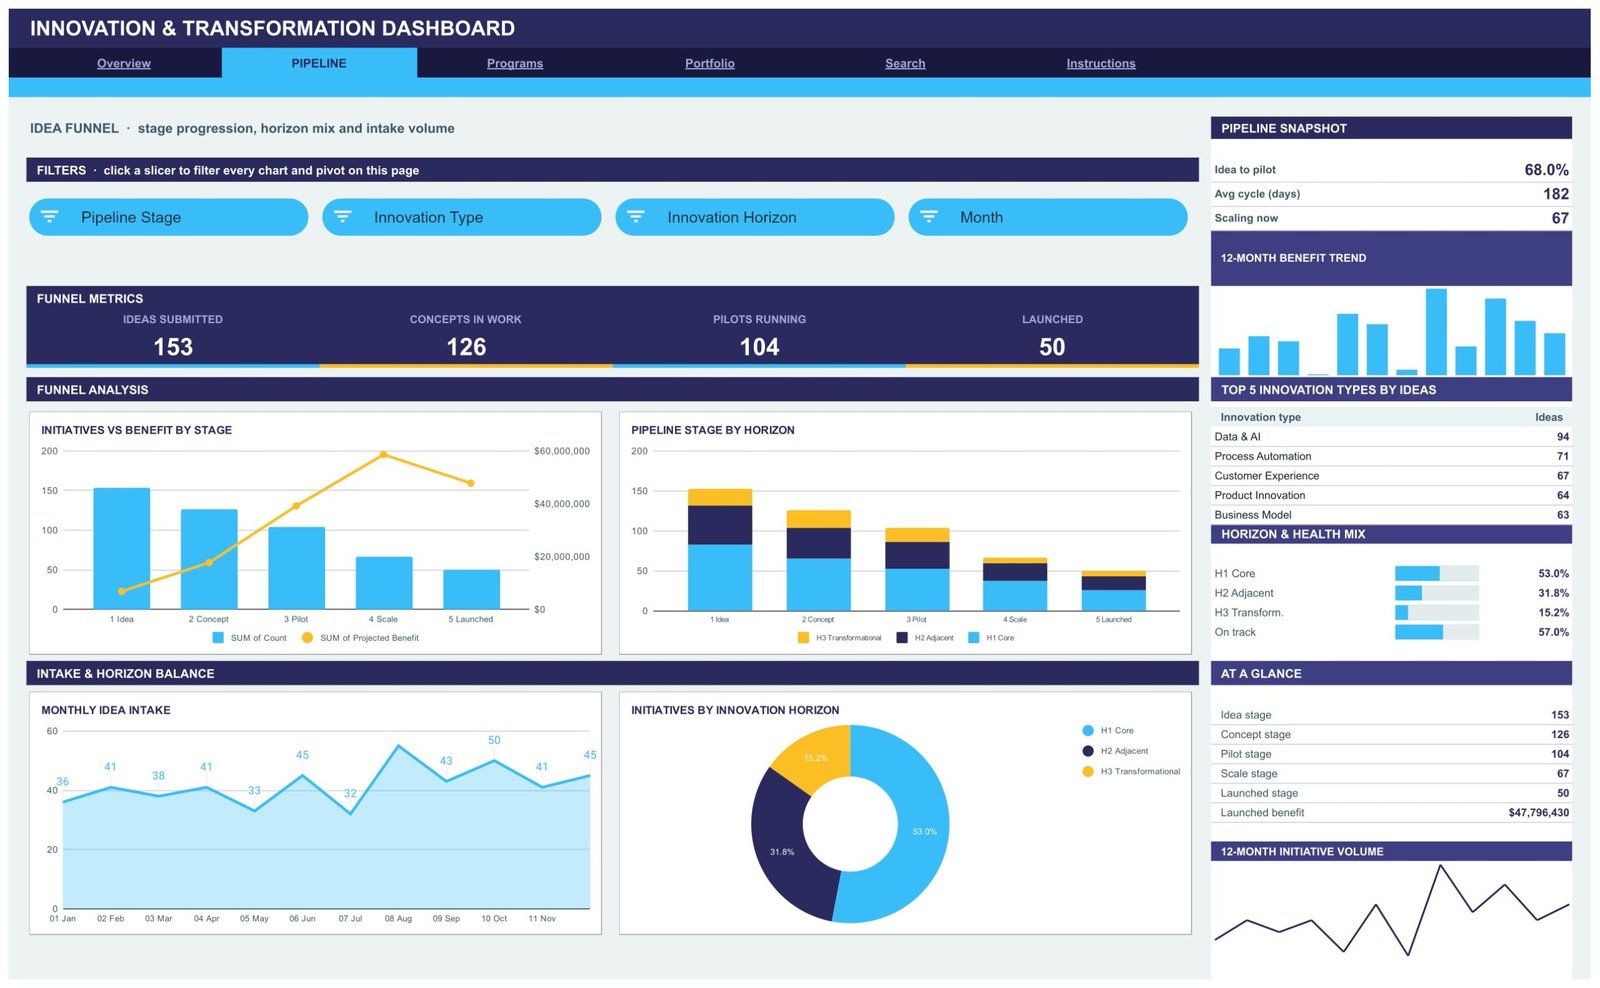
153 ideas submitted, 126 concepts in work, 104 pilots running, 50 launched. Initiatives vs Benefit by Stage plots count against projected benefit, Pipeline Stage by Horizon stacks H1 Core, H2 Adjacent and H3 Transformational inside each stage, Monthly Idea Intake tracks submission volume, and Initiatives by Innovation Horizon shows the 53.0 / 31.8 / 15.2 split. The snapshot rail reports a 68.0% idea-to-pilot rate and a 182-day average cycle.
Programs – sponsors, funding and delivery health
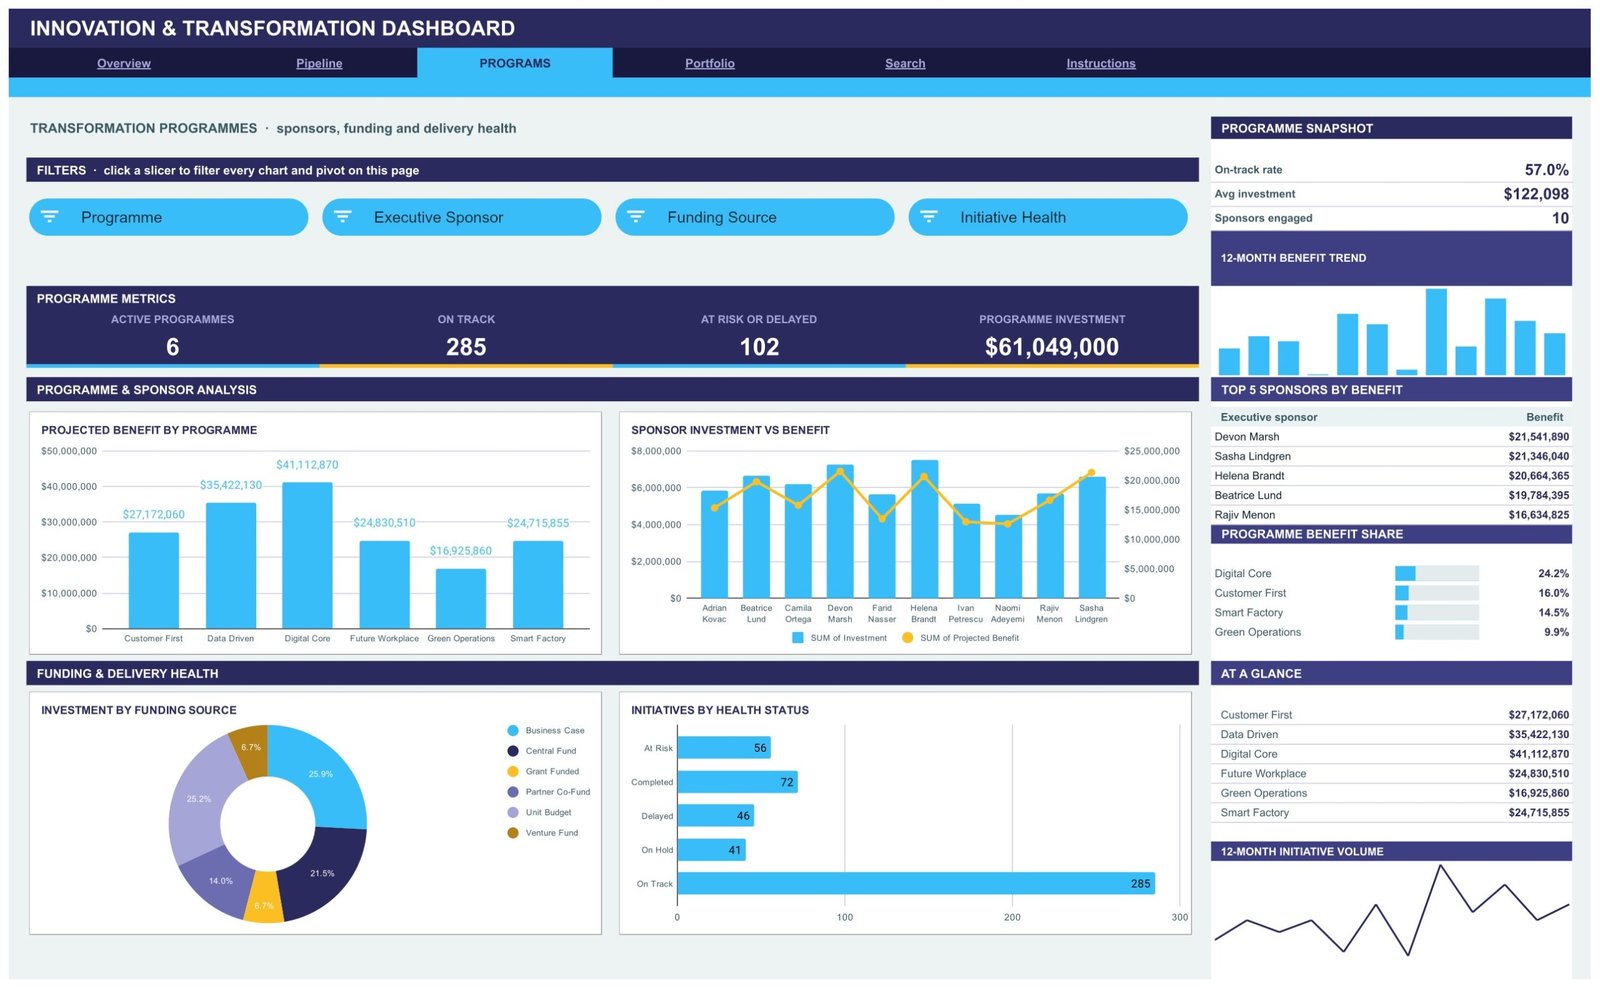
Six transformation programmes – Customer First, Data Driven, Digital Core, Future Workplace, Green Operations and Smart Factory – measured on Projected Benefit by Programme and Sponsor Investment vs Benefit across 10 executive sponsors. Investment by Funding Source splits Business Case, Central Fund, Grant Funded, Partner Co-Fund, Unit Budget and Venture Fund, while Initiatives by Health Status counts 285 on track against 56 at risk, 46 delayed and 41 on hold.
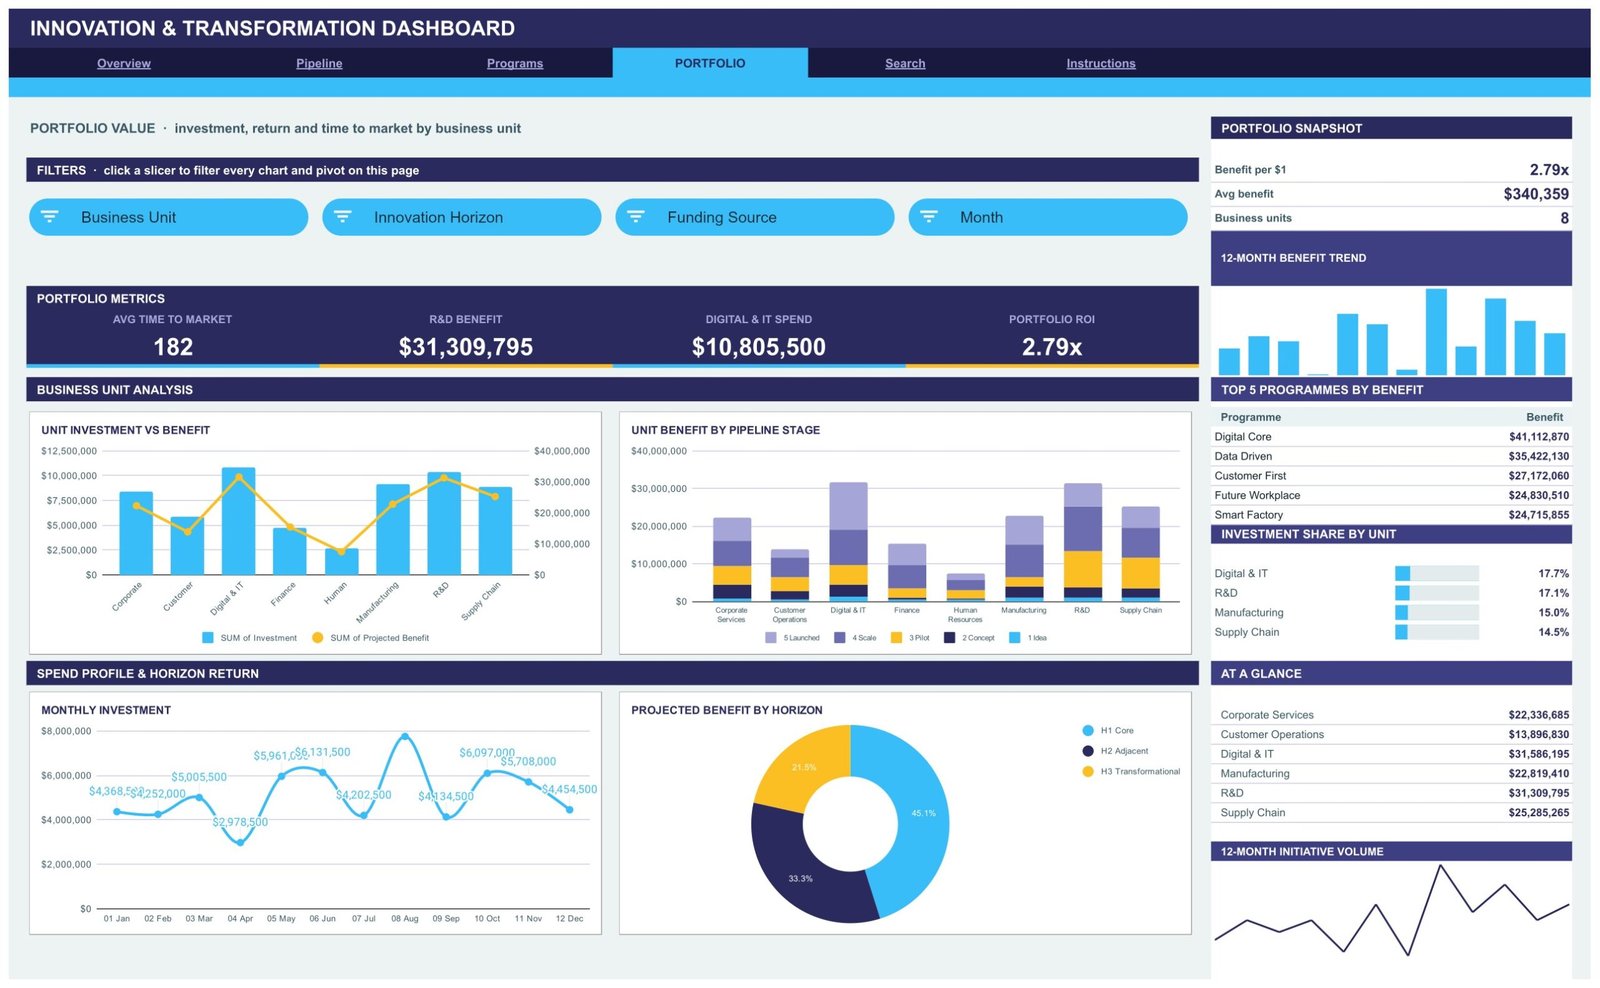
Portfolio – investment, return and time to market
Eight business units compared on Unit Investment vs Benefit and Unit Benefit by Pipeline Stage, with Monthly Investment and Projected Benefit by Horizon underneath. R&D returns $31,309,795, Digital & IT spends $10,805,500, average benefit per initiative is $340,359 and average time to market is 182 days.
Search – one initiative at a time
Choose an Initiative ID and the page returns Submitted Date, Business Unit, Innovation Type, Pipeline Stage, Initiative Lead, Transformation Programme, Projected Benefit, Investment, Time to Market, Executive Sponsor, Funding Source, Initiative Health, Innovation Horizon, Month and Quarter for that record.
Instructions – how the build works
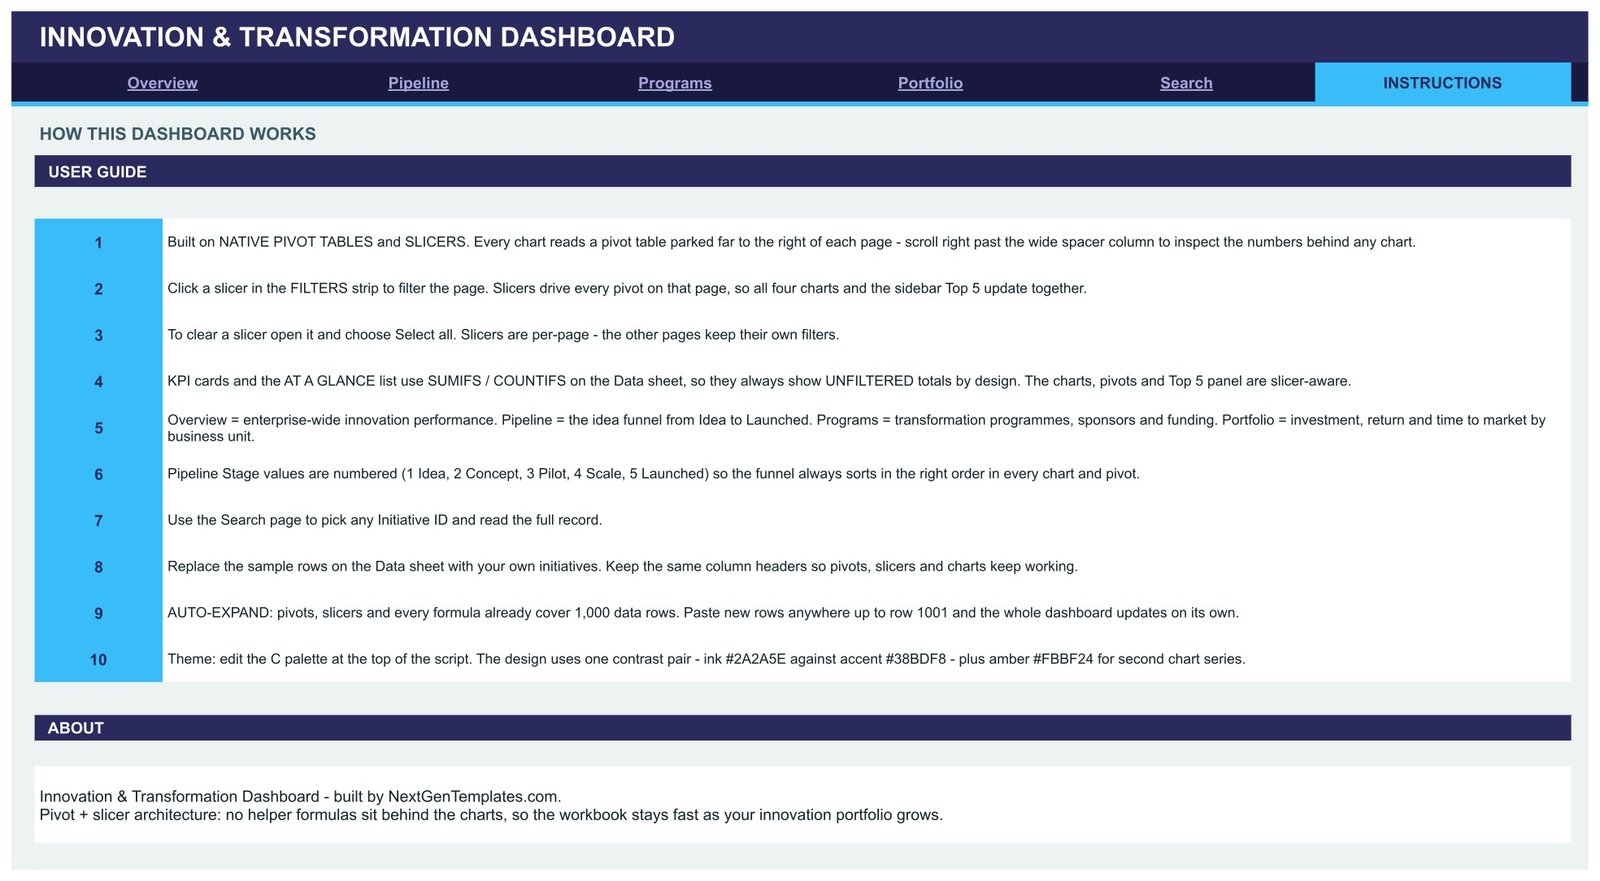
Ten numbered steps covering slicer behaviour, why the KPI cards use SUMIFS and stay unfiltered by design, how the numbered pipeline stages keep the funnel in order, and how to replace the sample rows on the Data sheet.
Innovation & Transformation Dashboard vs. Microsoft Excel vs. Paid Innovation-Management SaaS – Where This Fits
| Item | This Google Sheets dashboard | Excel dashboard build | Paid innovation SaaS |
|---|---|---|---|
| Cost | $9.99 once | $20-$30 once, plus Office | $30-$90 per user per month |
| Platform | Google Sheets, browser only | Desktop Excel | Vendor cloud |
| Setup time | Under 5 minutes | 15-30 minutes | 2-6 weeks of onboarding |
| Real-time team collaboration | Yes, native | Only via OneDrive co-authoring | Yes |
| Mobile access | Yes, Sheets app | Limited | Yes |
| Customisable fields | Edit any column on the Data sheet | Yes | Admin-controlled, often paid tier |
| Share with link | Yes | File send or cloud link | Yes, seat required |
| Year-1 cost at 5 users | $9.99 | About $25 | $1,800-$5,400 |
| Slicer-driven pivot charts | 16, all native | Yes | Fixed vendor visuals |
| Initiative-level lookup | Built in on the Search tab | Needs a lookup build | Yes |
Who This Template Is For – and Who It’s Not For
It fits innovation managers, transformation office leads, PMO analysts, R&D coordinators and strategy teams who need a stage-gate view of an initiative portfolio without buying seats for everyone who only ever reads the numbers. It also fits consultants who present portfolio health to a client every month and want the file to live in the client’s Drive afterwards.Innovation & Transformation Dashboard in Google Sheets
It is not for you if you need workflow automation – approval routing, stage-gate sign-offs, idea-submission portals or automatic reminders. Nothing here writes back to a system of record. It is also the wrong tool if your initiative data lives in Jira or ServiceNow and you need a live connection rather than a paste; and if you run more than a few thousand initiatives, a database-backed tool will serve you better.Innovation & Transformation Dashboard in Google Sheets
How to Use the Innovation & Transformation Dashboard
- Open the PDF in your download and click the Make a copy link. The dashboard lands in your own Google Drive.
- Open the Data sheet and replace the sample rows with your initiatives. Keep the column headers exactly as they are so pivots, slicers and charts keep working.
- Paste anywhere up to row 1001 – the ranges already cover it.
- Go to any analysis page and click a slicer in the FILTERS strip. All four charts, the pivots and the Top 5 panel update together.
- To clear a filter, open the slicer and choose Select all. Slicers are per page, so each tab keeps its own view.
- Use the Search tab to pull up a single initiative by ID when someone asks about one line item.
- Share the file with your team using Google’s normal sharing controls.Innovation & Transformation Dashboard in Google Sheets
Real-World Use Cases
Priya, innovation portfolio manager at a manufacturer. She filters Overview to Manufacturing and the Pilot stage before the monthly steering call, then screenshots Programme Investment vs Benefit into the pack. What used to be an afternoon of pivot rebuilding is now two clicks.
Daniel, transformation office lead. He lives on the Programs tab, filtering by Executive Sponsor to see whose portfolio is drifting. The 285-on-track against 102-at-risk-or-delayed split is the number his steering committee asks for first.
Amelia, strategy consultant. She loads a client’s initiative register, uses the Portfolio tab to show where the 2.79x return actually comes from, and hands the sheet over at the end of the engagement so the client keeps the view.
Frequently Asked Questions
What exactly do I download?
A PDF. It contains the Make a copy link for the Google Sheets file, plus setup notes. Click the link, click Make a copy, and the dashboard is in your Drive.
Do I need to know pivot tables to use it?
No. The pivots are already built and parked to the right of each page. You only interact with the slicers.Innovation & Transformation Dashboard in Google Sheets
How many initiatives can it hold?
Ranges, pivots and slicers reach row 1001, so 1,000 initiatives out of the box. Extending further means dragging the pivot source ranges down.Innovation & Transformation Dashboard in Google Sheets
Why do the KPI cards ignore my slicer selection?
That is deliberate. The KPI cards and the At a Glance list use SUMIFS and COUNTIFS against the Data sheet so they always show the unfiltered enterprise total, giving you a constant reference while the charts move.
Can I change the colours?
Yes. The design uses one contrast pair – ink #2A2A5E with accent #38BDF8 – plus amber #FBBF24 for second series. Edit the palette at the top of the sheet’s script, or recolour charts by hand.
Can I add my own columns?
Yes, add them to the right of the existing Data sheet columns. Do not rename or reorder the existing headers, because the pivots reference them.Innovation & Transformation Dashboard in Google Sheets
Is it a one-time payment?
Yes. Pay once, keep the file, use it on as many projects as you like. There is no subscription and no seat count.Innovation & Transformation Dashboard in Google Sheets
About the Author
Built by PK – Microsoft Certified Professional with 15+ years of Excel, Google Sheets, and Power BI experience. Founder of NextGenTemplates, reaching 300K+ subscribers across YouTube channels. Every template is hand-built and tested before release.
Explore Related Templates
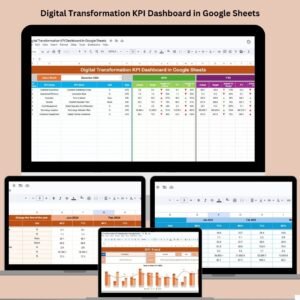
- Digital Transformation KPI Dashboard in Google Sheets – the KPI-scorecard companion to this portfolio view.
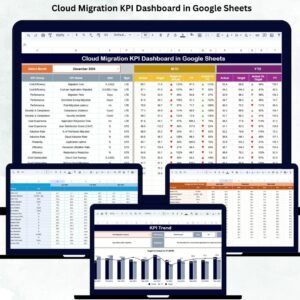
- Cloud Migration KPI Dashboard in Google Sheets – for the technology half of a transformation programme.
- Project Management Office (PMO) Dashboard in Google Sheets – delivery tracking once initiatives leave the pipeline.
- Knowledge Management Dashboard in Google Sheets – captures what the programmes learn.
- Environmental, Social and Governance (ESG) Dashboard in Google Sheets – pairs with the Green Operations programme.
Browse the full Google Sheets templates catalogue or the Google Sheets dashboards category for more.
Get the Innovation & Transformation Dashboard in Google Sheets for $9.99 (regular $16.99) and have your initiative portfolio on screen in under five minutes. One payment, instant delivery, yours to keep.Innovation & Transformation Dashboard in Google Sheets
Watch the step-by-step video Demo:
Last updated: 14 August 2026.






























Reviews
There are no reviews yet.