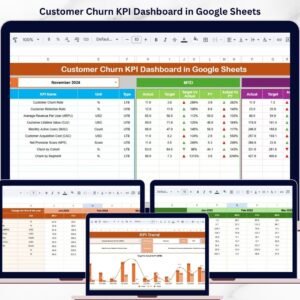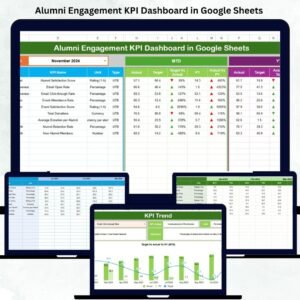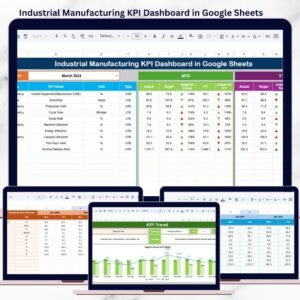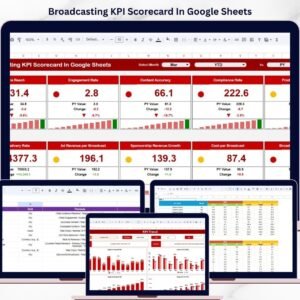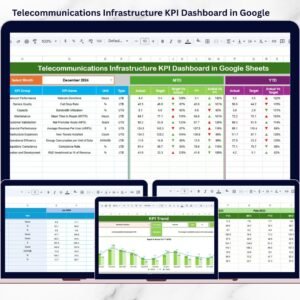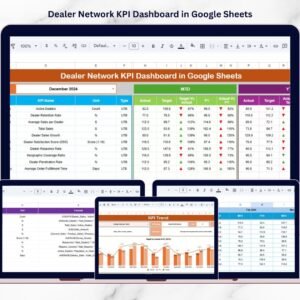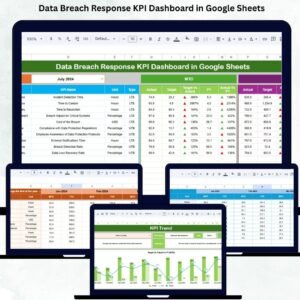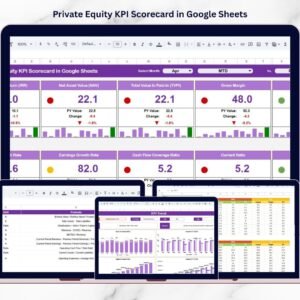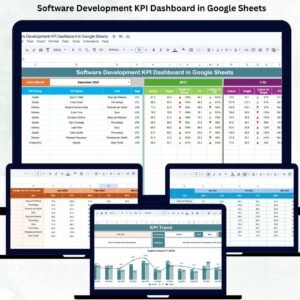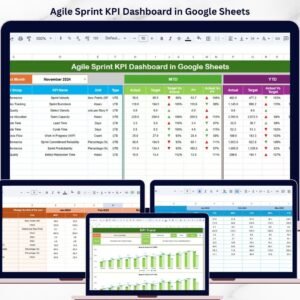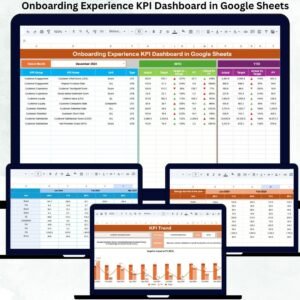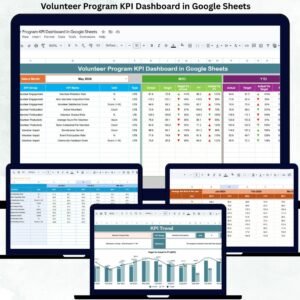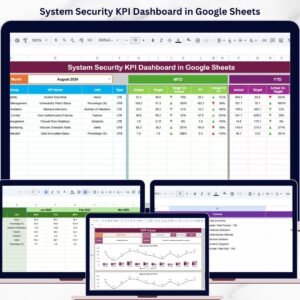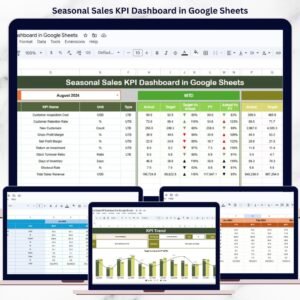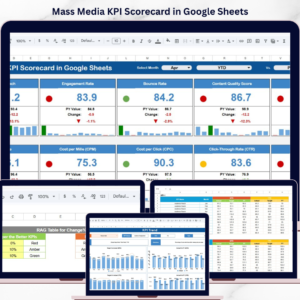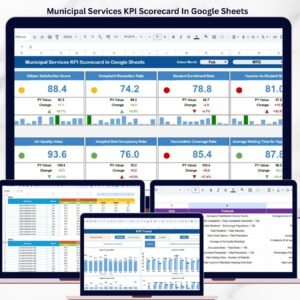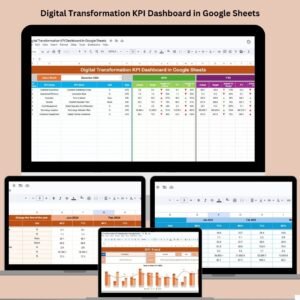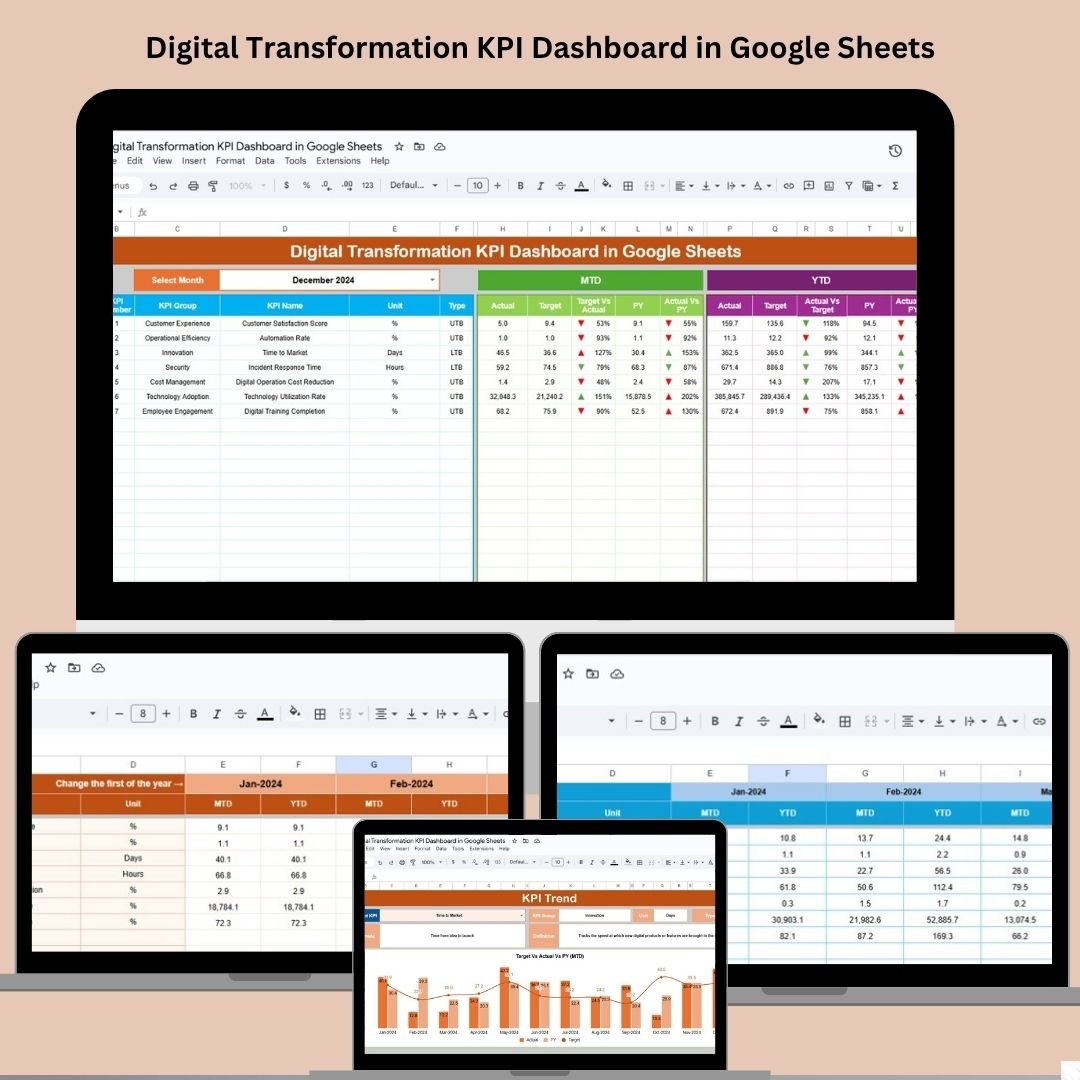
In a world driven by technology, digital transformation is no longer optional—it’s essential. To ensure that your initiatives are on track and delivering value, you need real-time insights into performance. That’s where the Digital Transformation KPI Dashboard in Google Sheets steps in. This fully interactive, ready-to-use dashboard helps you monitor, measure, and manage the key metrics driving your digital success.
Whether you’re a digital strategy lead, IT director, or operations head, this dashboard gives you a centralized view of all the KPIs you need—ranging from system adoption rates to customer satisfaction, digital sales, and operational efficiency.

📊 Key Features of the Digital Transformation KPI Dashboard
📍 Dashboard Sheet
Month Selector (Cell D3): Easily switch between months
KPI Cards: MTD Actual, Target, and Previous Year data; YTD Actual, Target, and PY
Trend Arrows: Instantly see if KPIs are improving or declining with up/down conditional formatting
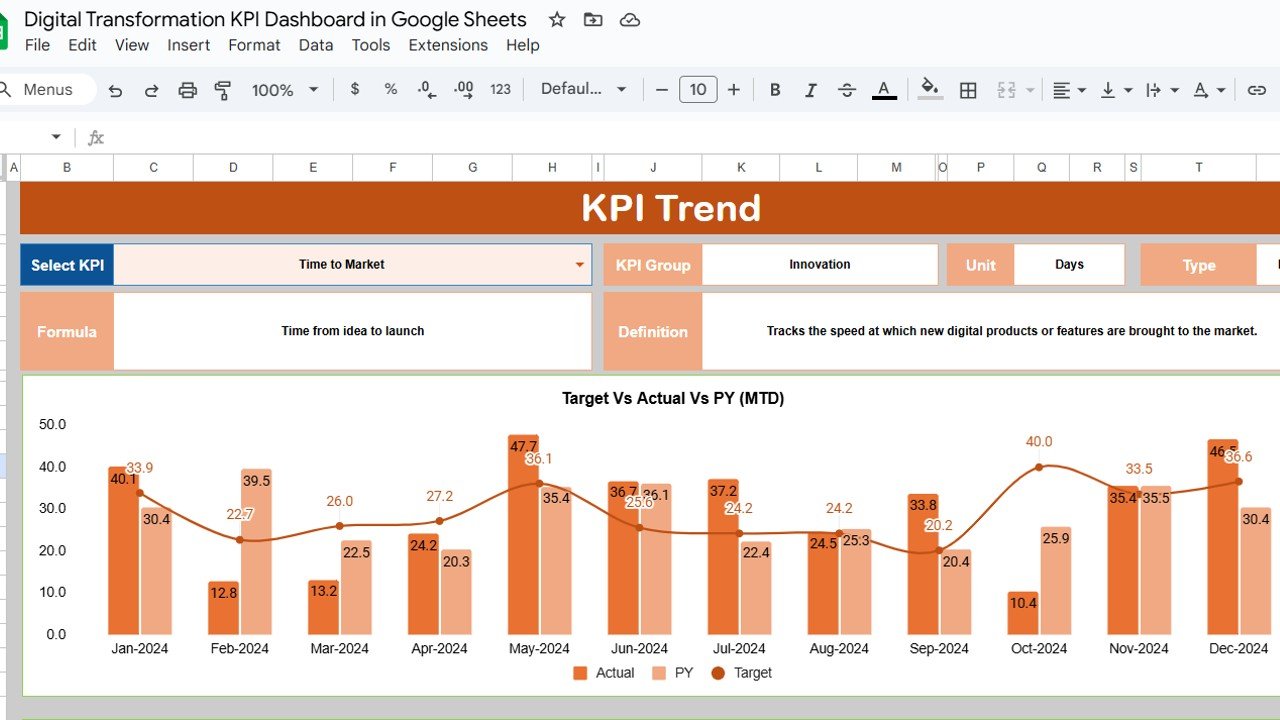
📈 KPI Trend Sheet
Dropdown (C3): Select the KPI you want to analyze
Trend Line Chart: See how the selected KPI is trending over time
KPI Group, Unit & Type: Understand whether the metric is LTB (Lower the Better) or UTB (Upper the Better)
Formula & Definition: Built-in reference to clarify calculation logic
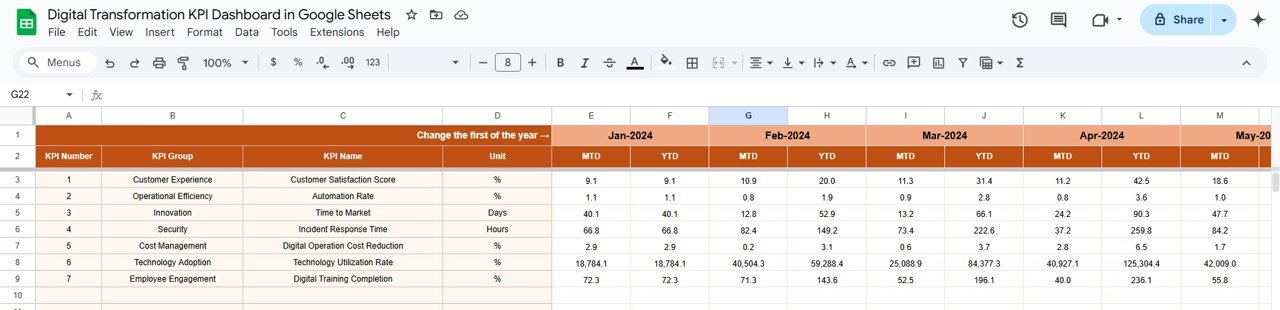
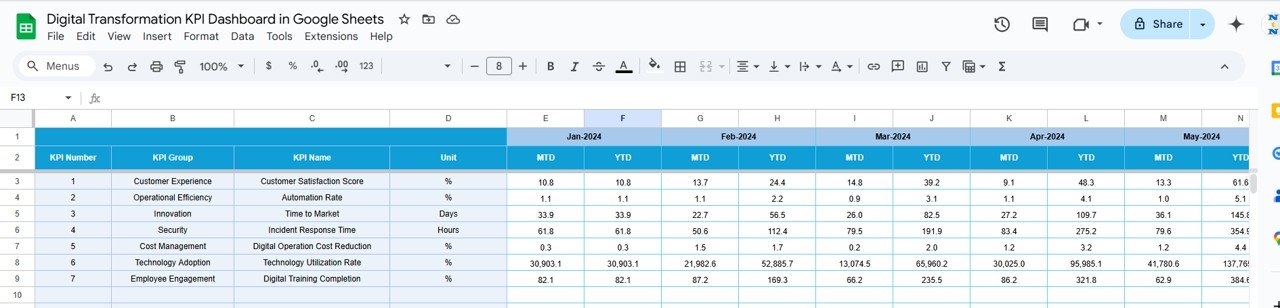
📥 Actual Numbers Sheet
Input MTD & YTD Values: Enter current month’s data for each KPI
Auto-Refresh Dashboard: Once values are updated, all sheets refresh dynamically
🎯 Target Sheet
Set Goals: Enter monthly and YTD targets for each KPI to benchmark performance
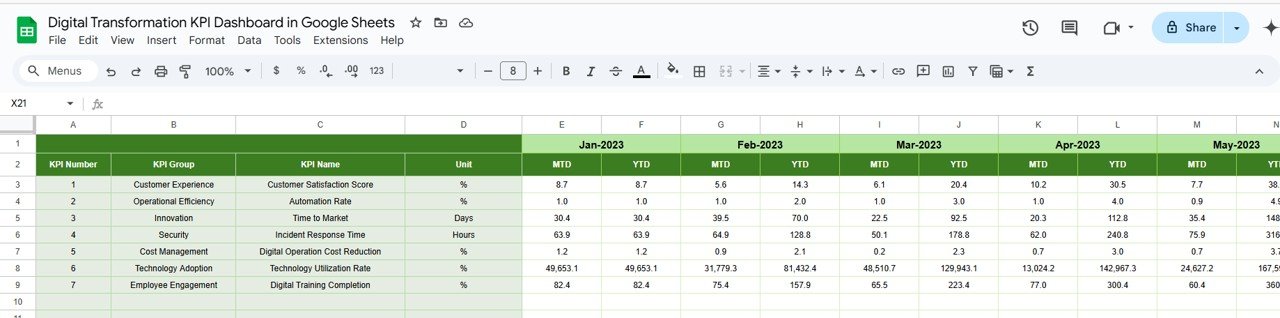
🕰️ Previous Year Numbers
Historical Tracking: Record previous year’s performance to compare and measure growth
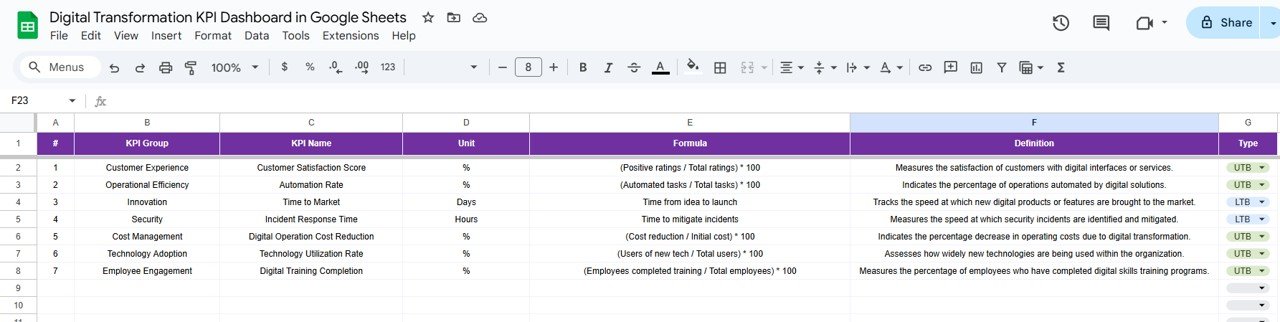
🧾 KPI Definition Sheet
Structured KPI List: Includes KPI Name, Group, Unit, Type (LTB/UTB), Formula, and Definition for full transparency
🎯 Advantages of This Dashboard
✅ Comprehensive View: Centralized platform to monitor all digital KPIs
✅ Data-Driven Insights: Helps you make informed strategic decisions
✅ Customizable Layout: Add or remove KPIs as per your digital goals
✅ Interactive Charts: Visual storytelling through trend lines and performance cards
✅ No Coding Required: 100% formula-based – no need for macros or scripts
✅ Collaborative Friendly: Easily share with teams on Google Workspace
✅ Ideal for Any Team: IT, Marketing, HR, and Leadership can all benefit
🔍 Common KPIs Tracked in the Dashboard
System Adoption Rate
Digital Sales Growth
Operational Efficiency Index
Customer Satisfaction Score (CSAT)
Automation Utilization
Digital Process Completion Time
Online Engagement Rate
Cost Reduction through Digitization
Support Ticket Resolution Time
Employee Digital Training Completion %
Each KPI includes its type—UTB (Upper the Better) or LTB (Lower the Better)—so your team knows where to focus.
🧠 Who Can Use This Dashboard?
🏢 Digital Transformation Teams: Track strategy execution
💻 IT Departments: Monitor adoption and tech usage
🧑💼 Operations Managers: Evaluate efficiency improvements
📊 Executives & CXOs: Make data-driven decisions on digital spend
📌 Best Practices for Using the Dashboard
Update Monthly: Keep your data fresh with timely MTD & YTD updates
Set Realistic Targets: Align KPIs with business goals
Monitor Trends: Use the KPI Trend sheet to identify success/failure patterns
Share Across Teams: Encourage transparency in digital performance
Customize as Needed: Add new KPIs or modify definitions to suit your organization
🔄 Opportunities for Improvement
🔗 Integrate with tools like CRM, ERP, or Finance systems for automated updates
📱 Develop a mobile version for leadership on-the-go
📉 Add forecasting models to anticipate future performance
🌐 Extend cross-department views for 360° tracking
📺 Learn how to use the dashboard on our YouTube Channel:
YouTube.com/@NeotechNavigators