

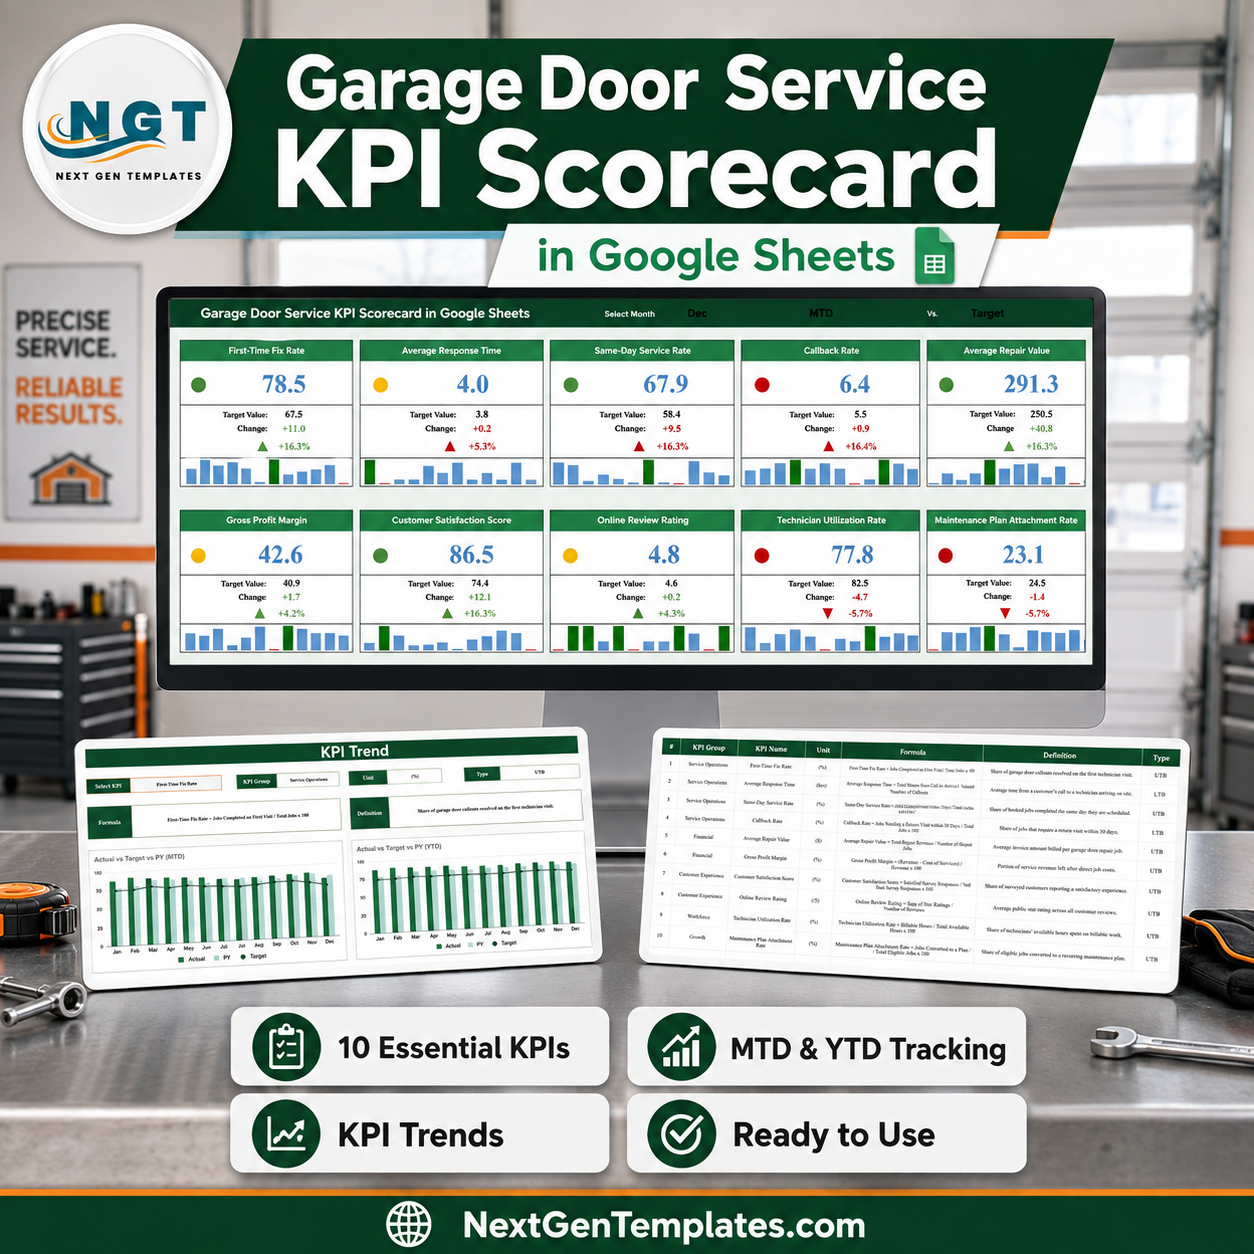

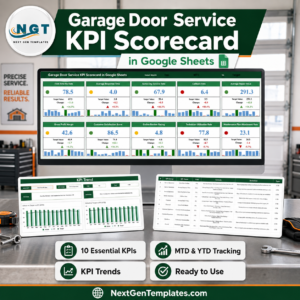
The Garage Door Service KPI Scorecard in Google Sheets puts ten garage door service KPIs on one screen with a traffic light against each one. Pick a month at the top, choose MTD or YTD, choose whether you are measuring against Target or PY, and all ten cards recalculate from a single 120-row data table. Every number in the file is a live formula, not a pasted value: 10 KPIs x 12 months x 6 measures = 720 figures driven by SUMIFS and named ranges. It is a one-time purchase of $8.99 (regular $13.99), it opens in any browser, and because it is a Google Sheet you get your own private copy that you can edit, share and undo without touching the original.
Which product is this? This is the KPI Scorecard edition – a month-picker traffic light scorecard. It is a different product from a Garage Door Service KPI Dashboard and different again from an analytical Garage Door Service Dashboard. The scorecard answers “are we on target this month, yes or no”. The dashboard lines answer “why”. If you want the analytical style instead, see the Plumbing Business KPI Dashboard in Google Sheets for the format, or browse the full Google Sheets KPI Dashboard category.
Key Features of the Garage Door Service KPI Scorecard in Google Sheets
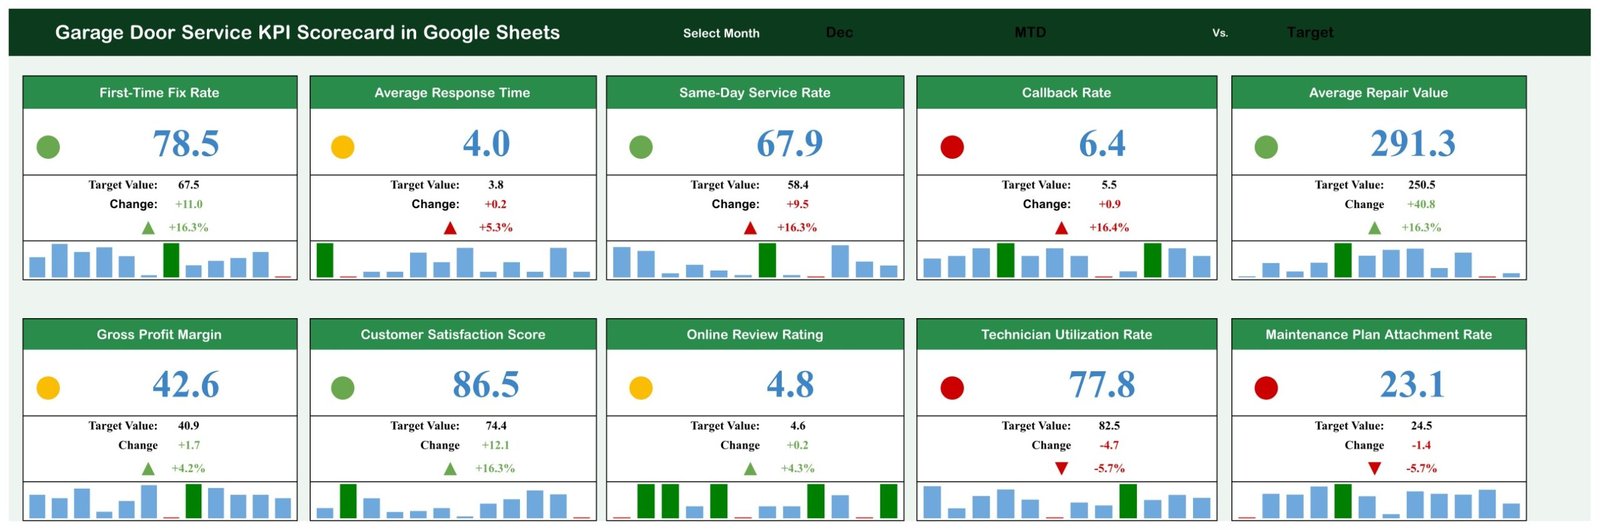
- Ten garage door KPIs on one page – laid out as two rows of five cards, each with a coloured status dot, the current value, the comparison value, the absolute change, the percentage change and a direction arrow.
- Three header switches – Select Month, MTD / YTD, and Vs. Target / PY. Changing any one of them redraws all ten cards at once; nothing is hard-coded to a single view.
- Direction-aware traffic lights – each KPI is tagged UTB (upper the better) or LTB (lower the better) on the KPI Definition tab, so Average Response Time and Callback Rate go red when they rise, while the other eight go red when they fall.
- Published RAG bands – green when the variance beats the comparison by more than 10%, amber inside 10%, red once the KPI is on or the wrong side of the comparison. The bands are written down, not hidden.
- 12-month mini bar strip on every card – a small in-card bar chart of all twelve months with the highest and lowest month picked out, so you see the shape of the year without leaving the scorecard.
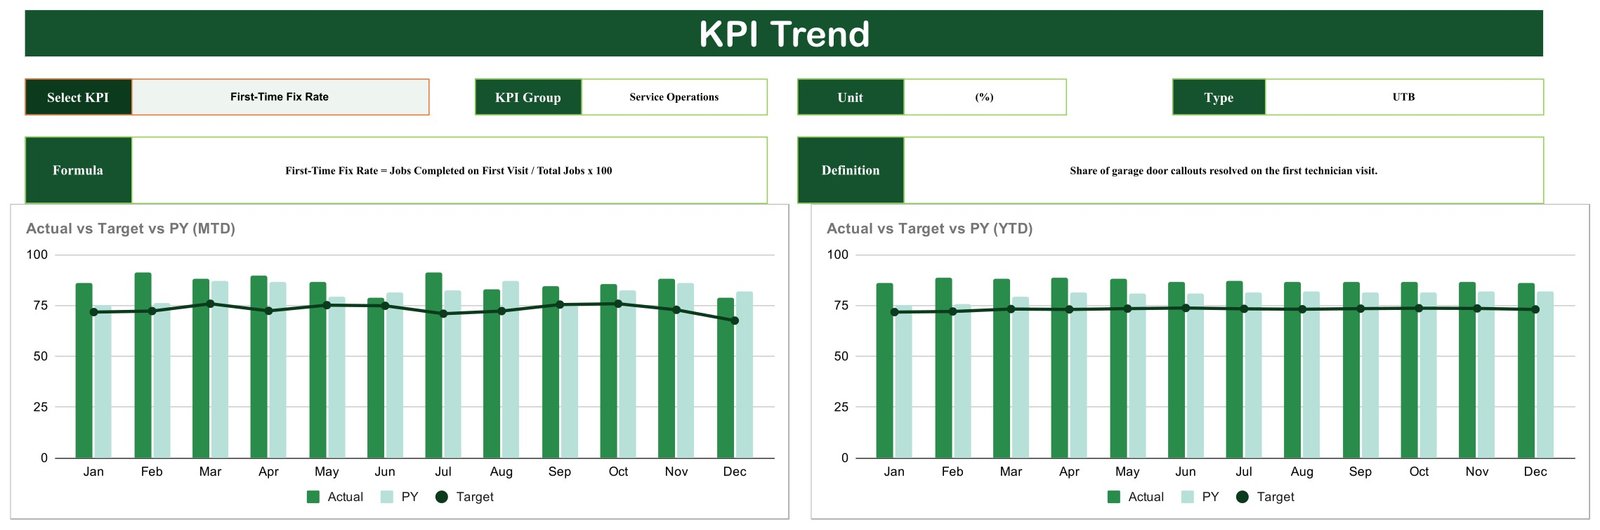
- A single-KPI drill-down page – the KPI Trend tab, with its own KPI picker that auto-fills the group, unit, direction, formula and plain-English definition.
- Two combo charts per KPI – Actual vs Target vs PY by Month (MTD) and Actual vs Target vs PY by Month (YTD): Actual and PY as clustered columns, Target as a line across Jan to Dec.
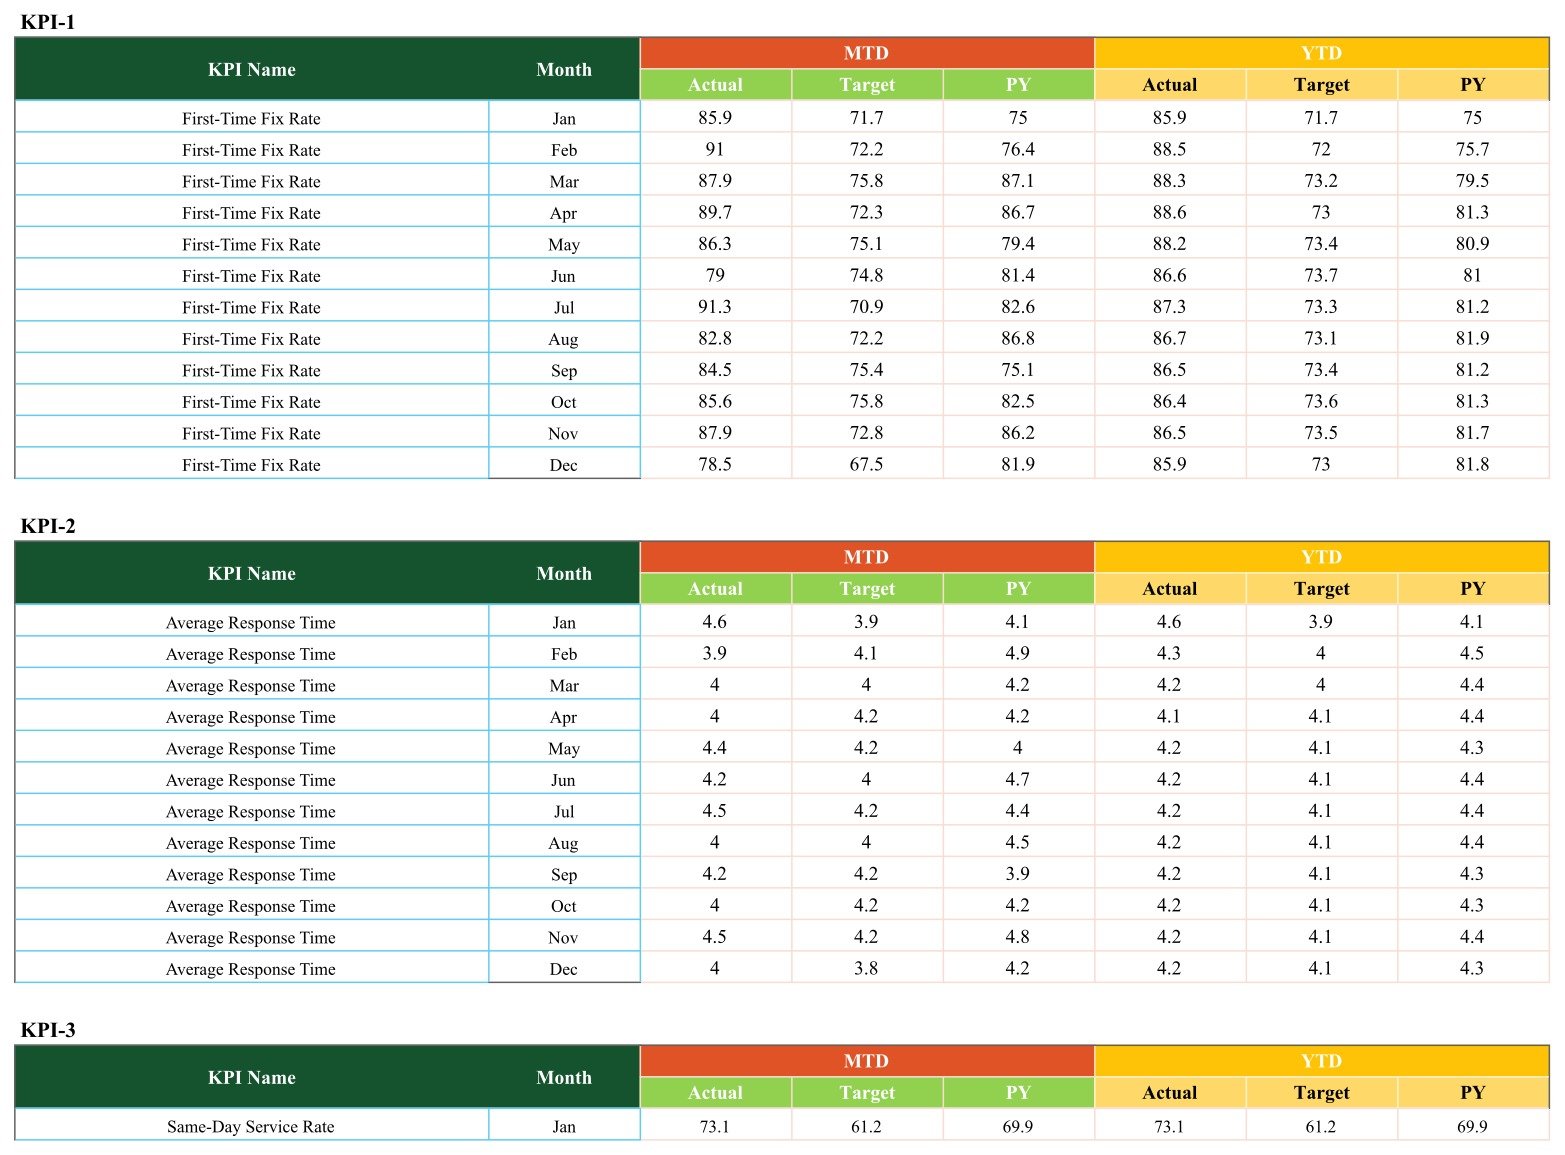
- One flat input table – 120 rows, six numeric columns, no pivot tables and no scripts. Overwrite the sample numbers with yours and the whole file follows.
- Unlimited users, no subscription – share the sheet with your dispatcher, your service manager and your owner at no extra cost.
What’s Inside the Garage Door Service KPI Scorecard in Google Sheets
Eight tabs, in the order you will use them:
- Read Me – a blank first tab kept for your own setup notes and internal handover instructions.
- Scorecard – the ten-card front page shown above, with the three header switches.
- KPI Trend – pick one KPI and see it across twelve months in both MTD and YTD form.
- Input Data – ten blocks of twelve monthly rows. Each row carries MTD Actual, MTD Target, MTD PY, YTD Actual, YTD Target and YTD PY.
- KPI Definition – the KPI register: number, group, name, unit, calculation formula, one-line definition and direction (UTB / LTB). This is what the Scorecard and KPI Trend pages read their labels from.
- Color Settings – a printed reference of the red / amber / green bands for both KPI directions.
- Support – the calculation engine. Every card value, comparison, change, arrow and colour is resolved here, and the live RAG thresholds sit on this tab.
- Trend_Support – the twelve-row Actual / Target / PY table that feeds the two trend charts.
The ten KPIs, exactly as shipped, grouped as they appear on the KPI Definition tab:
- Service Operations – First-Time Fix Rate (%), Average Response Time (hrs, lower is better), Same-Day Service Rate (%), Callback Rate (%, lower is better)
- Financial – Average Repair Value ($), Gross Profit Margin (%)
- Customer Experience – Customer Satisfaction Score (%), Online Review Rating (/5)
- Workforce – Technician Utilization Rate (%)
- Growth – Maintenance Plan Attachment Rate (%)
Garage Door Service KPI Scorecard vs. Microsoft Excel vs. Paid Field Service Software – Where This Fits
| This Google Sheets scorecard | An Excel KPI scorecard | Paid field service platforms | |
|---|---|---|---|
| Cost | $8.99 one time (regular $13.99) | One time, plus a Microsoft 365 licence | Recurring subscription, normally priced per technician per month |
| Platform | Google Sheets in any browser | Excel for Windows or Mac | Vendor web app plus a phone app |
| Setup time | Copy the sheet, paste 120 rows, rename the KPIs – under an hour | Similar, once the workbook is downloaded | Days to weeks: import customers, jobs, price book and technicians |
| Real-time team collaboration | Yes, native and included | Only through OneDrive co-authoring | Yes |
| Mobile access | Yes, Google Sheets mobile app | Limited on the Excel mobile app | Yes, purpose-built |
| Customizable KPIs and fields | Fully – the KPI names, units, formulas and directions are all cells you edit | Fully | Usually limited to the vendor’s KPI set |
| Share with a link | Yes, view or edit, no seat charge | Needs a file share or OneDrive link | Extra seats are usually chargeable |
| Year-1 cost at 5 users | $8.99 total | Price of the file, plus existing 365 seats | Hundreds to thousands of dollars, billed per seat per year |
| Direction-aware traffic lights (UTB / LTB) | Yes, per KPI, editable | Yes, in the Excel edition | Usually fixed by the vendor |
| Dispatching, invoicing, job scheduling | No – this is a measurement layer only | No | Yes, that is what you are paying for |
Who This Template Is For – and Who It’s Not For
It is for you if you run a garage door installation and repair business with two to twenty technicians, you already pull job counts and revenue out of your invoicing system or job board once a month, and you want a single page you can put on a screen in the office or send to an owner. It suits a service manager who wants callback rate and first-time fix rate in front of the crew every Monday, and an owner who wants gross profit margin and average repair value beside them.
It is not for you if you need live job dispatching, technician GPS, automated invoicing or a customer portal – this file measures the business, it does not run it. It is also the wrong shape if you need daily or per-job granularity: the grain here is one row per KPI per month. And if you want deep slice-and-dice by branch, technician or door type, you want the analytical dashboard line, not a scorecard.
How to Use the Garage Door Service KPI Scorecard in Google Sheets
- Take your own copy. The PDF you download after purchase carries a “Make a copy” link. Open it while signed in to Google and the file lands in your own Drive.
- Rewrite the KPI register first. On KPI Definition, change any of the ten KPI names, units, formulas or definitions, and set the Type column to UTB or LTB. Everything downstream reads its labels and its direction from this tab, so do this before anything else.
- Paste your numbers into Input Data. Keep the layout: one block per KPI, twelve month rows each, with the month written exactly as it appears in the sample (Jan, Feb, Mar and so on). Fill MTD Actual, MTD Target, MTD PY, YTD Actual, YTD Target and YTD PY.
- Set the header switches on the Scorecard. Choose the month, choose MTD or YTD, and choose whether you are comparing against Target or last year.
- Tune the RAG bands. The live thresholds are on the Support tab. The default is 10% either side; tighten it if your targets are soft.
- Drill into anything that is red. Go to KPI Trend, pick that KPI, and read the twelve-month MTD and YTD charts to see whether the miss is a one-month blip or a trend.

Real-World Use Cases
Marcus, owner of a six-van residential garage door company. Every first Monday he pastes last month’s figures into Input Data, sets the month, leaves the switch on MTD vs Target, and screenshots the Scorecard into the team chat. In the sample data December shows First-Time Fix Rate at 78.5 against a 67.5 target – green, +11.0 – while Technician Utilization sits at 77.8 against 82.5, red at -5.7%. Two numbers, one screen, and the Monday meeting has an agenda.
Dana, service manager at a commercial door contractor. Callback Rate is her problem KPI. She flips the header to Vs. PY to check whether this year is genuinely worse than last, then opens KPI Trend, selects Callback Rate, and reads the MTD chart month by month before she talks to any technician about it.
Priya, a bookkeeper serving four small trade businesses. She keeps one copy per client. Because the KPI names live in cells rather than in code, the garage door copy tracks Maintenance Plan Attachment Rate while the landscaping copy tracks something else entirely – same file, same formulas, different register.
Frequently Asked Questions
Is this the same as a Garage Door Service KPI Dashboard?
No. This is the KPI Scorecard edition: a fixed set of ten KPIs, one card each, red / amber / green against a target for the month you pick. A KPI Dashboard is a different product with a different layout and a different analytical emphasis. They are companions, not duplicates – many owners keep the scorecard for the monthly meeting and a dashboard for the deep dive.
Do I need a paid Google Workspace account?
No. A free personal Google account is enough to take a copy, edit it and share it. Nothing in the file needs Apps Script, add-ons or an enterprise plan.
Can I change the ten KPIs to my own?
Yes, and it is expected. Edit the KPI Definition tab – name, unit, formula text, definition and the UTB / LTB direction are all plain cells. Then update the matching KPI name in the Input Data blocks so the lookups still match, and the Scorecard and KPI Trend pages follow automatically.
Where does the data come from?
You paste it in. The file has no connectors and does not read your invoicing or dispatch system. That is deliberate: it keeps the sheet fast, private and free of the permissions that a live connection would need. Most owners spend fifteen to twenty minutes a month on the paste.
What does UTB and LTB mean?
UTB is “upper the better” – higher is good, like First-Time Fix Rate. LTB is “lower the better” – higher is bad, like Average Response Time and Callback Rate. The tag drives the colour logic, so an LTB KPI that rises above target turns red rather than green.
How are the traffic light colours decided?
By the percentage variance against whichever comparison you selected. For an upper-the-better KPI: more than 10% above the comparison is green, within 10% above is amber, at or below is red. For a lower-the-better KPI the bands are mirrored. Both bands are written out on the Color Settings tab and are editable on the Support tab.
Can more than one person use it at the same time?
Yes. It is an ordinary Google Sheet, so normal sharing applies – as many viewers and editors as you like, at no extra cost, on desktop or the mobile app.
About the Author
Built by PK – Microsoft Certified Professional with 15+ years of Excel, Google Sheets, and Power BI experience. Founder of NextGenTemplates, reaching 300K+ subscribers across YouTube channels. Every template is hand-built and tested before release.
Explore Related Templates
- Locksmith Business KPI Scorecard in Google Sheets – the closest sibling: same eight-tab build, a locksmith’s KPI register.
- Septic Tank Service KPI Scorecard in Google Sheets – same scorecard, route-based service trade.
- Electrical Contractor KPI Scorecard in Google Sheets – for a mixed trade shop.
- Auto Garage Job Card Management System Web App – if you need to run the jobs, not just measure them.
- Browse the whole Google Sheets template library.
Get the Garage Door Service KPI Scorecard in Google Sheets for $8.99 (regular $13.99). Instant download, unlimited users, no subscription, and a Google Sheet you own outright. Read the full walkthrough on the NeoTechNavigators guide, or see more build videos on YouTube.
Watch the step-by-step video Demo:
Last updated: 4 September 2026.
Compatibility and Requirements
- Works in Google Sheets. You need a free Google account and a web browser.
- You pick the month, MTD or YTD, and Target or PY from dropdowns at the top of the Scorecard. Google explains dropdowns in Create an in-cell dropdown list.
More Questions About This Template
Does this scorecard use macros or scripts?
No. Every figure is a live formula built on SUMIFS and named ranges, with no pivot tables and no scripts.
Is there an Excel version of this scorecard?
Yes. See the Garage Door Service KPI Scorecard in Excel.
Is there a dashboard version for the same KPIs?
Yes. The Garage Door Service KPI Dashboard in Google Sheets is the dashboard edition. There are also Excel and Power BI editions of the dashboard: Garage Door Service KPI Dashboard in Excel and Garage Door Service KPI Dashboard in Power BI.
How many rows of data do I need to fill in?
The Input Data tab has 120 rows: ten KPIs with twelve monthly rows each. Each row takes MTD Actual, MTD Target, MTD PY, YTD Actual, YTD Target and YTD PY.
Related Garage Door Service Templates
- Garage Door Service KPI Dashboard in Google Sheets: the dashboard edition for the same business
- Garage Door Service KPI Scorecard in Excel: the same scorecard in Excel
- Garage Door Service KPI Dashboard in Excel: the dashboard in Excel
- Garage Door Service KPI Dashboard in Power BI: the Power BI edition
- Google Sheets Business Pack (Pro): 14 business templates in one download
Browse all Google Sheets KPI dashboards.

































Reviews
There are no reviews yet.